Best Ichimoku Cloud Strategy: Accelerate Profits In 5 Steps
The best Ichimoku cloud strategy is a technical indicator system used to assess the markets and provide trading signals. It helps contain and limit losses in Forex trading. However, it is important to note that Forex trading still involves a substantial risk of loss.
The Ichimoku system is a Japanese charting and technical analysis method. Our team at Trading Strategy Guides has mastered the method over a long period of time.
The Ichimoku indicator was published in 1969 by a reporter, Ichimoku Kinkou Hyo, in Japan. This candlestick trading technique has stood the test of time.
The name Ichimoku tells a lot about the trading system, or at least it gives a description of the system.
Ichimoku = “One look, glance”.
Kinkou = “Balance, equilibrium”.
Hyo = “Chart, Graph”.
Get Our Free Swing Trading Report Today!
- Entry Points
- Exit Points
- Risk Managament
- Time Saving Tips
The Ichimoku cloud strategy attempts to identify a probable direction of price. It helps the trader determine the most suitable time to enter and exit the market by providing you with the trend direction. It gives you reliable support and resistance levels and the strength of these market signals.
Now….
Before we delve deeper into the Ichimoku Cloud strategy, let’s look at the indicators needed to successfully trade the strategy.
Table of Contents
What is the Ichimoku Cloud Strategy in Trading? Best Ichimoku Strategy
The most popular Forex trading platforms use the Ichimoku Cloud indicator. The Ichimoku indicator paints all the components needed to help visualize the price action better. The Ichimoku cloud is one of the most comprehensive technical indicators in modern use. Unsurprisingly, it has quickly become the “go-to” indicator for forex traders around the world.
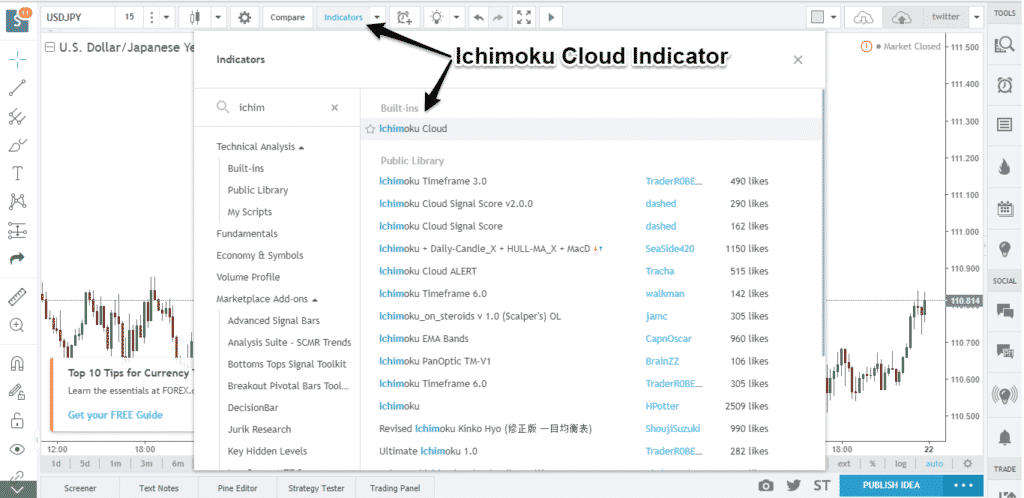
In the Ichimoku cloud section, we are going to give you an in-depth overview of the Ichimoku components.
So, before moving forward, let’s define all the Ichimoku Cloud components. We will review how to correctly interpret the trade signals generated by this technical indicator.
Ichimoku Cloud Explained
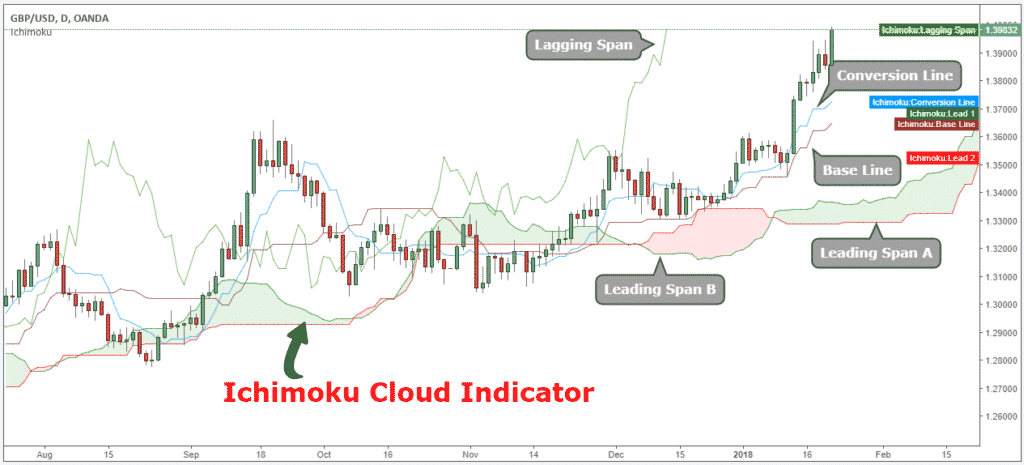
The Ichimoku Hinko Hyo is a momentum indicator used to recognize the direction of the trend. It can also define accurate support and resistance levels. The Ichimoku Cloud indicator consists of five main components that provide you with reliable trade signals:
- Tenkan-Sen line also called the Conversion Line, represents the midpoint of the last 9 candlesticks. It’s calculated with the following Ichimoku formula: [(9-period high + 9-period low)/2].
- Kijun-Sen line also called the Base Line, represents the midpoint of the last 26 candlesticks. It’s calculated with the following formula: [(26-period high + 26-period low)/2].
- Chiou Span also called the Lagging Span, lags behind the price (as the name suggests). The Lagging Span is plotted 26 periods back.
- Senkou Span A also called the Leading Span A, represents one of the two Cloud boundaries and it’s the midpoint between the Conversion Line and the Base Line: [(Conversion Line + Base Line)/2]. This value is plotted 26 periods into the future and it’s the faster Cloud boundary.
- Senkou Span B or the Leading Span B, represents the second Cloud boundaries and it’s the midpoint of the last 52 price bars: [(52-period high + 52-period low)/2]. This value is plotted 52 periods into the future and it’s the slower Cloud boundary.
- Chikou Span represents the closing price and is plotted 26 days back.
Next…
We’ll outline how to master the Ichimoku cloud trading.
See below:
How to use Ichimoku Cloud Indicator in Trading? Best Ichimoku Strategy
While the Ichimoku Cloud indicator involves multiple (five) different lines, reading the graph is actually very easy. Using the trend lines mentioned above, you will then need to determine whether Leading Span A or Leading Span B is currently higher.
Once Leading Span A and Leading Span B have been identified, the “cloud” component of this graph will be shaded in. When Leading Span B is above Leading Span A, this indicates to traders that price momentum is currently increasing. When this is the case, the graph will be shaded green.
On the other hand, when Leading Span A is above Leading Span B, the underlying asset is likely moving in a negative direction. When this happens, the cloud will be shaded red. Despite the graph’s complications, simply looking at the colors of the cloud can help you determine the direction of the market.
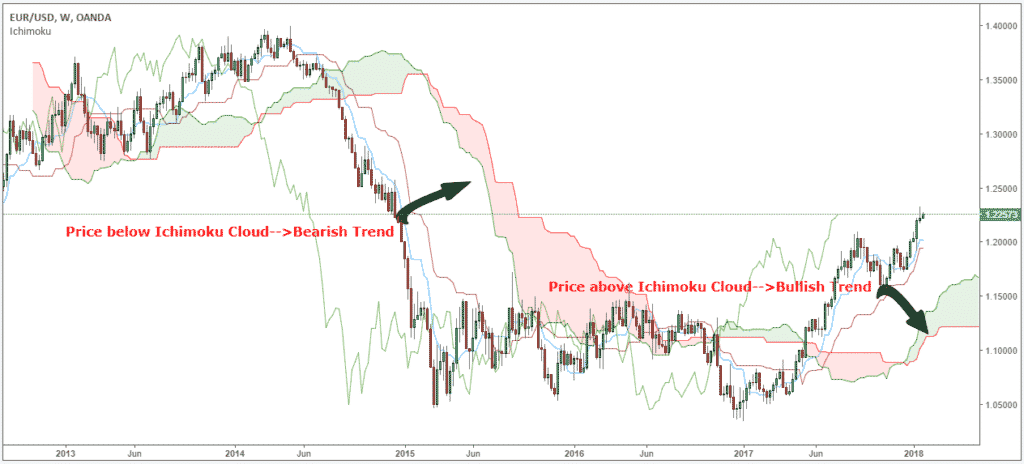
Here are some basic interpretations of the Ichimoku charts:
- When the price is above the Cloud, we’re in a bullish trend.
- When the price is below the Cloud, we’re in a bearish trend.
- When the price is in the middle of the cloud the trend is consolidating or ranging.
Furthermore, the Ichimoku charting technique provides bullish and bearish signals of various strengths.
When the Tenkan crosses Kijun from below, it is considered a bullish signal. When the Taken crosses the Kijun from above, it is considered a bearish signal. The Kijun line is shown as the red line above.
The strength of the Ichimoku cloud strategy trading signals are assessed based on three factors:
- How far away is the price movement relative to the Cloud?
- How far away is the Chiou Span relative to the Cloud?
- How far away is the Cross-over relative to the Cloud?
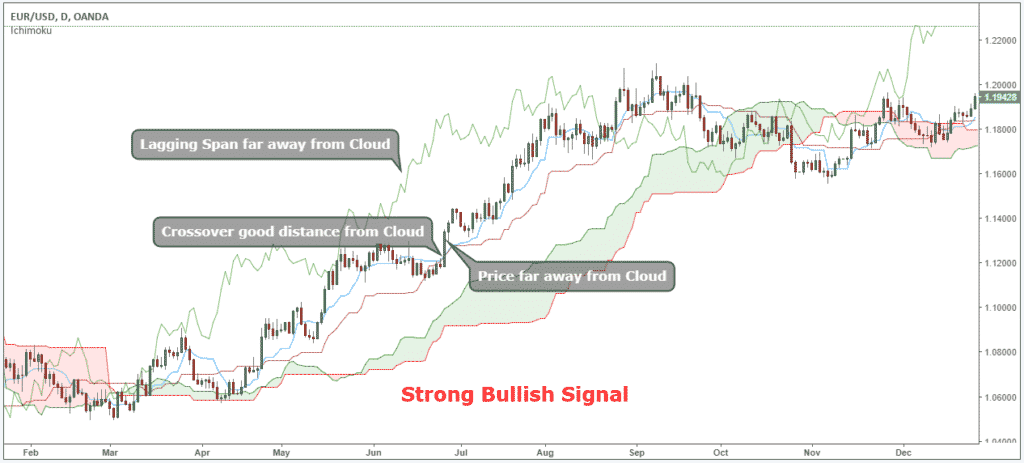
Because many of the lines on the Ichimoku Cloud chart are created using averages, the chart is often compared to a simple moving average chart. However, Ichimoku is more dynamic than a simple moving average chart as it’s designed to help detect changes in support and resistance.
The relationship between Leading Span A and Leading Span B will indicate whether there is a strong downtrend or uptrend. Pay attention to both the color (green for bullish, red for bearish) and the size of the cloud. When the “cloud” between these lines is small, then the trend will not be very strong.
The Ichimoku Cloud is useful for day traders and others who need to make quick decisions. The cloud is often paired with other technical indicators, such as the Relative Strength Index, in order for traders to get a complete picture of resistance and support. Many traders will also look out for crossovers in order to determine when trends have reversed.
Ichimoku cloud trading requires a lot of self-discipline. This is because you have to wait for the best trade signals. We’re going to use the default settings of the Ichimoku Cloud system.
Next…
Let’s see a unique way day traders can take advantage of a very unique price pattern:
See below:
How to Use Ichimoku Cloud for Day Trading Best Ichimoku Strategy
The best Ichimoku cloud day trading technique is the edge-to-edge cloud setup.
According to the Ichimoku cloud edge-to-edge strategy, the price has the tendency to visit the other side of the Kumo cloud once a candlestick closes inside the Ichimoku cloud.
As you can figure out the Ichimoku buy sell signals are very intuitive:
- Buy signals occur when a candlestick from below the Kumo cloud breaks and closes above the Leading span A.
- See signals occur when a candlestick from above the Kumo cloud breaks and closes below the Leading span A.
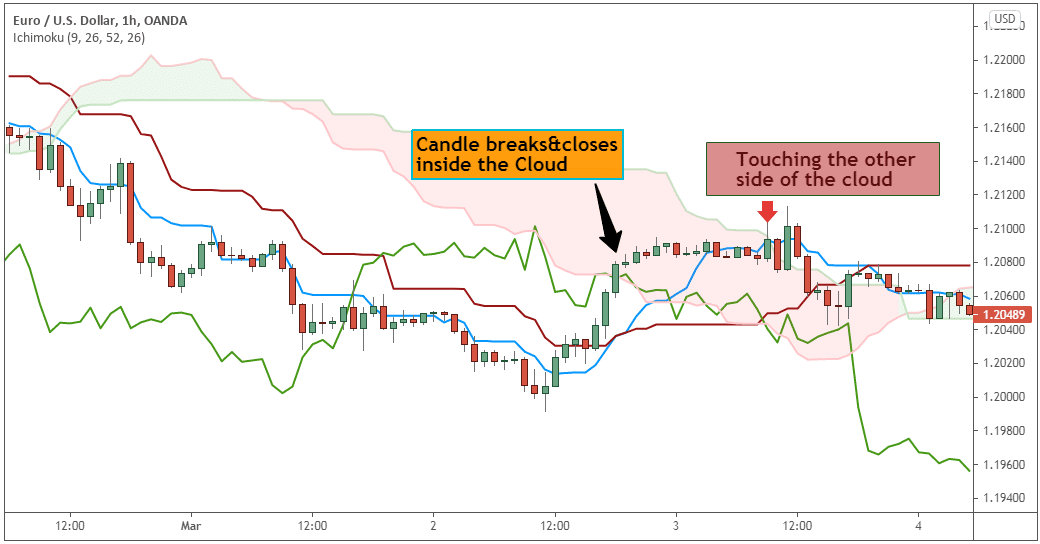
On a day-to-day basis, you’ll have enough edge-to-edge trade signals to reach your profit goals.
Now, if you want to improve the stats of the Ichimoku cloud day trading strategy you can always use the other elements of the Ichimoku indicator to filter out some of the false signals that will naturally show up.
Next…
Let’s see how to trade the Ichimoku indicator if you’re a swing trader.
See below:
How to Use Ichimoku cloud for Swing Trading Best Ichimoku Strategy
Swing trading with Ichimoku Cloud works extremely well if you use the Kumo twist trade signal. Please note that the Kumo cloud is the leading element (projected 26-periods into the future) of the Ichimoku indicator.
Now:
You might wonder:
“What is a Kumo twist?”
The Kumo cloud twist happens when the Leading Span A and Leading Span B cross. When Leading Span A crosses above Leading Span B that’s a bullish reversal signal and when Leading Span A crosses below Leading Span B that’s considered to be a bearish reversal signal.
See the Ichimoku chart below:
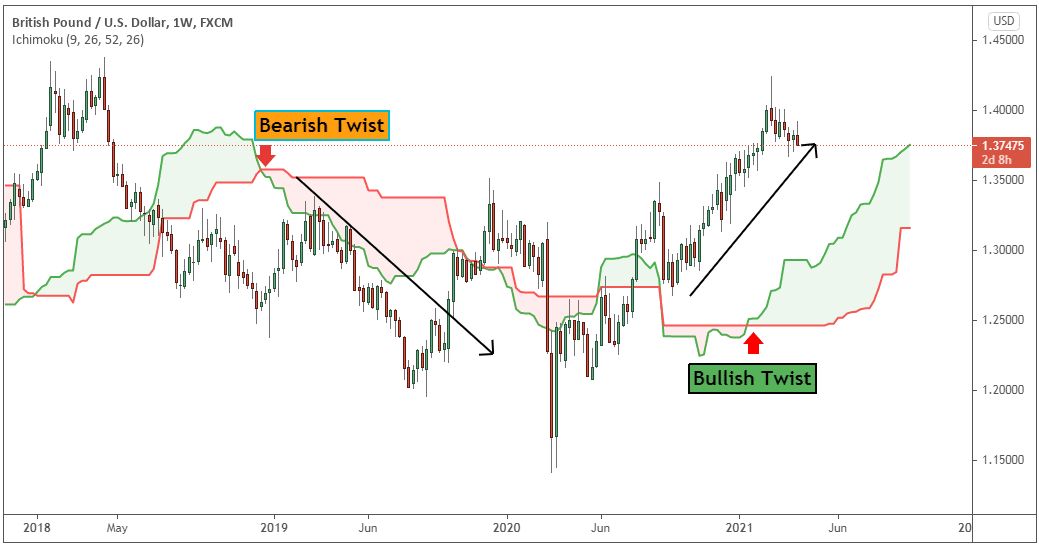
Note* The cloud will switch colors from green to red and vice-versa when the Kumo twist happens.
Now, let’s move one step forward and learn how to make money by applying the Ichimoku trading rules.
Note* Moving forward, we’re not going to delete the Lagging Span moving average from our charts. This is because we don’t base our trade decision on it since it’s lagging the price.
The Best Ichimoku Strategy – Buy Rules
The Ichimoku Cloud system is designed to keep traders on the right side of the market. Our trading rules will help you follow the trend for as long as possible. At least until it’s clear that a reversal is occurring. The Ichimoku system suits swing trading best. This is because it maximizes profits while minimizing the risk involved in trading. Here is how to identify the right swing to boost your profit.
The Ichimoku Kinko Hyo best time frame is the one that fits you best. As we don’t have a preferred time frame.
This swing trading strategy will teach you how to ride the trend right from the beginning. You will also learn how to capture as many profits as possible.

Ichimoku Cloud Trading: Step-by-Step Best Ichimoku Strategy
Total Time: 1 hour
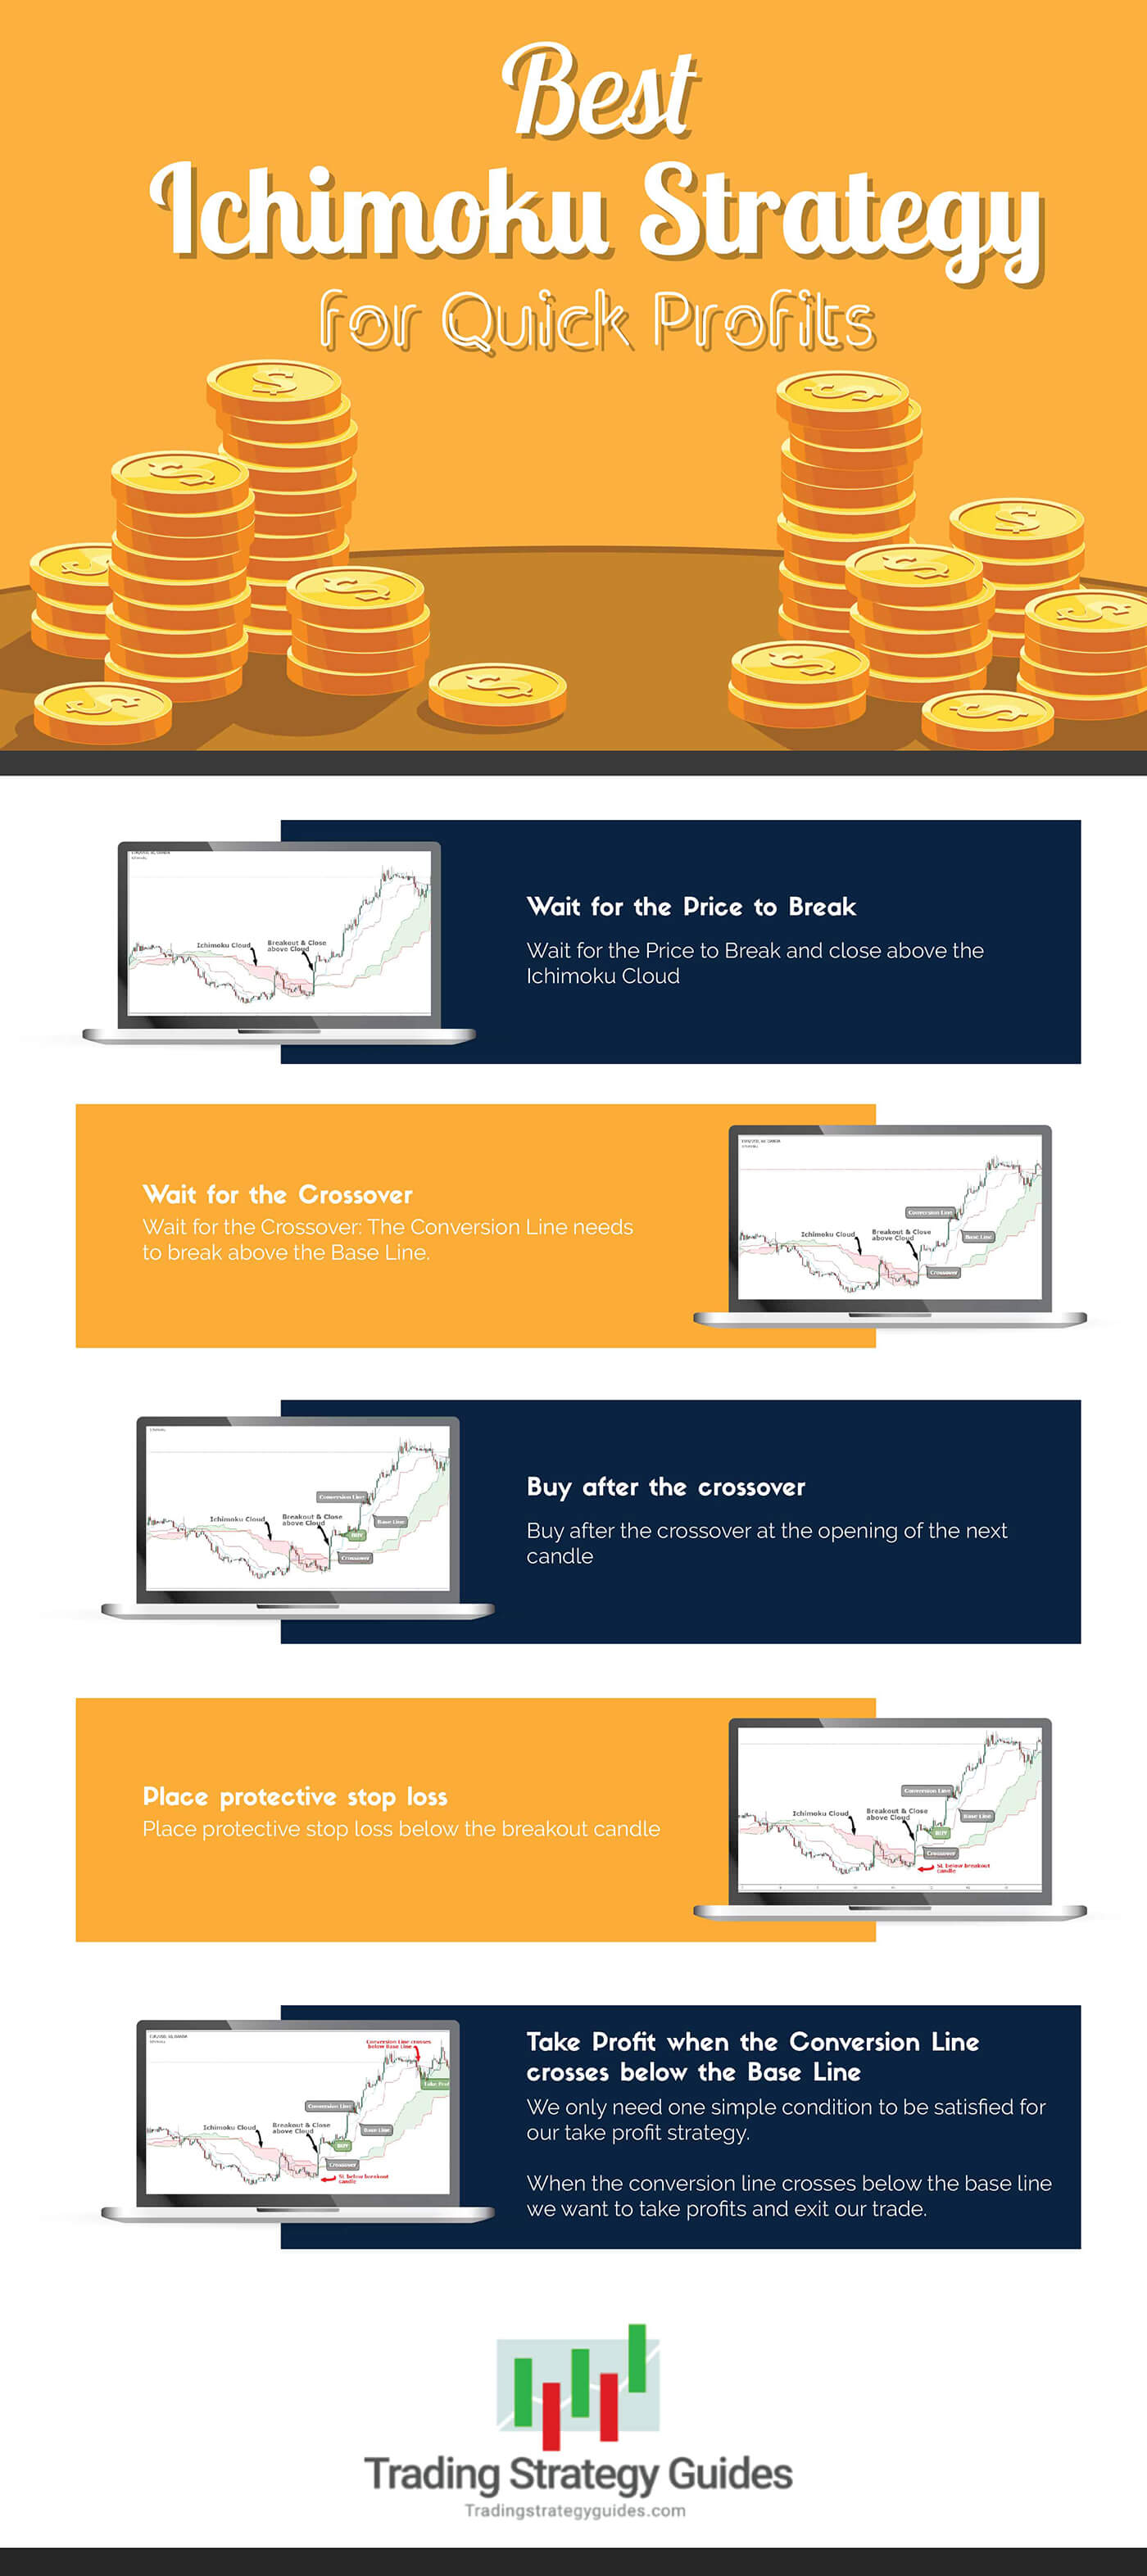
Step #1 Wait for the Price to Break and close above the Ichimoku Cloud.
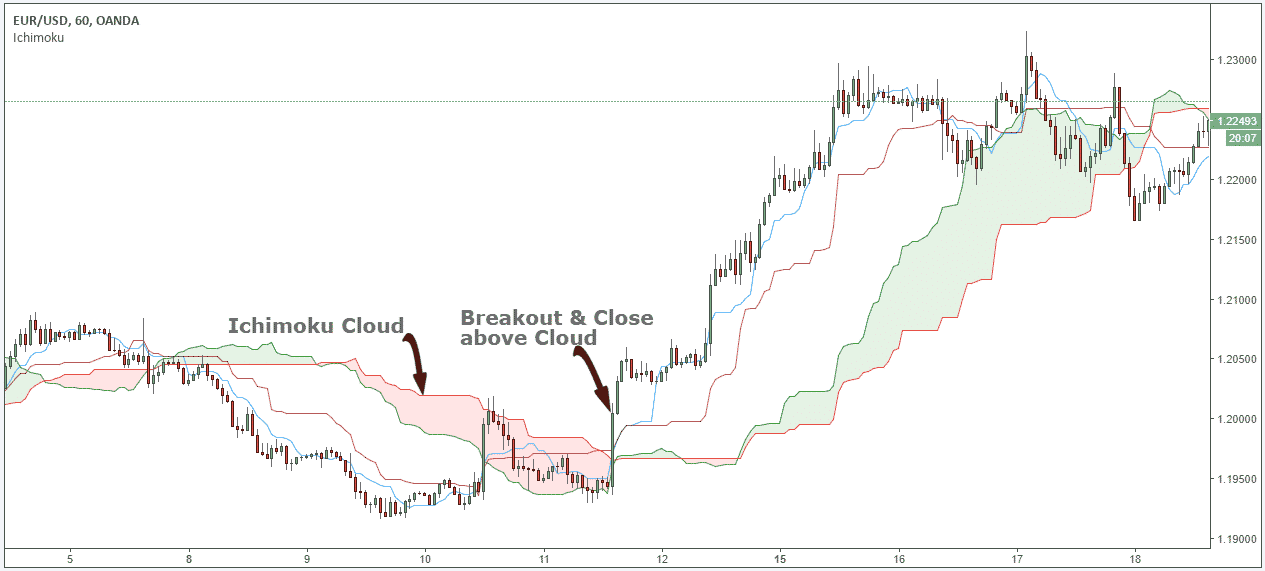
Ichimoku cloud trading requires the price to trade above the Cloud. This is because it’s a bullish signal and potentially the beginning of a new up-trend.
The cloud is built to highlight support and resistance levels. It highlights several layers deep because support and resistance is not a single line drawn in the sand. It is several layers deep.
So, when we break above or below the Ichimoku Cloud, it signals a deep shift in the market sentiment.
A high probability trade setup requires more layers of confluence before pulling the trigger.
This brings us to our next requirement for a high probability trade setup.
Step #2 Wait for the Crossover: The Conversion Line needs to break above the Base Line.
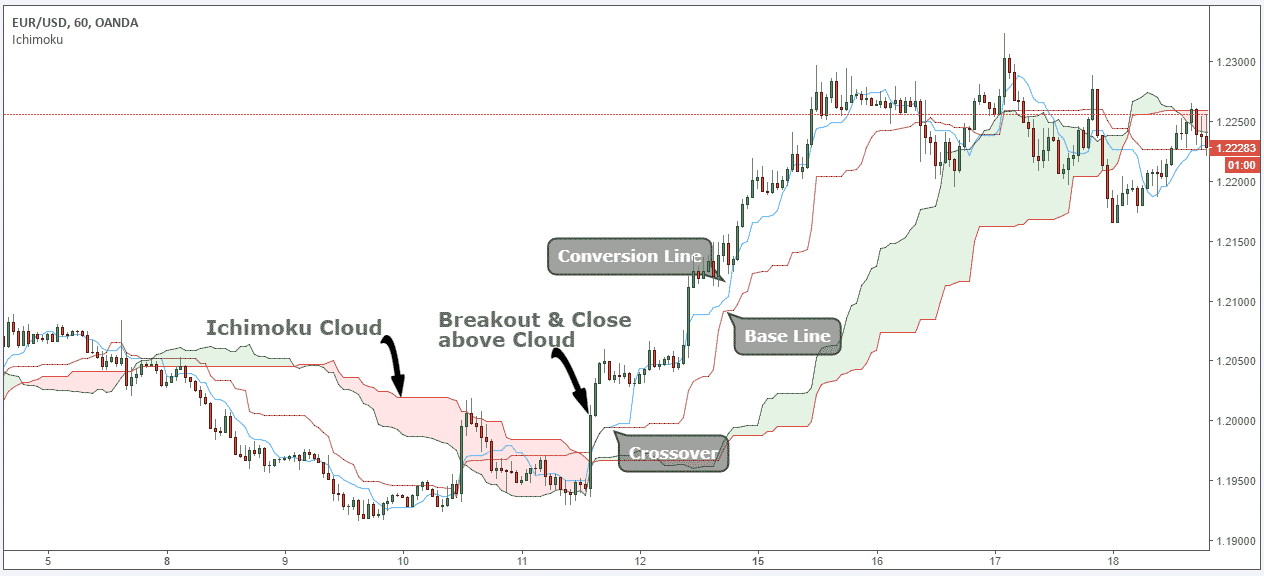
The price breakout above the Cloud needs to be followed by the crossover of the Conversion Line above the Base Line. Once these two conditions are fulfilled, we can look to enter a trade.
The Ichimoku Cloud indicator is a very complex technical indicator. The indicator is even used as a moving average crossover strategy.
Now, we’re going to lay down a very simple entry technique for the Ichimoku Kinko Hyo trading system.
See image:
Step #3 Buy after the crossover at the opening of the next candle.
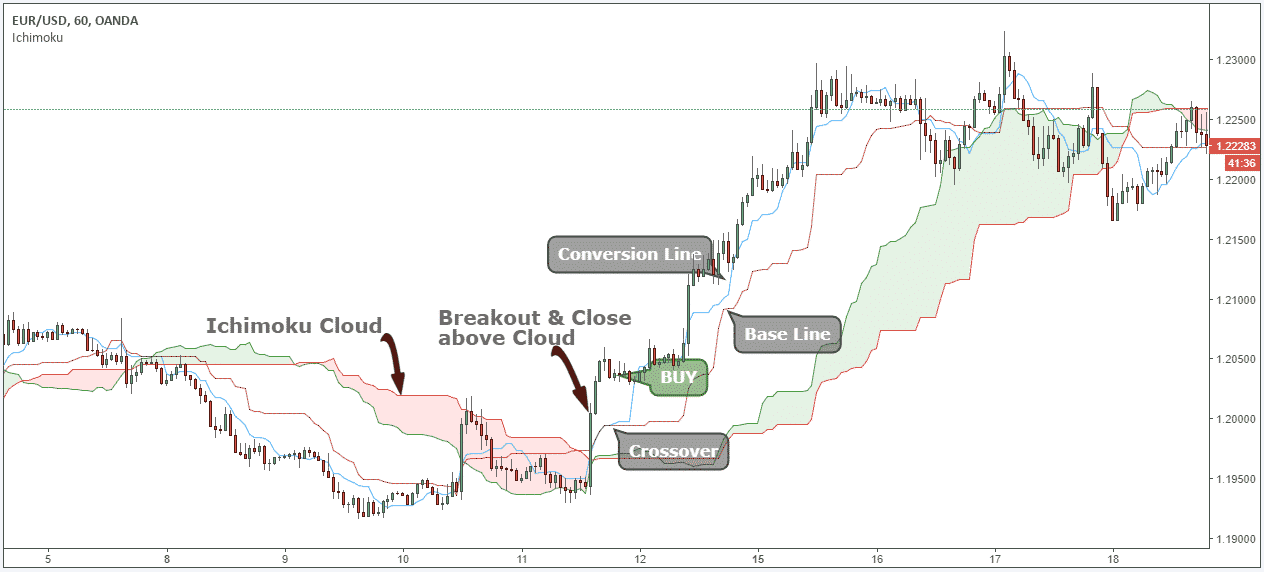
Ideally, any long trades using the Ichimoku strategy are taken when the price is trading above the Cloud. Our team at the TSG website has adopted a more conservative approach. We added an extra factor of confluence before pulling the trigger on a trade.
So, after the crossover, we buy at the opening of the next candle.
(Notice the strong buy signal in the graph below.)
The next important thing we need to establish is where to place our protective stop loss.
See below…
Step #4 Place protective stop loss below the breakout candle.
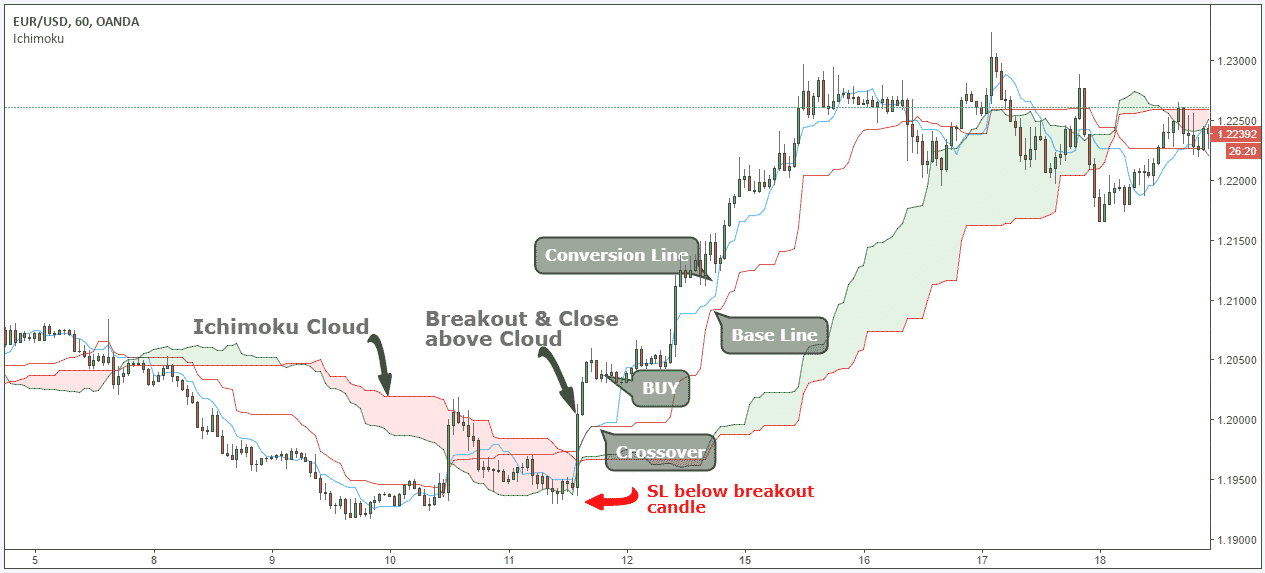
The ideal location to hide our protective stop loss is below the low of the breakout candle. This trading technique accomplishes two major things. Here is an example of a master candle setup.
First, it’s significantly lowering the risk of losing big money. Second, it helps us trade with the market order flow.
Since this is a swing trading strategy, we’re looking to capture as much as possible from this presumably new trend. We’ll be looking to trail our stop loss level below the Cloud or exit the position once a new crossover happens in the opposite direction.
The next logical thing we need to establish for the Ichimoku trading system is where to take profits.
See below…
Step #5 Take Profit when the Conversion Line crosses below the Base Line.
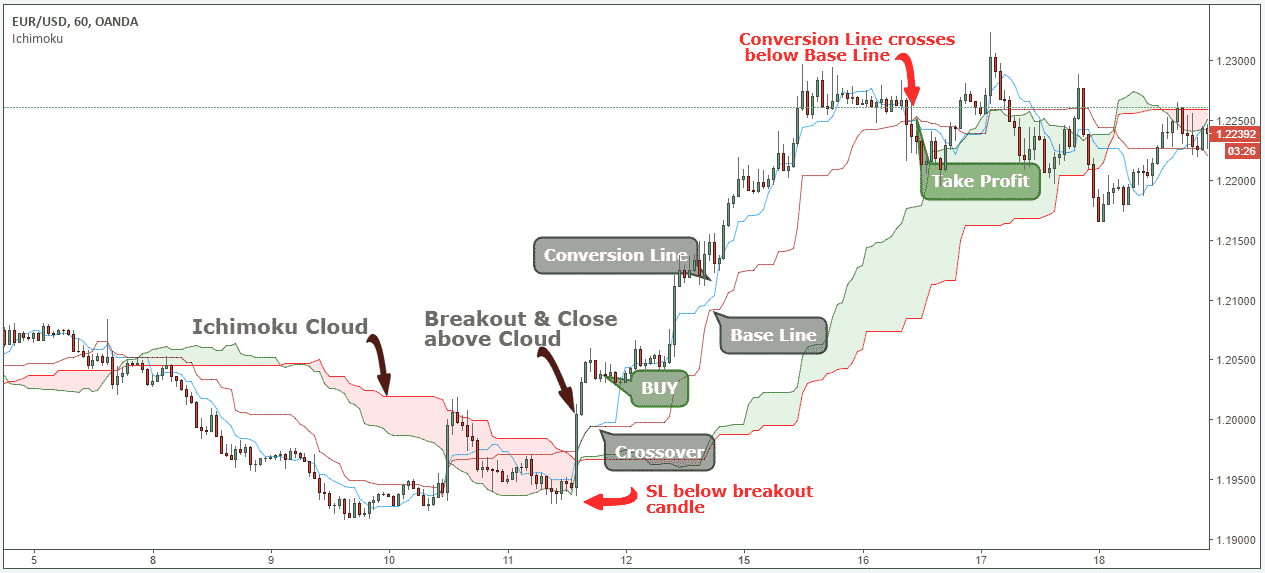
We only need one simple condition to be satisfied with our take profit strategy.
When the conversion line crosses below the baseline we want to take profits and exit our trade.Alternatively, you can wait until the price breaks below the Cloud, but this means risking to lose some parts of your profits. In order to gain more, sometimes you have to be willing to lose some.
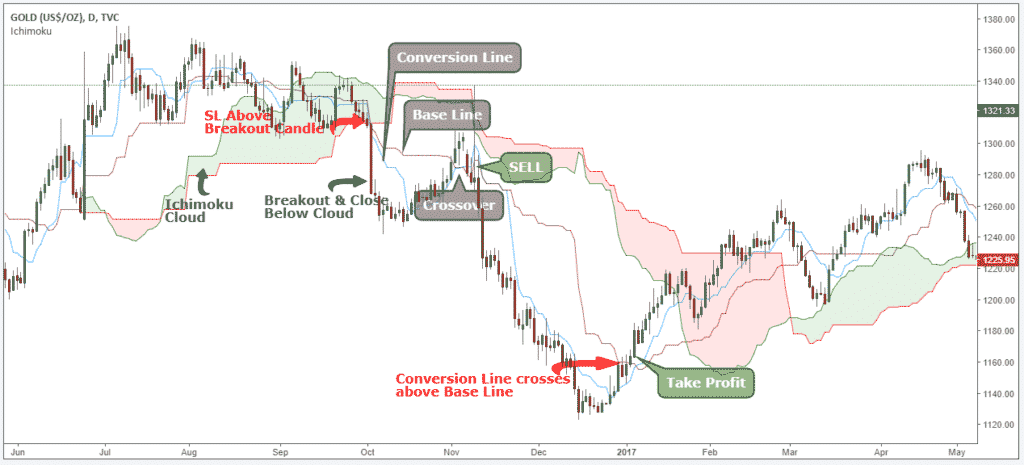
Note** the above was an example of a BUY trade using the advanced Ichimoku trading strategies. Use the same rules for a SELL trade – but in reverse. In the figure below, you can see an actual SELL trade example.
Supply:
- Ichimoku Cloud Indicator
Tools:
- Ichimoku Cloud Indicator
Materials: Ichimoku Cloud Indicator
(See the strong sell signal in the conversion line.)
Frequently Asked Questions for the Ichimoku Trading System Best Ichimoku Strategy
We have complied a list of the most common questions for the best Ichimoku strategy, so that you can easily apply these tips to your trading arsenal. Best Ichimoku Cloud Strategy is one of our favorite strategies.
Can I use Ichimoku cloud for day trading?
Yes, the Ichimoku Cloud Strategy can be used for day trading to identify trends and potential trading opportunities.
There are two ways to use the Ichimoku Cloud for day trading:
1.Identify potential entry and exit points based on the cloud’s upper and lower boundaries.
2. Use the Tenkan-sen and Kijun-sen lines as dynamic support and resistance levels to make trading decisions.
What are the best Ichimoku Cloud Strategy settings for scalping?
You can use the Ichimoku cloud trading strategy for scalping and for the 1-minute chart however there are no best settings. The important thing to remember is that you should keep winners larger than your losers. For example if you risk $1 on the trade you should make $2 or more on each position.
Do you have a Ichimoku strategy pdf for Download?
Yes! we have found that keeping the best Ichimoku Strategy PDF is a great way to learn the strategy. We sometimes print it and keep it right next to our desk when trading so we can reference it quickly. You can grab this here for free.
How to Use the Ichimoku Cloud?
Ichimoku Cloud is a technical tool used in trading. It identifies trends, support and resistance levels, and entry and exit points. Use the cloud’s upper and lower boundaries and Tenkan-sen and Kijun-sen lines as dynamic support and resistance levels.
Here is the 4 step quick reference guide:
1. Identify the trend direction: The Ichimoku Cloud provides a visual representation of the trend direction by plotting a cloud that consists of two lines, namely the Senkou Span A and Senkou Span B. If the cloud is green, it indicates an uptrend, while a red cloud represents a downtrend.
2.Look for support and resistance levels: The Ichimoku Cloud can also help identify key support and resistance levels. The Tenkan-sen and Kijun-sen lines can act as dynamic support and resistance levels, while the cloud’s upper and lower boundaries can act as static support and resistance levels.
3. Confirm signals with other indicators: Traders can use other technical indicators such as the Relative Strength Index (RSI) or Moving Average Convergence Divergence (MACD) to confirm signals generated by the Ichimoku Cloud.
4. Set stop-loss orders: Traders should always set stop-loss orders to minimize potential losses in case the market moves against their position.
Final Thoughts: Ichimoku Cloud Strategy Explained: Best Ichimoku Strategy
The best Ichimoku strategy is slightly different than probably anything you’re used to when it comes down to technical analysis. If you’re having a very difficult time finding true support and resistance, please apply the Ichimoku cloud trading techniques highlighted in this course.
We hope that by now you’re convinced that the Ichimoku Cloud system is a good way of identifying the trends and profit from trading any market in any time frame. It can easily capture 80% of the trend if you follow the rules in the Ichimoku Cloud explained section.
Thank you for reading! Best Ichimoku Strategy.
Please leave a comment below if you have any questions about Best Ichimoku Strategy!
Looking to trade $1,000 with Ichimoku Right Now?
Our Ichimoku Strategy experts at Trading Strategy Guides believe there’s a more lucrative opportunity than just trading a single Ichimoku strategy. In fact, before you make any decisions about the market, consider this:
Our team of analysts specializing in Ichimoku trading just unveiled their top, fully-developed Ichimoku trading system for traders looking to capitalize on market momentum.
At Trading Strategy Guides, we want to make sure you understand the market’s momentum before entering in a trade.
Our Ichimoku Ninjas Trading System has helped hundreds of traders find success and beat the market consistently. Don’t miss the next opportunity!
Ichimoku Cloud Strategy Video
Here is a video on Ichimoku taught by Tim Black!
Ichimoku Cloud Strategy PDF
Please Share this Trading Strategy Infographic Below and keep it for your own personal use! Thanks, Traders!





Thank you for explaining this awesome strategy, but i have 1 question. In the sell example, the crossover already took place before or at the same time the candle broke trough the cloud, but you did not take the trade and waited for the next crossover. when i understand this right, then i have to wait for the crossover, after the candle broke trough the cloud, right?
Yes that is correct! And thanks for the comment, glad you enjoyed the content.
Can you explain why in the sell example you have to wait? The candle broke and closed below the cloud. The baseline was already over the conversion line. You are proposing waiting and letting the Conversion line cross over the baseline and then the baseline cross back over the conversion line. Has it been your experience that when the candle breaks the cloud and the baseline is already over the conversion line there will be a retrace? This allows the conversion line and the baseline swap back and forth? Please explain I love this system and want to learn.
I think that’s correct, they are trying to avoid the case of a STRONG retrace where it would swing back and easily hit any SL. You can enter the trade if you wish but I think their strategy of waiting will filter out a lot of false signal in the long run. Hope this helps.
Ichimoku trading strategy has everything you need to trade successfully. From identifying support and resistance levels to clearly identifying trends irrespective of the timeframe. I request you to send a PDF copy for detailed and internalization.
Great! We will considering making this into a PDF. Thanks!
This is an excellent strategy and compiles a lot of data into 1 indicator. That’s great! I have a question about buying. If the crossover of Conventional Line above the Base Line happens below the Ichimoku Cloud and price is still below the Ichimoku Cloud, when would you buy? Would you buy as soon as price breaks above the Ichimoku Cloud, so long as the Conventional Line stays above the Base Line? Thanks so much for the insight!
Hey! first off thanks for your kind words. It means alot to see that people like you are loving this content. You would buy when price has broke above, like you said.
Hi, Thanks a lot for this strategy. it’s very well explained but I have a small doubt about which timeframe data is best to use for this strategy like Seconds data or Hourly data or Daily data. I implementing this strategy on Hourly data but do I need to take seconds data for this Step #3 Buy after the crossover at the opening of the next candle.
This is best on the hourly in our testing.
I found the longer the timeframe the more accurate the entry. But if you are using the 1H timeframe and above, you will need a lot of patience and don’t enter trades blindly or rush into it. I personally use 15m and it works great also.
What do you use as your stop-loss for the lower time frame trades? (the guide emphasizes cloud breakout, but most intraday trades are already well above the cloud breakout). Thanks!
We recommend using the 1 hour strategy.
Find more best strategies here: https://tradingstrategyguides.com/best-trading-strategy/
Hey, i really appreciate everything you guys have done and all the time and effort you put in to helping us. I can’t say thank you enough for putting all of this together. My only question is, what currency pairs work best with this strategy?
Hi, thank you so much for your kindly explaination for this cloud strategy, I more understand it after I read your article than other’s article.
Please, I have a question, if we use this strategy on hourly data, should we wait for the same pattern occur on 4 hour data too in order to make an entry point? Or we just look for the entry point pattern at hourly data only?
Thank you for your explaination.
Best indicator of i have ever seen
GREAT! Breakdown of Basic Ichimoku Cloud readings.
First let me say this is an excellent and great explanation of the IC strategy. Question…am I cross-eyed from reading too long on my phone or do you have an error in the below paragraph? Shouldn’t the second sentence read…When leading A is above leading Span B…..?
Once Leading Span A and Leading Span B have been identified, the “cloud” component of this graph will be shaded in. When Leading Span B is above Leading Span A, this indicates to traders that price momentum is currently increasing. When this is the case, the graph will be shaded green.
If I am wrong I apologise for wasting your time. I am new to trading but trying to soak up as much information as I can.
I think you are right Earl. Confused me for a while!
Yaa confused me also a lot
VERY MUCH USEFUL AND NICE EXPLANATION OF THE STRATEGY. THANK YOU