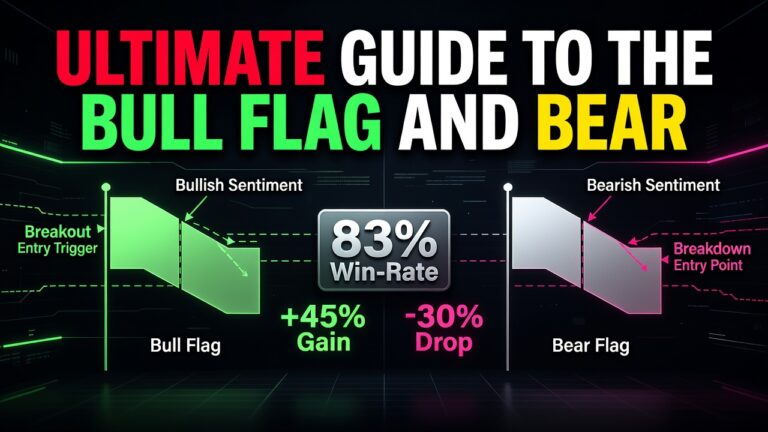
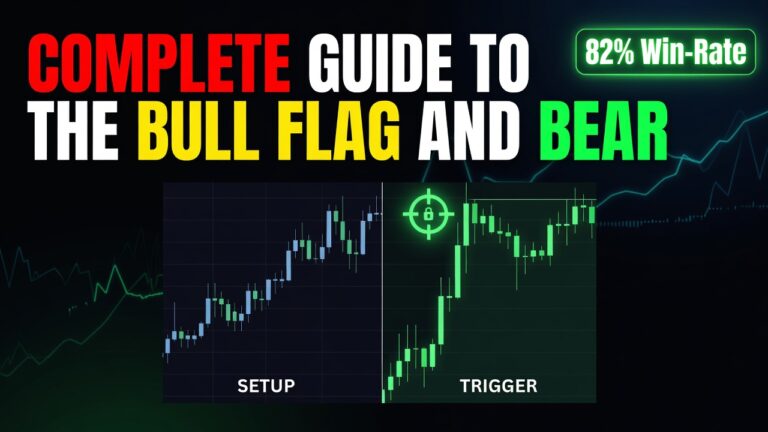
Ultimate Guide to the Bull Flag and Bear Flag Pattern Trading Guide

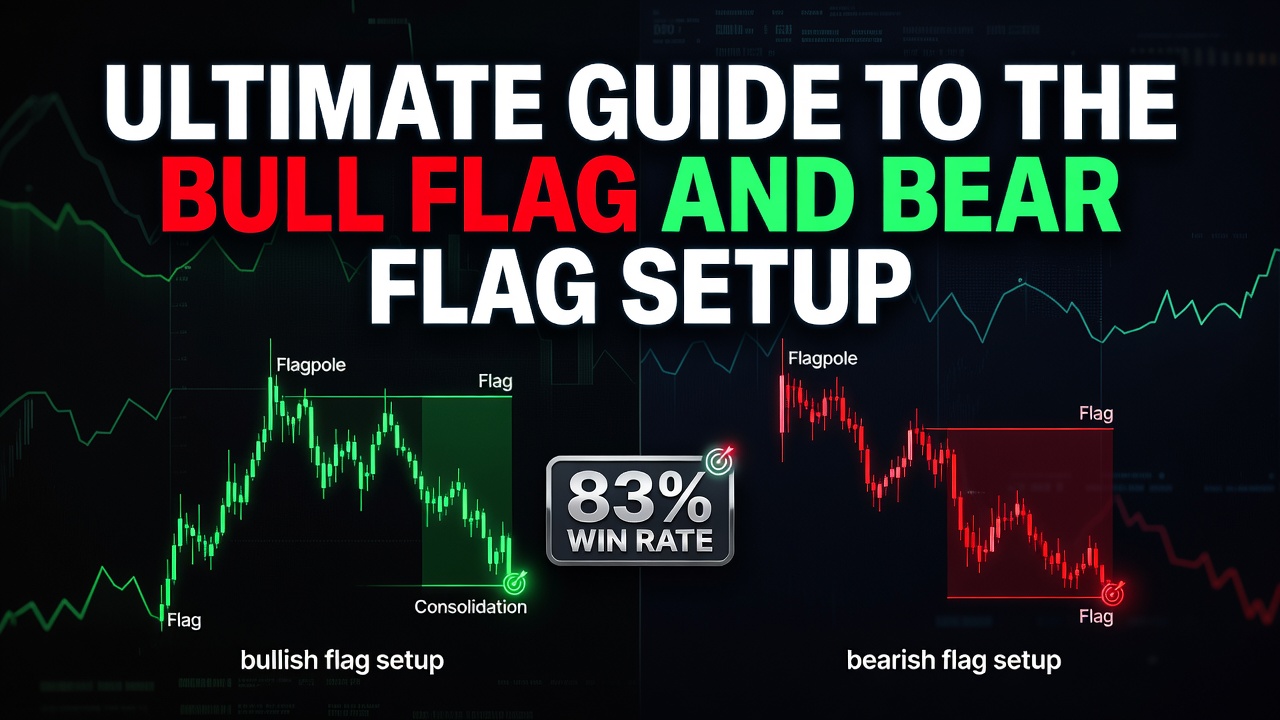
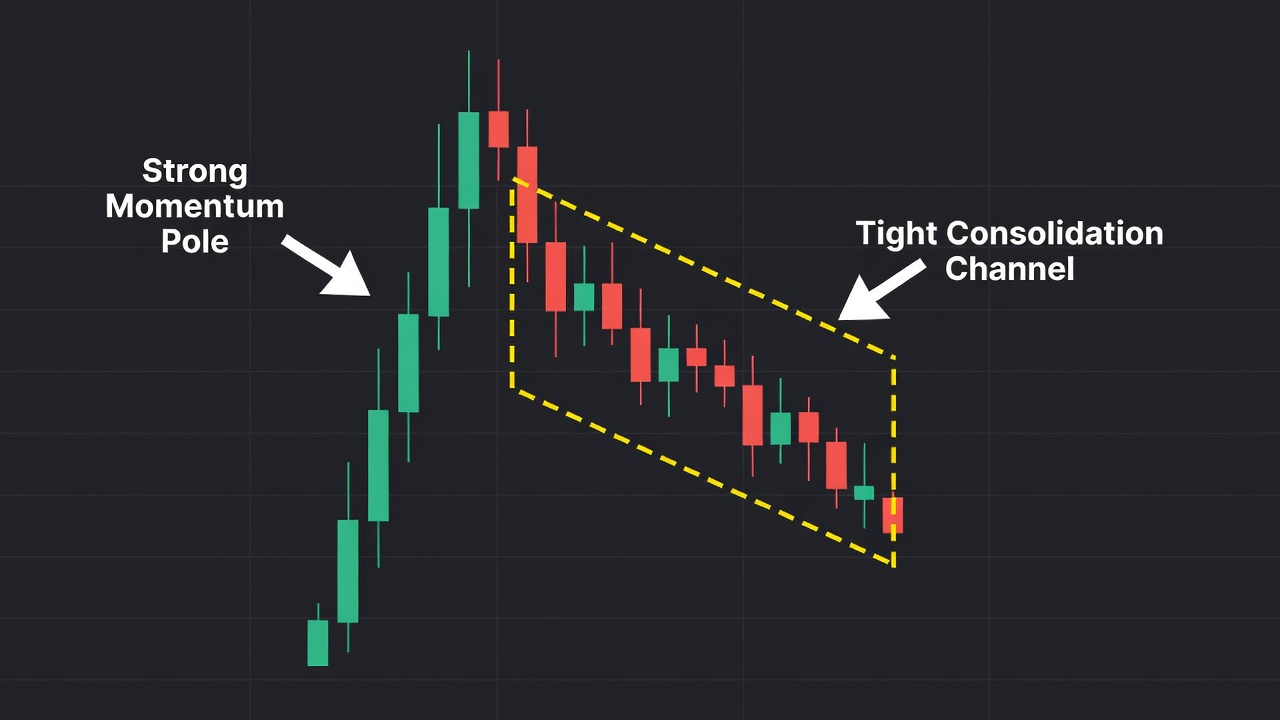
The bull flag and bear flag pattern is a high-probability technical continuation setup that signals a temporary pause and consolidation before the market resumes its dominant trend. This pattern consists of a sharp, vertical price movement known as the flagpole, followed by a tight, sloping consolidation channel known as the flag. Professional traders utilize this setup to find low-risk entry points in highly momentum-driven markets across all asset classes.
- The pattern consists of two distinct phases: a strong, high-volume impulse leg (the pole) and a tight, low-volume consolidation channel (the flag).
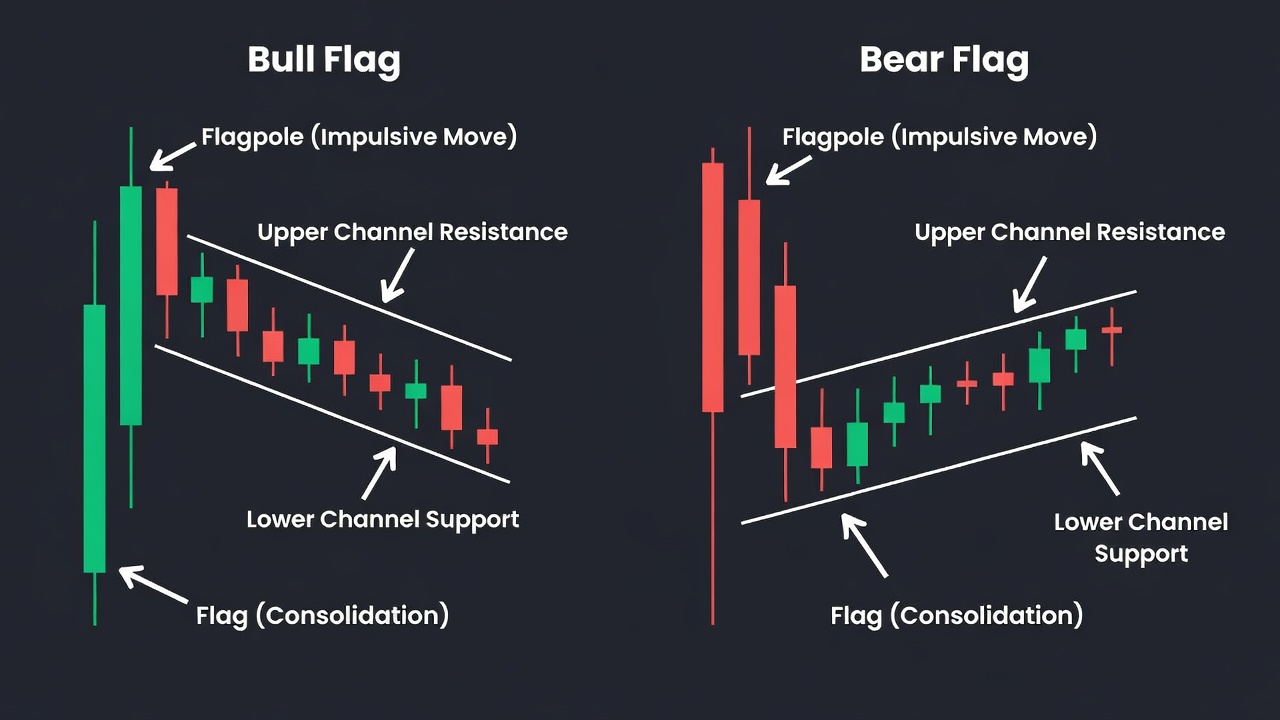
- A bullish flag slopes downward against the prior uptrend, while a bearish flag slopes upward against the prior downtrend.
- Entry triggers occur on a clean candle close outside the flag boundary, confirming that the dominant trend has resumed.
- Risk is strictly managed by placing stop losses just outside the opposite side of the flag consolidation structure.
- Profit targets are projected by measuring the height of the flagpole and projecting that distance from the breakout point.
What Is the Bull Flag and Bear Flag Pattern?
The bull flag and bear flag pattern represents a brief pause in a strong, trending market where prices consolidate within a narrow channel before continuing in the direction of the primary trend. This pattern was first popularized by early technical analysts who recognized that markets rarely move in straight lines and instead advance in alternating phases of expansion and contraction. The pattern appears in highly liquid markets during periods of strong institutional participation, serving as a visual representation of profit-taking by early buyers or sellers. As the counter-trend consolidation concludes, new market participants step in to drive prices further, making it one of the most reliable continuation structures in technical analysis.
The Market Psychology Behind the Flag Patterns
The visual structure of a flag pattern reveals a classic transfer of inventory from weak hands to strong institutional hands during a temporary market equilibrium. When a market experiences a sudden, violent surge in price, early buyers begin to take profits, creating minor counter-trend pressure. This profit-taking is not met with aggressive selling; instead, the pullback is orderly, tight, and characterized by declining trading volume. This low-volume pullback indicates that sellers lack the conviction to reverse the trend, and buyers are simply waiting for a better price to re-enter. Once the price reaches the outer boundary of the consolidation channel, limit orders from institutional buyers absorb the remaining sell orders, initiating a breakout that forces short-sellers to cover their positions, adding rapid fuel to the continuation move.
How to Identify the Bull Flag and Bear Flag Pattern on a Chart
Accurately identifying a valid flag pattern requires strict adherence to structural rules regarding the impulse leg, consolidation angle, and volume characteristics. Many traders mistake weak, drifting retracements for valid flag patterns, leading to premature entries and avoidable losses. You must look for distinct visual properties that separate high-probability setups from random market noise.
The Flagpole (Impulse Move)
The flagpole must be a rapid, nearly vertical price expansion consisting of large, full-bodied candlesticks with minimal wicks. This phase represents pure momentum where one side of the market completely dominates the other. If the initial move is sluggish, choppy, or filled with overlapping candles, a valid flagpole does not exist.
The Flag (Consolidation Channel)
The flag itself must form a tight, parallel channel that slopes directly against the direction of the initial flagpole. For a bull flag, the channel must slope downward; for a bear flag, it must slope upward. The consolidation should not retrace more than 50% of the flagpole’s height, with 38.2% or less being the ideal zone for the strongest continuation plays.
Volume Characteristics
Volume must confirm the structural shift, showing a massive spike during the flagpole formation followed by a steady, noticeable decline during the flag consolidation. A lack of volume during the pullback proves that the counter-trend move is not driven by aggressive market participants. When the breakout occurs, a fresh surge in volume should accompany the price expansion.
The Exact Flag Pattern Setup Criteria
To trade flag patterns profitably, you must establish a mechanical checklist that filters out low-quality and false breakouts. Every trade setup must meet the following five structural criteria before you risk capital:
- Established Trend: The market must be in a clearly defined uptrend (for bull flags) or downtrend (for bear flags) on the higher-timeframe charts.
- Impulsive Flagpole: The flagpole must consist of at least three consecutive, high-volume expansion candles.
- Maximum Retracement: The consolidation phase must not retrace more than 50% of the entire flagpole’s vertical height.
- Parallel Boundaries: The consolidation must be contained within two parallel support and resistance lines, rather than converging lines (which would form a pennant).
- Volume Decay: Trading volume must steadily decrease as the flag consolidation develops, indicating a drying up of selling or buying pressure.
How Do You Trade the Flag Pattern? (Entry, Stop Loss, Target)
Execution of the flag pattern requires precise entry triggers, conservative stop placement to avoid market noise, and objective target targets. Do not guess when the breakout will happen; wait for the market to prove its intentions on the chart.
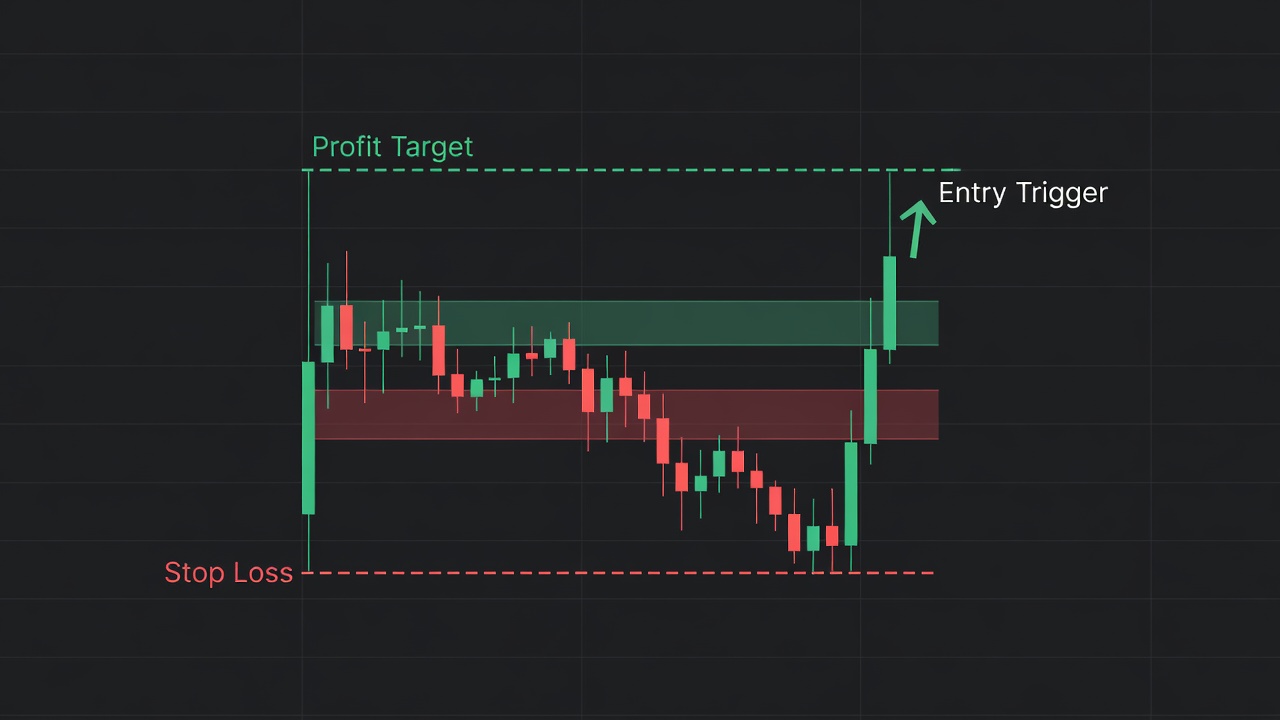
The standard entry trigger is a clean candle close outside the flag’s parallel boundary line. For a bull flag, buy immediately upon the close of the candlestick that breaks and closes above the upper descending resistance line. For a bear flag, sell short when a candlestick closes below the lower ascending support line. This entry method prevents you from getting caught in intraday wicks that fail to hold the breakout.
Your stop loss must be placed at an anchor point that invalidates the pattern if hit. The most reliable placement is 1 Average True Range (ATR) below the lowest point of the flag consolidation for a long setup, or 1 ATR above the highest point of the flag consolidation for a short setup. This buffer protects your position from minor stop-runs while keeping your risk tight. The average risk-to-reward ratio for this setup ranges between 1:2 and 1:3.
To determine your profit target, use the measured move method. Calculate the vertical distance of the flagpole from its initial trend start to its absolute peak. Project this exact vertical distance upward from the breakout point of the flag. This provides a highly objective mathematical target where momentum is statistically likely to exhaust itself.
Flag Pattern Trade Example: Step-by-Step
Let us examine a step-by-step hypothetical trade execution to illustrate how this pattern functions in a live environment. Suppose we are monitoring a major currency pair on the 1-hour timeframe. The market has been in a steady daily uptrend, and suddenly a massive influx of buying volume pushes the price from 1.1200 up to 1.1300 in a matter of four hours, forming a clean, vertical 100-pip flagpole.
Over the next twelve hours, the price begins to drift lower in an orderly fashion, forming a series of small, overlapping red and green candles. This consolidation slopes downward, touching a low of 1.1260 before stalling. This represents a shallow 40% retracement of the initial move, which aligns perfectly with our rules. Volume during this downward drift drops to less than half of the volume seen during the vertical climb.
As you can see in the annotated chart above, we wait for confirmation. A strong hourly candle suddenly surges on high volume, breaking through the upper resistance line of the flag and closing at 1.1280. This is our entry trigger. We immediately enter a long position at 1.1280. We place our stop loss 1 ATR below the consolidation low of 1.1260, placing our stop at 1.1245. This represents a total risk of 35 pips. We calculate our target by taking the 100-pip flagpole height and adding it to our entry/breakout point, giving us a hard profit target at 1.1380. The trade eventually rallies smoothly over the next 24 hours, hitting our target for a clean 100-pip gain, yielding a highly favorable 2.8:1 reward-to-risk ratio.
Flag Patterns Across Different Timeframes
While flag patterns appear on all charts, their reliability, average target distance, and noise levels change drastically between intraday and swing-trading timeframes. High-frequency timeframes like the 1-minute and 5-minute charts present numerous flag-like structures, but these are frequently corrupted by bid-ask spreads, order flow imbalances, and sudden news releases. False breakouts are incredibly common here, requiring tight risk management and quick execution.
The cleanest and most reliable flag patterns develop on the 4-hour, daily, and weekly charts. On these higher timeframes, the patterns take days or weeks to form, meaning they require a massive consensus of market participants to develop. This structural integrity leads to highly explosive, sustained breakouts with minimal false alarms. If you want to maximize your win rate, focus on trading flags that align with the daily and weekly trend direction.
Bull Flag vs. Pennant: Key Differences
Traders frequently confuse the parallel flag pattern with the converging pennant pattern, yet their structural geometry and trading implications differ significantly. Understanding these nuances prevents execution errors during live market conditions.
The Bull Flag
The bull flag is characterized by strictly parallel upper and lower boundary lines that slope downward against the primary trend. It represents an orderly profit-taking channel where the range remains constant from the beginning of the consolidation to the end. It typically indicates a more controlled, deliberate resting phase in the market.
The Pennant
The pennant consists of converging support and resistance lines that form a small, symmetrical triangle after a flagpole. The price action makes consecutive higher lows and lower highs, compressing volatility to an extreme point. Pennants typically resolve faster and more aggressively than flags because the contracting range forces a breakout much sooner.
Best Confluences to Stack With Flag Patterns
Stacking multiple technical filters with your flag setup dramatically increases your win rate and filters out low-probability trades. Never trade a flag in isolation; instead, look for these key technical intersections:
- 50-Period Exponential Moving Average (EMA): High-probability flags often find support directly at the 50 EMA during their consolidation phase before breaking out.
- Prior Support/Resistance Flip: A bull flag is exceptionally strong if the consolidation bottom rests directly on top of a major broken resistance level from a higher timeframe.
- Volume Climax at Breakout: A breakout candle accompanied by trading volume that is at least 1.5 times the 20-day average volume confirms institutional participation.
- VWAP (Volume Weighted Average Price): In intraday trading, a flag that consolidates right above the VWAP line often leads to highly explosive breakout moves.
Common Flag Pattern Mistakes to Avoid
Even when trading a highly reliable pattern, simple execution mistakes can quickly ruin your edge and drain your account balance. Avoid these common structural traps when trading flag patterns:
- Trading a Flag with a Sluggish Pole: If the flagpole consists of small, overlapping candles with deep pullbacks, it is not a high-momentum move and is prone to failure.
- Entering Before the Candle Closes: Buying as the price crosses the flag boundary rather than waiting for the candlestick close often results in getting caught in a wick reversal.
- Trading Flags That Retrace Too Deeply: If the flag consolidates past the 61.8% Fibonacci retracement level of the pole, the momentum is gone, and the trend has likely failed.
- Ignoring Higher-Timeframe Resistance: Buying a bull flag on a 15-minute chart right below a major daily resistance zone is a recipe for a massive bull trap.
- Chasing Overextended Breakouts: If the breakout candle is exceptionally large, entering at the close leaves your stop loss too far away, completely ruining your risk-to-reward ratio.
Flag Pattern Checklist
Run through this binary checklist before executing any flag trade to ensure total compliance with your trading plan:
- Is the higher-timeframe trend pointing in the direction of my trade? (Yes/No)
- Did the flagpole consist of clear, high-volume momentum candles? (Yes/No)
- Is the consolidation retracing less than 50% of the flagpole’s total height? (Yes/No)
- Are the consolidation boundaries clearly parallel rather than converging? (Yes/No)
- Has a candlestick successfully closed outside the flag boundary line? (Yes/No)
- Is my stop loss placed safely outside the flag structure with a 1 ATR buffer? (Yes/No)
- Does the potential measured move target offer at least a 1:2 risk-to-reward ratio? (Yes/No)
Frequently Asked Questions About Flag Patterns
How do you identify a false flag breakout?
A false breakout occurs when the price breaks outside the flag boundary on low volume and quickly reverses back inside the consolidation channel. To avoid this, always wait for the breakout candlestick to close completely outside the pattern rather than entering on an intraday touch. Additionally, confirm that the breakout is accompanied by a noticeable surge in volume.
What is the success rate of the bull flag pattern?
The success rate of a bull flag pattern typically ranges between 60% and 70% when traded in a strong, trending market with high volume. However, this win rate drops drastically if you trade flags in choppy, range-bound, or low-volume market conditions. Stacking structural confluences like key support levels and moving averages is essential to maintaining this high win rate.
Is a bull flag bullish or bearish?
A bull flag is a strictly bullish continuation pattern that signals further upward price expansion. It temporarily pauses an existing uptrend to shake out weak-handed sellers before buyers push the market to new highs. Conversely, the bear flag is its strictly bearish counterpart that signals further downward continuation.
Which timeframe is best for trading flag patterns?
The 4-hour and daily timeframes are the absolute best charts for trading flag patterns because they filter out intraday market noise and false breakouts. These higher-timeframe patterns are backed by massive institutional capital shifts, making their breakouts highly reliable and far easier to manage. While intraday flags exist, they require highly advanced execution skills and much tighter risk parameters.
🎯 Get High-Probability Trade Setups — Free
The Big Dipper Dashboard delivers curated trade ideas straight to your screen every morning. Know what to watch before the opening bell.

📈 Want More? Join Our Free Trading Community
- Trading Strategy Guides Telegram — daily strategy tips and market insights
- Find Better Trades Telegram — free trade signals delivered to your phone
- Find Better Trades on YouTube — live trade breakdowns and tutorials