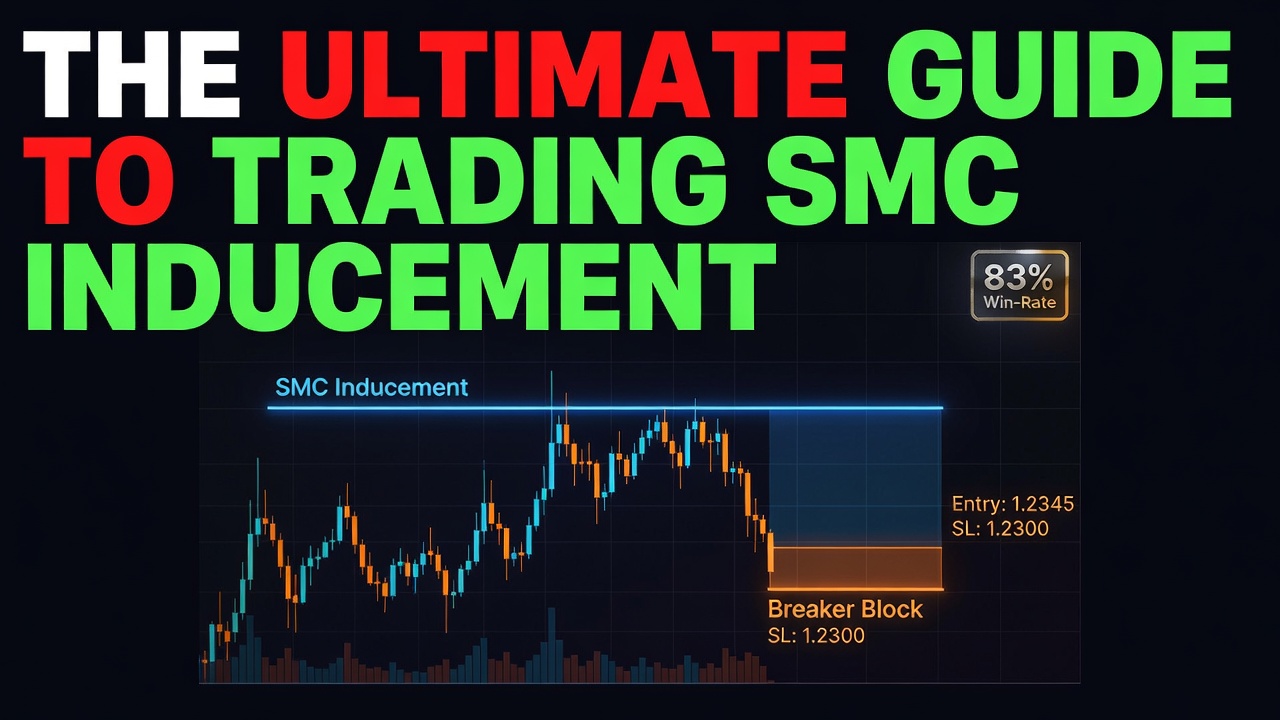
The Ultimate Guide to Trading SMC Inducement and Breaker Blocks

High-volatility environments like geopolitical clashes in the Gulf produce massive intraday price swings in Crude Oil futures. Standard retail support and resistance levels get routinely blown out because commercial algorithms seek deep liquidity pools before driving price in the true intended direction. The SMC Inducement and Breaker Block strategy is designed to exploit these exact institutional liquidity raids. By identifying where retail stop-losses are clustered (the inducement) and waiting for a structural failure to convert an order block into a breaker, you align your execution directly with market makers. This strategy is built for active futures and forex traders who want to stop being the liquidity and start trading alongside it.
What Is SMC Inducement and Breaker Blocks?
SMC Inducement (IDM) is a targeted trap where market makers encourage retail traders to buy or sell early, creating a pool of stop losses right before a major reversal. A Breaker Block is a failed order block that has been impulsively broken by a aggressive market move, reversing its role from support to resistance (or vice versa). This strategy was refined by the Inner Circle Trader (ICT) and broader Smart Money Concepts (SMC) communities to trade high-volume liquidity sweeps with extreme precision.
Why This Edge Works
Markets cannot move without liquidity, and liquidity exists in the form of stop-loss orders. Retail traders are taught to place their stops just below minor swing lows or above minor swing highs. Institutions require massive volume to fill their large positions without causing slippage, so they deliberately push price past these structural points to trigger those stops. Once these stops are swept, the aggressive institutional capital reverses the market. By waiting for this sweep (the inducement) to occur and then trading the retest of the broken order block (the breaker), you enter the market at the exact moment the retail crowd has been forced out and the real trend is ready to accelerate.
The Setup Rules
To identify and execute this strategy, you must strictly follow these structural steps:
- Identify the Higher Timeframe Trend: Determine the overall market direction on the 1-hour or 4-hour chart. Only trade setups aligned with this institutional flow.
- Locate the Inducement (IDM): On your execution timeframe (typically 5-minute or 15-minute), locate the most recent minor swing high (in a downtrend) or minor swing low (in an uptrend) that retail traders are treating as key support/resistance.
- Wait for the Sweep: Price must aggressively sweep past this inducement level, trapping breakout traders and triggering stop losses of early trend-followers.
- Look for the Market Structure Shift (MSS): Following the sweep, price must violently reverse and close past the key swing high or low that formed the previous order block.
- Identify the Breaker Block: Locate the specific candle that initiated the failed move. In a bullish reversal, this is the last up-close candle before the sweep that got broken to the upside. In a bearish reversal, it is the last down-close candle before the sweep that got broken to the downside.
Entry Trigger
Your entry is triggered when price pulls back to mitigate the newly formed Breaker Block zone. Enter a limit order at the leading edge of the Breaker Block candle body. Alternatively, enter a market order immediately when a lower-timeframe candle touches the Breaker Block zone and shows immediate rejection via a wick.
Stop Loss & Profit Target
The stop loss must be placed immediately past the swing high or swing low formed by the liquidity sweep. If buying a bullish breaker, place the stop 2 to 3 ticks below the lowest point of the sweep. Set your primary profit target at the next major opposing liquidity pool, which is usually the high or low of the higher-timeframe structure. This setup consistently yields a minimum risk-to-reward ratio of 1:2.5, often reaching 1:4 or higher during high-volatility sessions.
Trade Walkthrough: What It Looks Like on a Chart
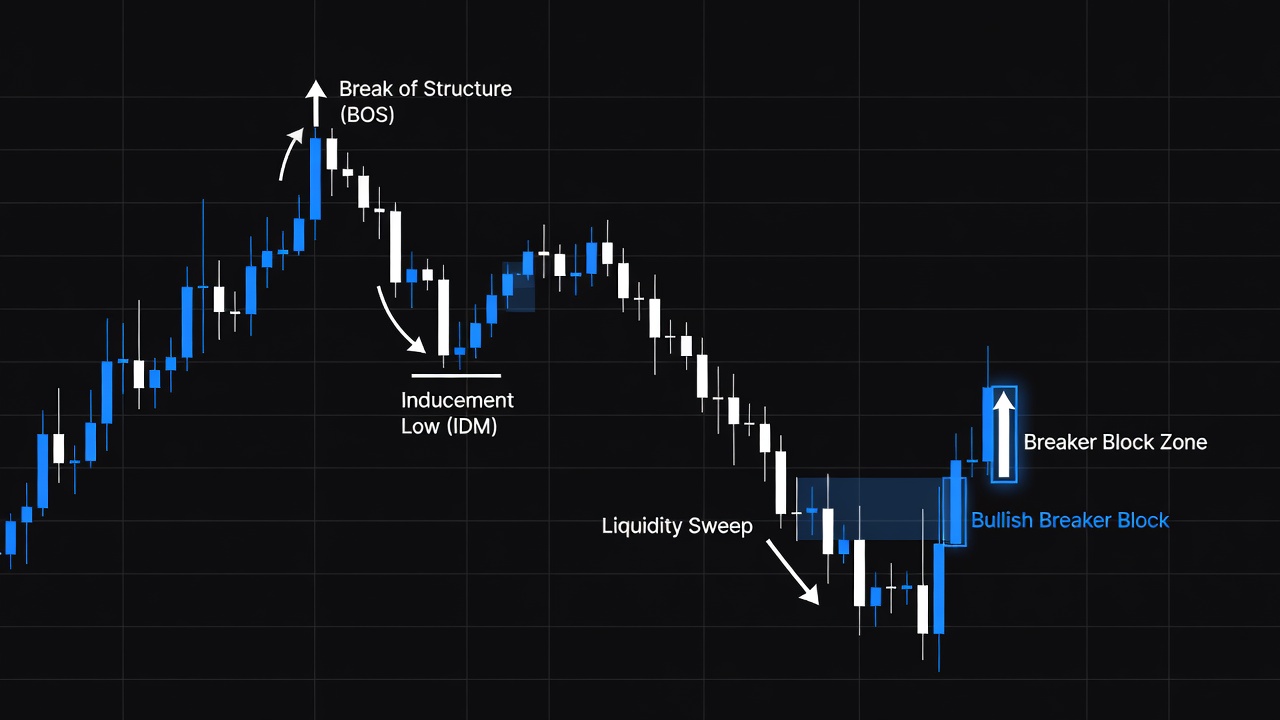
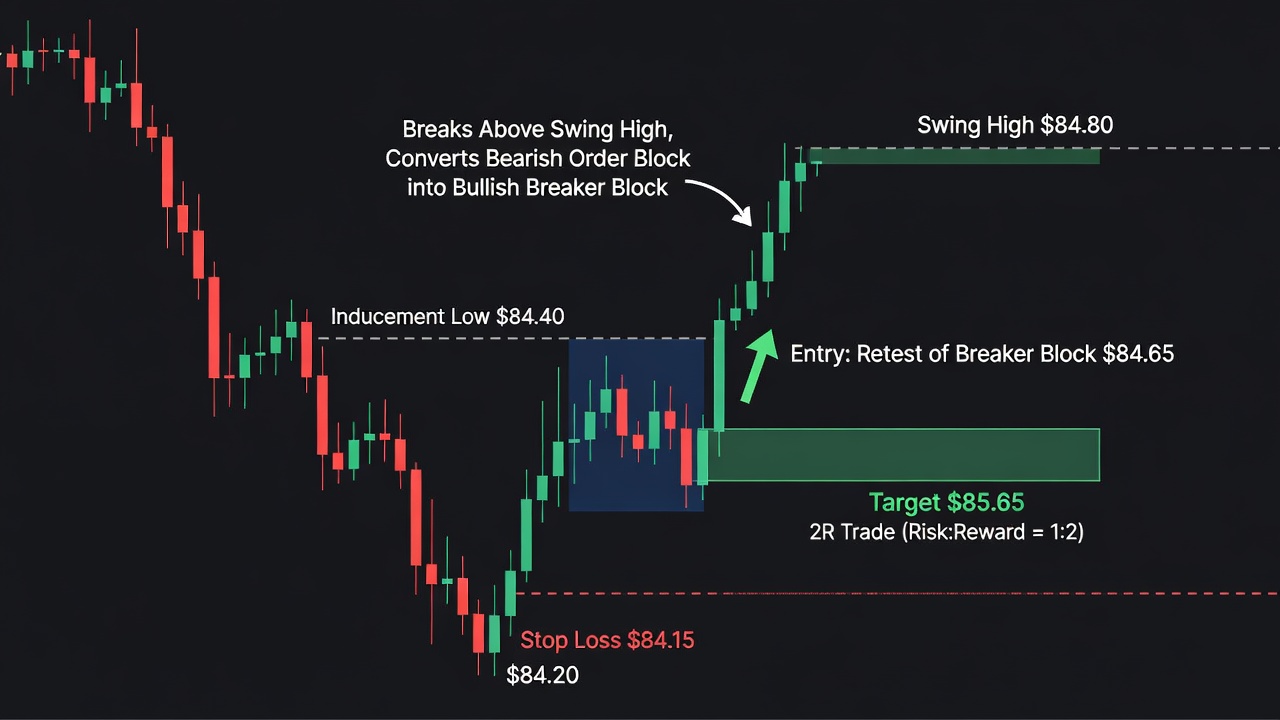
As you can see in the chart above, let’s look at a real-world intraday scenario in Crude Oil Futures (CL) on the 5-minute chart during a highly volatile London session. Crude oil had been pushing higher, but left a clear structural swing low at $84.40, which retail traders locked in as minor support. This level became our Inducement (IDM) level. The market makers then pushed price rapidly downward, sweeping below $84.40 and reaching a low of $84.20. This move triggered the sell stops of long traders and enticed breakout sellers to enter short.
Almost instantly, heavy institutional buying entered the market. Price violently reversed, tearing back upward and closing above the bearish order block high at $84.80. This aggressive close converted that bearish order block into a bullish Breaker Block. We placed our buy limit order at the top of this breaker zone at $84.65. Price pulled back sharply, touched our level perfectly to mitigate the block, and then launched upward toward the next major pool of liquidity at the $85.65 swing high. This trade risked 50 ticks to capture 100 ticks, delivering a clean 2R return.
Common Mistakes to Avoid
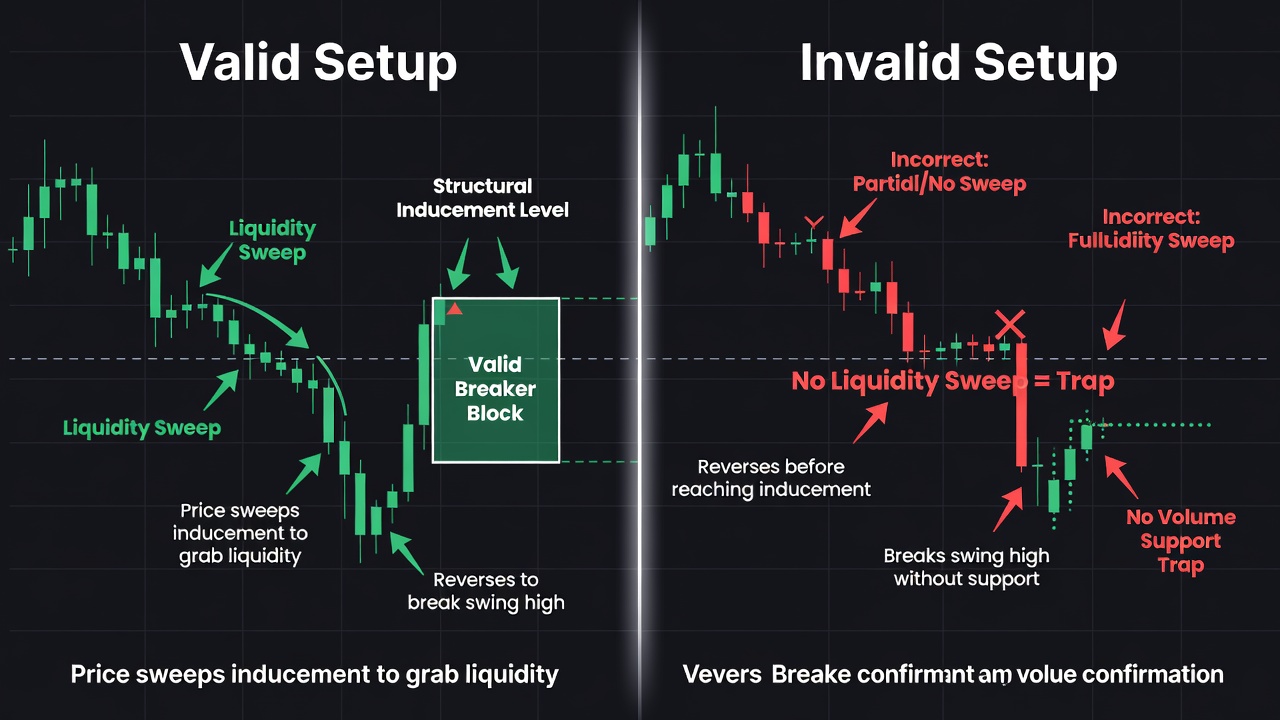
- Trading Minor Pullbacks as Sweeps: Do not mistake a simple price pause for a liquidity sweep. The inducement must show a clear, aggressive wick penetration of a prior swing level.
- Entering Without a Clear Breaker: Never enter a trade simply because price swept liquidity. You must wait for the structural shift to form a valid Breaker Block to confirm the market makers have actually reversed their bias.
- Ignoring High-Impact News: While this strategy thrives on volatility, entering immediately before major macroeconomic reports like inventory data can lead to extreme slippage that bypasses your stop loss.
- Chasing the Move: If price mitigates the breaker block and explodes upward before you get filled, let the trade go. Chasing the entry destroys your risk-to-reward ratio.
Quick Reference Checklist
- Is the overall higher-timeframe market structure clearly defined? (Yes/No)
- Has a clear retail support or resistance level (Inducement) been identified? (Yes/No)
- Did price aggressively sweep past that inducement level to grab liquidity? (Yes/No)
- Has a market structure shift occurred, creating a valid Breaker Block? (Yes/No)
- Is your stop loss positioned safely beyond the extreme of the sweep candle? (Yes/No)
- Does the distance to your profit target offer at least a 1:2 risk-to-reward ratio? (Yes/No)
coins.
his.
print>
🎯 Get High-Probability Trade Setups — Free
The Big Dipper Dashboard delivers curated trade ideas straight to your screen every morning. Know what to watch before the opening bell.

📈 Want More? Join Our Free Trading Community
- Trading Strategy Guides Telegram — daily strategy tips and market insights
- Find Better Trades Telegram — free trade signals delivered to your phone
- Find Better Trades on YouTube — live trade breakdowns and tutorials