Ultimate Guide to Trading SMC Order Blocks and Inducement in Meta Stock

When Meta Platforms (META) drives higher on massive institutional volume sparked by agentic AI developments, chasing the breakout is a fast track to getting stopped out. Retail breakout traders buy the top of the range, only for algorithmic market makers to drive price backward, flush out early long positions, and collect liquidity at discount prices. The key to capturing these massive institutional trends is waiting for a structural hunt. The SMC Order Blocks and Inducement strategy lets you pinpoint exactly where institutional algorithms will stop pushing the market down and resume the primary AI-fueled rally, giving you low-risk entries with tight, highly defined risk parameters.
What Is SMC Order Blocks and Inducement?
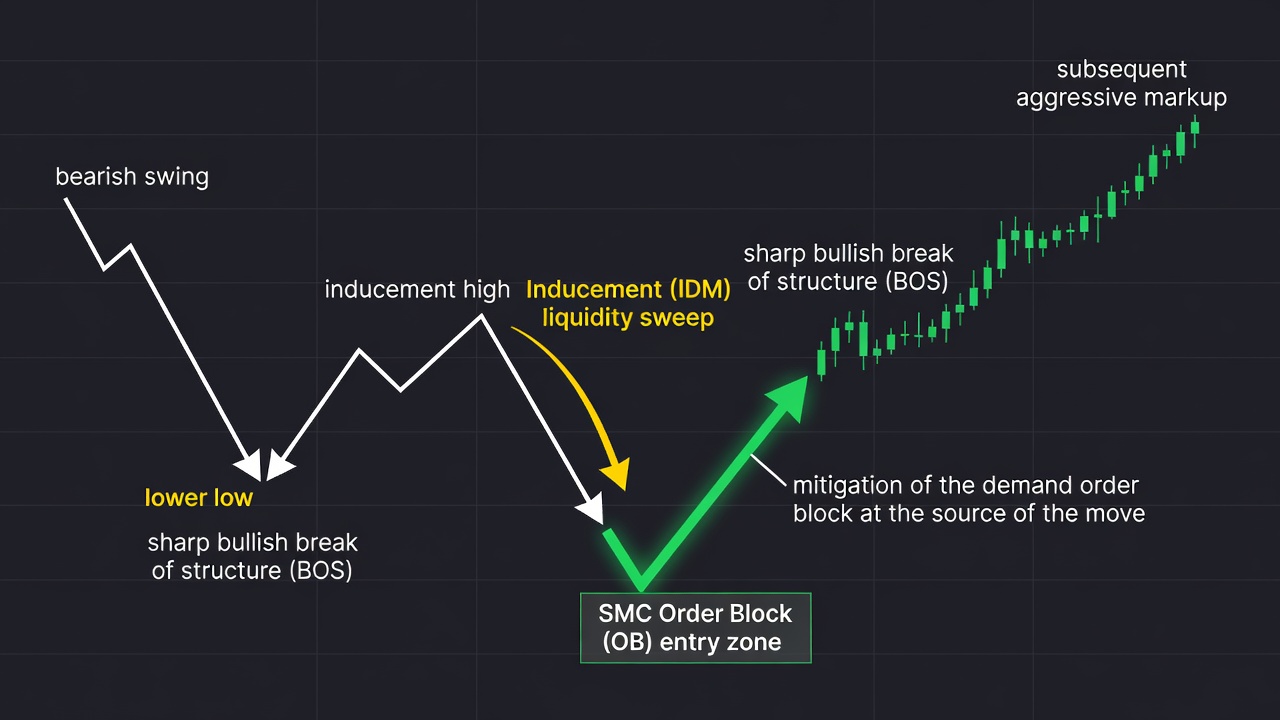
SMC Order Blocks and Inducement is a professional trading strategy rooted in Smart Money Concepts that identifies where major institutions place large buy or sell blocks. An order block is the specific candle that initiated a sharp, aggressive market move which broke market structure. Inducement is a targeted liquidity sweep of short-term swing points designed to trap retail traders into taking positions too early before the true institutional move occurs.
Why This Edge Works
Markets do not move smoothly; they move by hunting liquidity. Institutional orders are so massive that market makers cannot simply buy millions of shares of META at the current ask price without driving the price against themselves. To fill their massive buy orders, they need sell-side liquidity. They generate this liquidity by driving the price below a visible short-term swing low, inducing retail traders to trigger their stop-loss sell orders or open speculative short positions. Once this pool of sell orders is activated, the institutional algorithms absorb them within an unmitigated order block and rapidly reverse the market direction.
The Setup Rules
To identify and execute this high-probability setup, you must follow these strict structural rules during high-volume trading sessions:
- Timeframe Alignment: Identify the major market trend on the 1-hour or 4-hour chart, then execute your entries on the 5-minute or 15-minute chart during the US market session.
- Break of Structure (BOS): Look for an aggressive bullish move that closes above the previous structural swing high, creating a clear Break of Structure to confirm institutional buying presence.
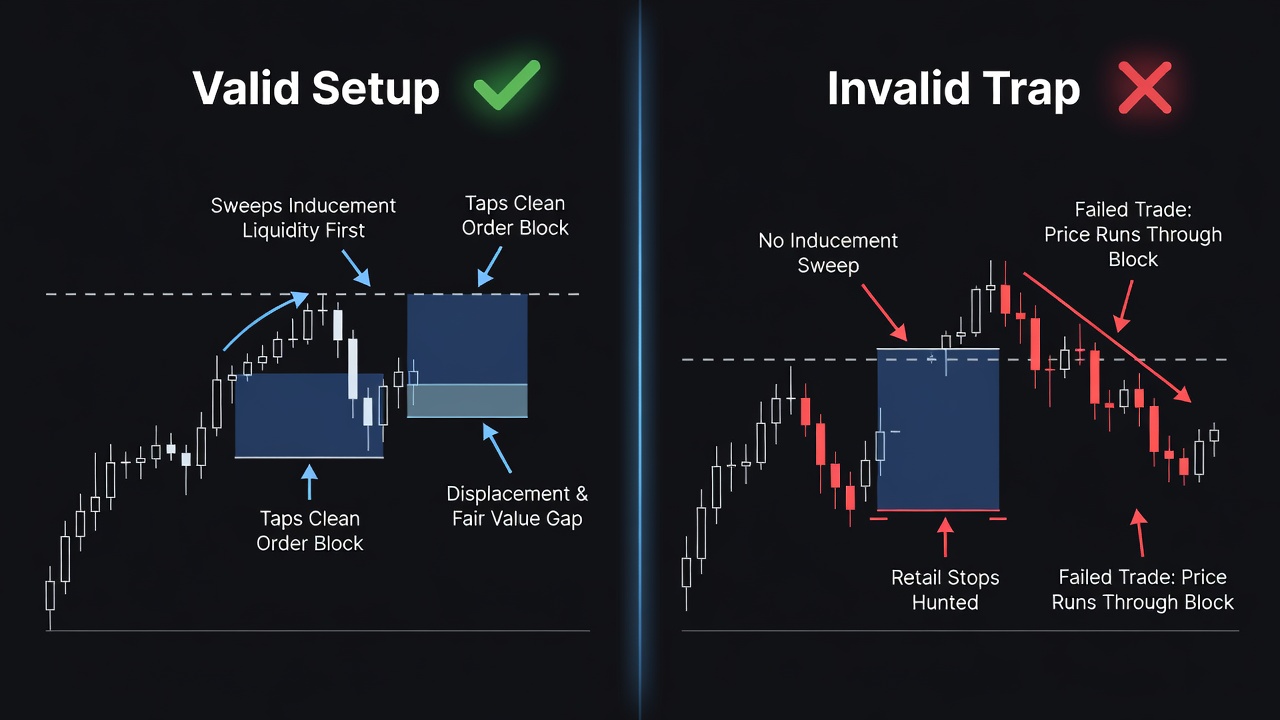
- Identify the Unmitigated Order Block: Locate the last down-close candle (or group of candles) before the rapid upward expansion. This block must have a Fair Value Gaps (FVG) immediately above it, proving there was strong buy-side displacement.
- Locate the Inducement (IDM): Identify the first minor pullback swing low formed after the BOS occurred. This is the bait. Do not place an order at this level; this is the liquidity trap that must be swept.
Entry Trigger
Your entry is triggered when price aggressively sweeps below the designated Inducement swing low and taps into the open of the unmitigated 15-minute bullish order block. You must wait for the candle body on your execution timeframe to touch the top 50% threshold of the order block zone without closing completely below it.
Stop Loss & Profit Target
The stop loss must be placed exactly 0.50 points below the absolute low of the physical order block candle; if price closes below this level, the institutional setup is invalidated. Your profit target is set at the recent major swing high that initiated the pullback, which typically yields a minimum risk-to-reward ratio of 3:1. You can also scale out of 50% of your position at this target and let the remaining half run for a macro-trend extension.
Trade Walkthrough: What It Looks Like on a Chart
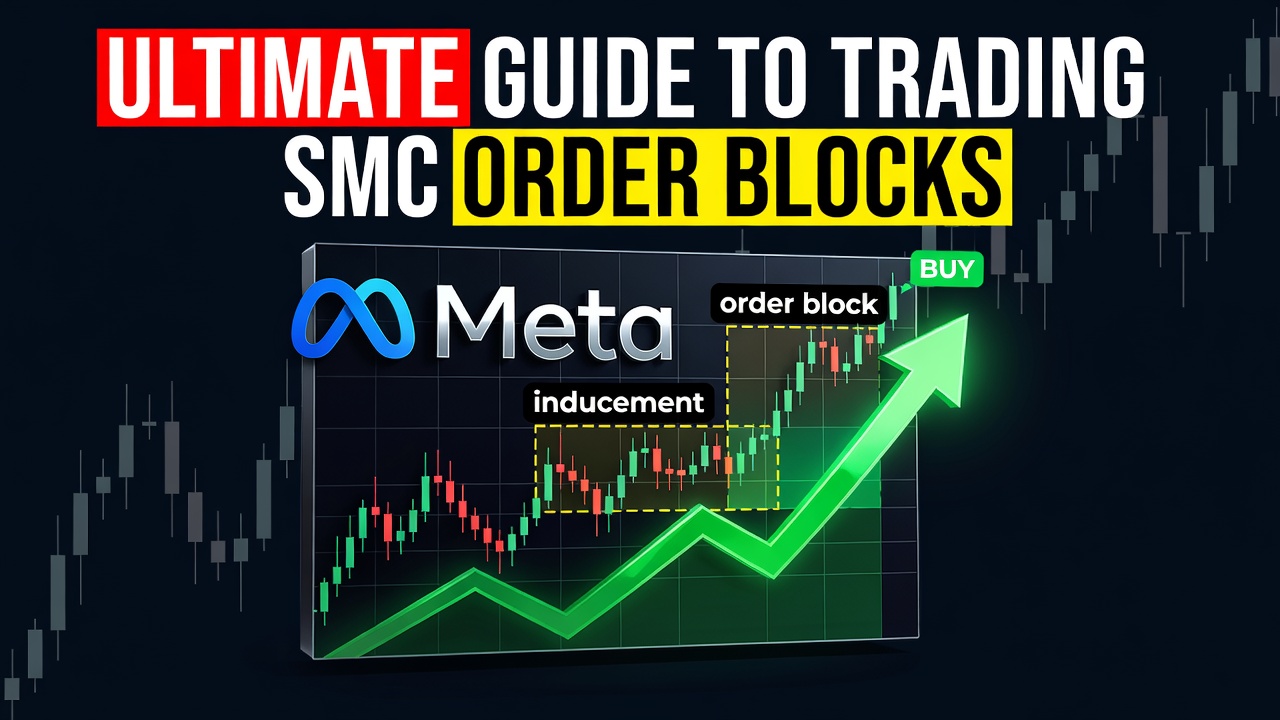
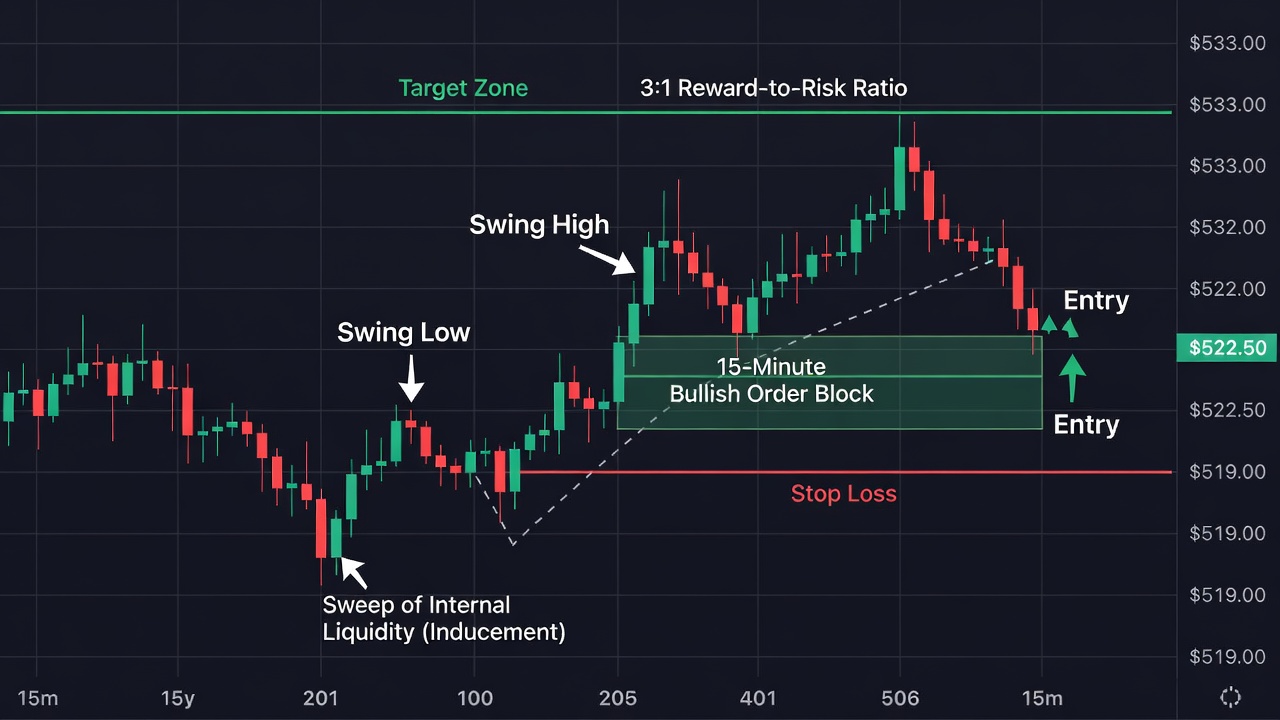
Let us look at a highly specific long setup on META during an aggressive expansion phase fueled by positive agentic AI catalysts. META had established a clean uptrend on the daily chart, breaking past local resistance. Dropping down to the 15-minute chart, we observed an aggressive market structure shift that left a clear bullish order block starting at $519.00 up to $522.50. After hitting a high of $533.00, price began a slow, corrective decline, forming a retail-visible swing low at $524.50. This low was our identified Inducement level.
As you can see in the chart above, retail buyers rushed to buy the bounce off the $524.50 level. A few hours later, the algorithms drove the market down, sweeping straight through that minor support to trigger stop-loss orders and trap breakout sellers. The price plunged directly into our $522.50 buy zone, tapping the unmitigated 15-minute order block. We executed our long position at $522.50, placing our stop loss at $518.50, just below the structural low. Within three hours, the selling pressure was completely absorbed, and the price rallied back to our primary target of $533.00, securing a highly profitable 2.6R trade before the market close.
Common Mistakes to Avoid
- Buying the Inducement Support: Do not buy the first support level that forms during a pullback; this is a liquidity pool engineered by algorithms to be swept.
- Ignoring Volume and Session Timing: Avoid trading this setup during low-volume lunchtime hours or late afternoon sessions; focus exclusively on the high-liquidity morning window.
- Mitigated Order Blocks: Never use an order block that has already been tested by a previous shadow or candle body; only fresh, untouched order blocks hold institutional buying power.
- Trading Against the Higher Timeframe Trend: Do not attempt to catch counter-trend short entries using this setup when META is in a roaring daily uptrend driven by fundamental AI tailwinds.
Quick Reference Checklist
- Is the higher timeframe (1H or 4H) market structure clearly bullish? (Yes/No)
- Did price create a clear Break of Structure (BOS) with an aggressive, full-bodied candle close? (Yes/No)
- Is there an unmitigated bullish order block with a clear Fair Value Gap (FVG) above it? (Yes/No)
- Has price swept below the first minor swing low (Inducement) before reaching your order block? (Yes/No)
- Is your stop loss set safely below the absolute low of the order block? (Yes/No)
🎯 Get High-Probability Trade Setups — Free
The Big Dipper Dashboard delivers curated trade ideas straight to your screen every morning. Know what to watch before the opening bell.

📈 Want More? Join Our Free Trading Community
- Trading Strategy Guides Telegram — daily strategy tips and market insights
- Find Better Trades Telegram — free trade signals delivered to your phone
- Find Better Trades on YouTube — live trade breakdowns and tutorials