The Complete Guide to Trading Semiconductor Pullbacks with ICT OTE


When artificial intelligence tailwinds push semiconductor stocks into parabolic momentum, chasing the high is a quick way to get stopped out on normal market noise. The ICT Optimal Trade Entry (OTE) strategy solves this by mapping institutional footprints during retracements, letting you buy high-beta semi stocks exactly when the discount is deepest and the risk-to-reward ratio is skewed heavily in your favor. This strategy is built for swing traders and active intraday traders who want to ride massive AI-driven trends without FOMOing into overextended tops.
What Is ICT Optimal Trade Entry?
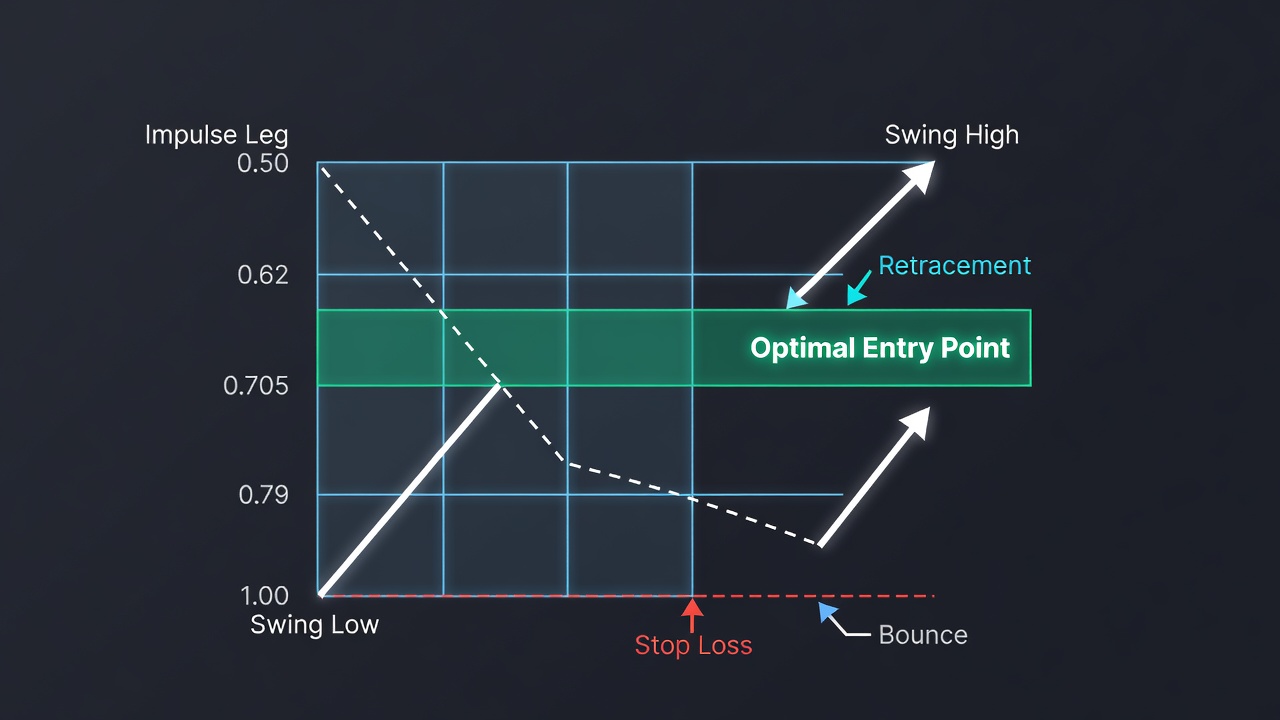
Optimal Trade Entry (OTE) is a signature Fibonacci retracement pattern developed by Michael J. Huddleston, the founder of the Inner Circle Trader (ICT) methodology. It defines a precise sweet spot within a primary market expansion leg where institutions typically accumulate or distribute positions. Unlike retail traders who buy blindly at the 50% retracement, the OTE model specifically targets the high-probability discount zone between the 62% and 79% retracement levels, with the 70.5% level acting as the sweet spot axis.
Why This Edge Works
The edge of the OTE model relies on understanding market liquidity and institutional order flow. When a stock like NVIDIA, AMD, or Broadcom experiences an AI-fueled rally, market makers create displacement by aggressively driving prices higher to clear out buy-side liquidity. This aggressive move leaves behind a trail of unfilled institutional orders and structural imbalances. Once retail buyers exhaust their capital at the top, algorithms drive the price back down to hunt sell-side liquidity and mitigate those unfilled orders. By entering in the 62% to 79% zone, you are buying at a steep wholesale discount alongside institutional algorithms that are re-accumulating shares before driving the next expansion leg higher.
The Setup Rules
To identify a high-probability semiconductor pullback using ICT OTE, you must strictly follow these structural steps:
- Identify the Trend and Catalyst: Locate a high-volume, AI-driven semiconductor stock that is in a clear daily and weekly uptrend.
- Wait for a Market Structure Shift (MSS): On your execution timeframe (typically the 1-Hour or 15-Minute chart), look for a violent upward displacement that breaks through a previous swing high, leaving a clear Market Structure Shift.
- Define the Impulse Leg: Draw your Fibonacci retracement tool from the absolute Swing Low of that displacement move to the absolute Swing High. This entire move must be clean, fast, and driven by high volume.
- Identify Confluence Arrays: Look inside the OTE zone (the 62% to 79% retracement area) for a Fair Value Gaps (FVG) or a bullish Order Block. If one exists within this window, the setup is highly validated.
- Wait for Retracement: Let the price decay slowly back down into the OTE zone without chasing. The retracement should ideally look corrective and low-volume compared to the initial impulse leg.
Entry Trigger
Your entry executes when price enters the OTE zone. You have two options for execution: you can set a limit order directly at the 70.5% Fibonacci retracement level for passive execution, or you can watch the 1-minute or 5-minute chart for a smaller-timeframe Market Structure Shift (a structural bounce) inside the OTE zone to execute a market buy order.
Stop Loss & Profit Target
Risk management is mechanical with the OTE model, eliminating guesswork from your trade setup:
- Stop Loss Placement: Place your stop loss strictly below the Swing Low of the impulse leg (the 100% Fibonacci retracement level), plus a small buffer of 5 to 10 cents to account for spread and market noise.
- Profit Target 1: Set your first take-profit target at the Swing High of the impulse leg (the 0.00% Fibonacci level) to lock in gains and make the trade risk-free.
- Profit Target 2: Set your ultimate target at the -0.272 Fibonacci extension level.
- Profit Target 3 (Optional): For high-momentum runners, target the -0.62 Fibonacci extension level.
- Risk/Reward Ratio: This mechanical placement consistently yields a minimum risk-to-reward ratio of 1:3, and frequently reaches up to 1:5 on clean trend continuations.
Trade Walkthrough: What It Looks Like on a Chart
Let’s break down a real-world trading scenario using NVIDIA (NVDA) on the 1-hour timeframe during an AI-driven earnings run. As you can see in the chart above, NVDA established a clear swing low at $820 and aggressively surged to a swing high of $950, creating a massive displacement leg that broke previous structural highs. This aggressive move shifted the market structure to bullish and left a noticeable Fair Value Gap just below the $870 level.
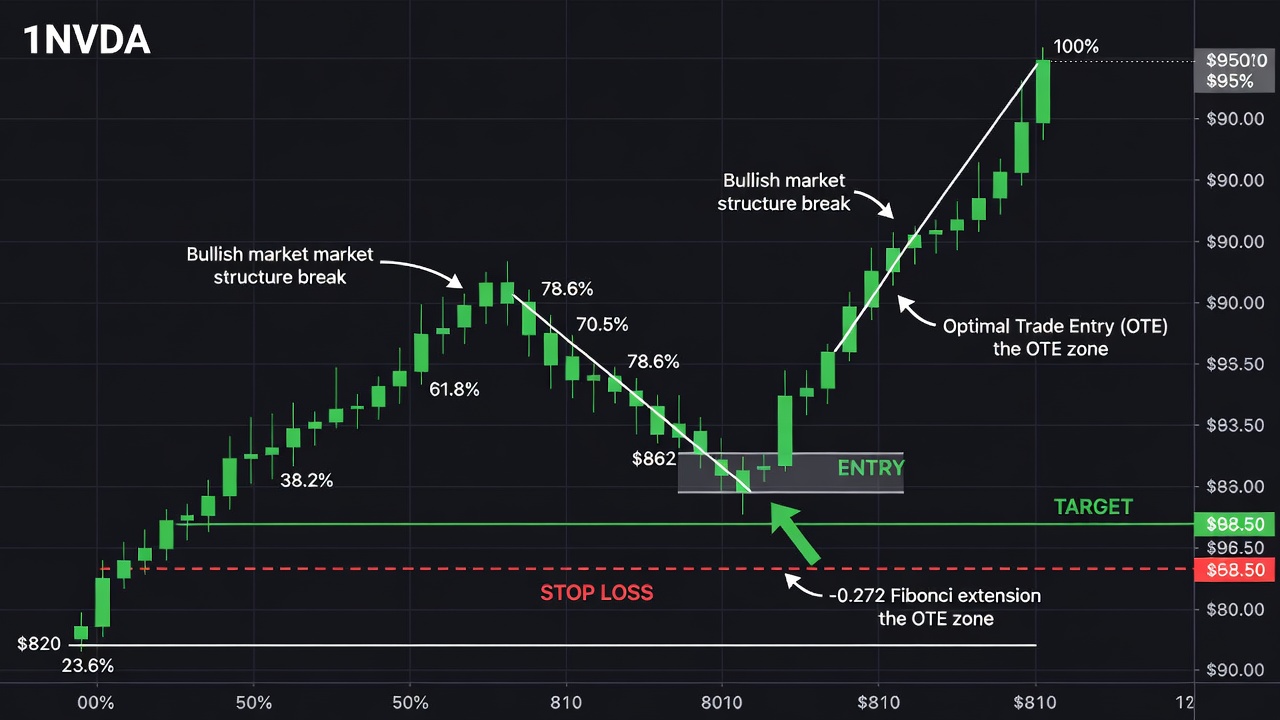
Once the swing high at $950 was established, the stock began a slow, corrective pullback. We anchor our Fibonacci retracement tool at the $820 swing low and drag it to the $950 swing high. This defines our OTE zone between the 62% retracement ($869.40) and the 79% retracement ($847.30), with our sweet spot 70.5% level sitting at $858.50. The price drifted down, tapping exactly into the 70.5% level at $858.50, which perfectly aligned with the daily bullish order block. A limit order entry was executed at this exact sweet spot. The stop loss was placed at $810, just below the $820 swing low. The stock consolidated briefly before reversing violently upward, easily hitting Target 1 at the $950 swing high and eventually running to our final profit target at the -0.272 extension level of $985, securing a highly profitable 1:3.6 R trade.
Common Mistakes to Avoid
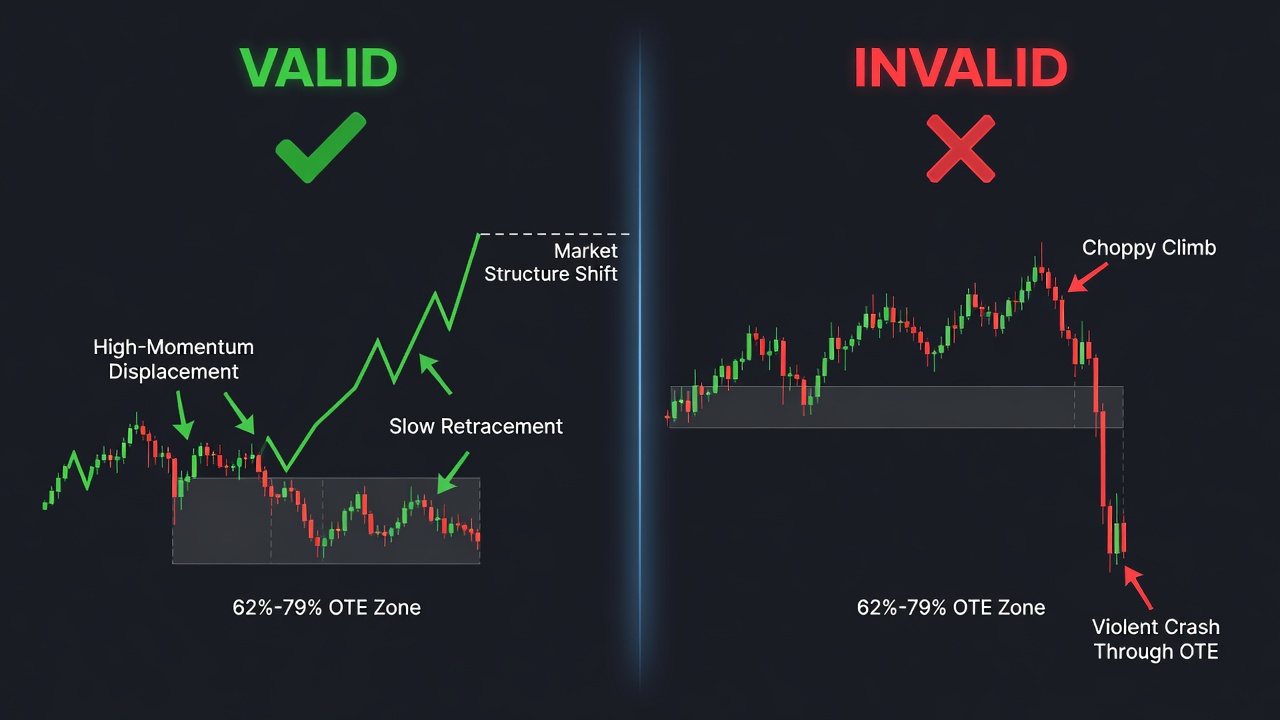
- Applying the Tool to Weak Legs: Do not use OTE on choppy, overlapping price action. If the impulse leg did not aggressively break market structure with displacement, the retracement is likely to collapse straight through your levels.
- Catching a Falling Knife: Avoid entering when the pullback to the OTE zone is incredibly violent and high-volume, as this usually indicates a fundamental trend shift rather than a healthy institutional correction.
- Ignoring Overall Market Context: Do not trade long OTE setups on individual semiconductor stocks if the broader sector (SMH) or the Nasdaq (QQQ) is breaking down below major daily support levels.
- Moving Stops to Breakeven Too Quickly: Give the trade room to breathe; moving your stop loss to your entry point before price has broken past the 50% retracement level often results in getting prematurely stopped out on a normal retest.
Quick Reference Checklist
Verify these six structural alignment points before placing any capital at risk on this setup:
- Is the semiconductor sector (SMH/SOXX) currently in an established daily and weekly uptrend? [Yes/No]
- Did the impulse leg create a clear Market Structure Shift (MSS) by breaking a recent swing high? [Yes/No]
- Is there a high-volume displacement leg visible on the 15-minute, 1-hour, or 4-hour chart? [Yes/No]
- Does the OTE zone (62% – 79%) align with a Fair Value Gap or an Order Block on your chart? [Yes/No]
- Is your stop loss positioned safely below the absolute Swing Low of the displacement leg? [Yes/No]
- Does the potential profit target at the -0.272 extension offer at least a 1:3 risk-to-reward ratio? [Yes/No]
🎯 Get High-Probability Trade Setups — Free
The Big Dipper Dashboard delivers curated trade ideas straight to your screen every morning. Know what to watch before the opening bell.

📈 Want More? Join Our Free Trading Community
- Trading Strategy Guides Telegram — daily strategy tips and market insights
- Find Better Trades Telegram — free trade signals delivered to your phone
- Find Better Trades on YouTube — live trade breakdowns and tutorials