Ultimate Guide to the Inside Bar Breakout Strategy


The inside bar breakout strategy is a high-probability price action trading methodology that capitalizes on periods of market consolidation to capture explosive momentum expansion. This strategy relies on identifying a specific two-candle pattern where the second candle is completely contained within the high and low range of the preceding candle, signaling a temporary pause in price movement. It serves as an essential tool for trend-continuation and reversal traders who want to enter high-risk-to-reward trades with clearly defined exit parameters.
- An inside bar represents a period of market consolidation where volatility shrinks before a powerful breakout occurs.
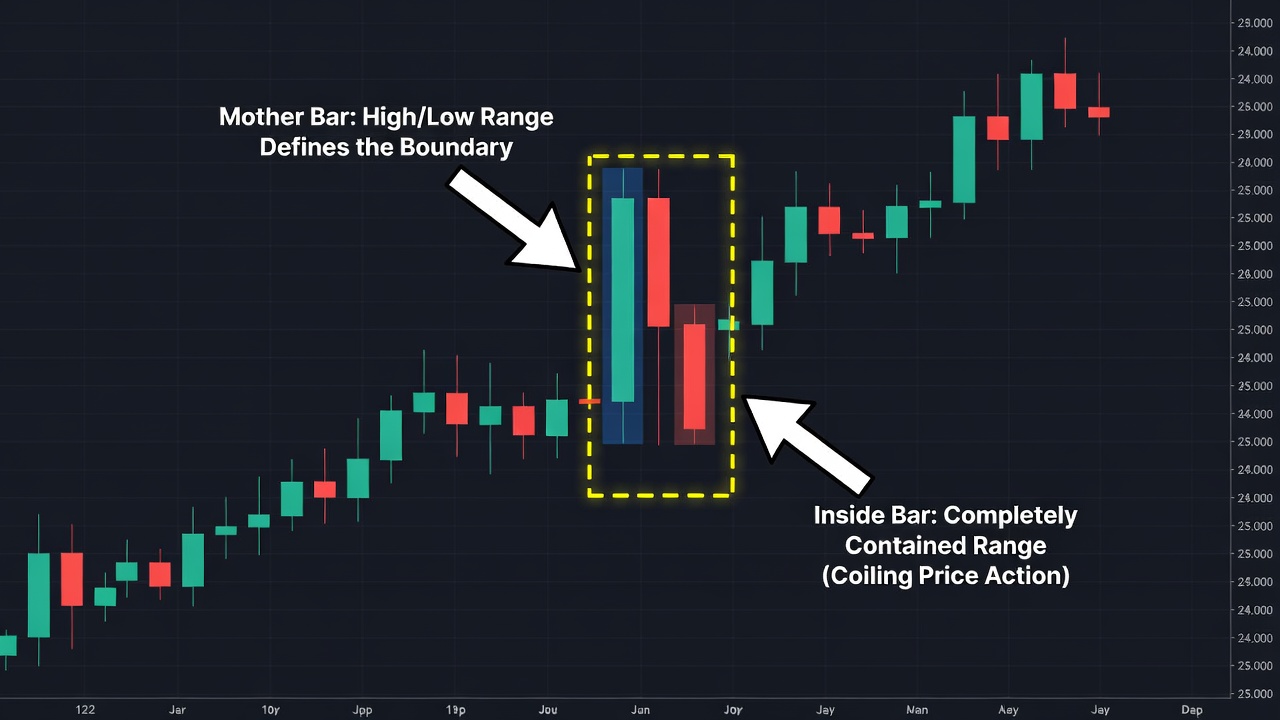
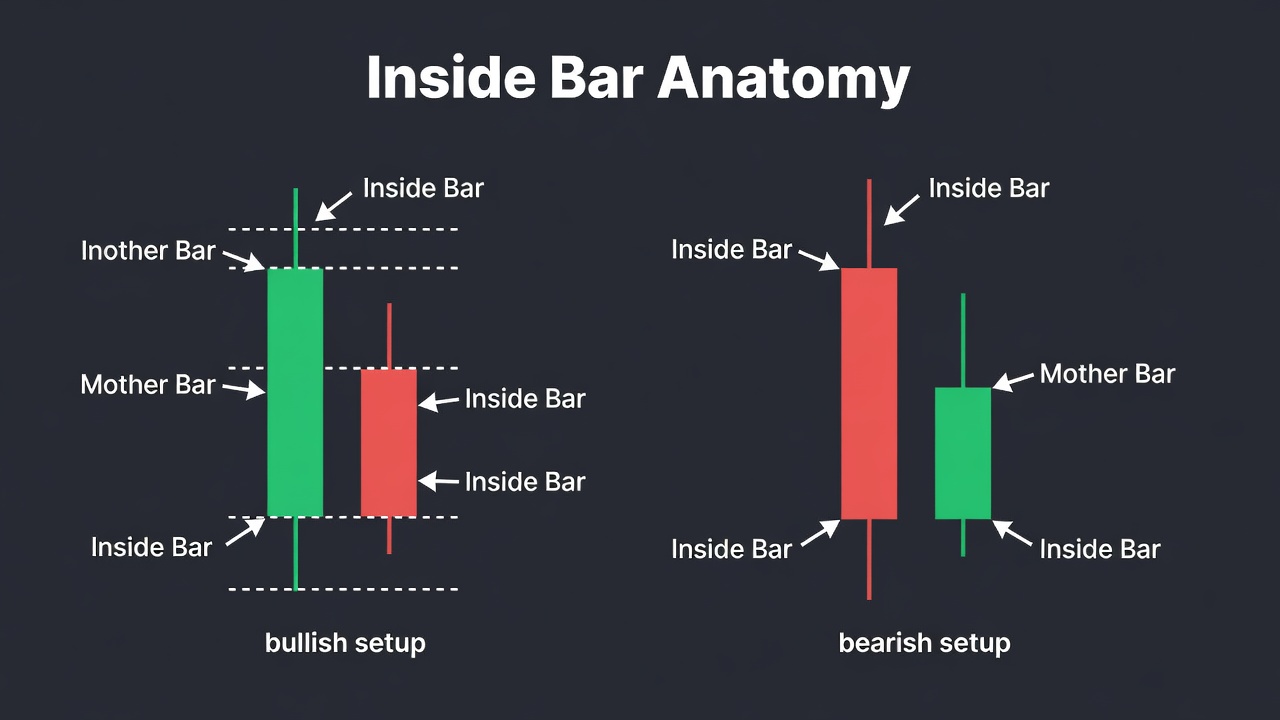
- The larger preceding candle is known as the “mother bar,” while the smaller engulfed candle is the “inside bar.”
- This strategy is most reliable on the daily and 4-hour timeframes, where market noise is minimized.
- Trade execution relies on placing pending stop orders just beyond the high or low of the mother bar to capture immediate breakout momentum.
What Is the Inside Bar Breakout Strategy?
The inside bar breakout strategy is a classic price action setup designed to trade the market’s transition from low volatility to high volatility. Originally popularized by legendary traders and technical analysts like Toby Crabel in his seminal work on short-term patterns, the setup consists of two key candlesticks: the mother bar and the inside bar. It represents a state of equilibrium or agreement between buyers and sellers, which is inevitably resolved by an aggressive price expansion. Traders watch for this pattern because it allows them to place exceptionally tight stop losses compared to the potential profit target, offering asymmetric risk-to-reward ratios. The pattern is highly versatile, functioning as a trend-continuation signal in strong trends or as a reversal setup at key structural levels.
The Market Psychology Behind the Inside Bar
Under the surface, the inside bar reveals a fierce battle where market participants are actively pausing, catching their breath, and building energy for the next move. When a strong mother bar forms, it indicates a dominant force in control—either aggressive buyers pushing price up or aggressive sellers driving it down. However, when the subsequent candle fails to break either the high or the low of that mother bar, it shows that the dominant force has paused and the counter-force is refusing to yield ground. The market has temporarily coiled like a spring. Inside bars often form ahead of major news releases or during quiet trading sessions where big institutional players are quietly accumulating or distributing positions. Once price breaks past the boundaries of the mother bar, it triggers a cascade of stop-loss orders from trapped counter-trend traders, fueling the explosive breakout momentum.
How to Identify the Inside Bar on a Chart
To trade this pattern successfully, you must master the rigid rules of its visual structure without accepting near-misses. Not every two-candle combination is an inside bar, and misidentifying this pattern leads to expensive whipsaws.
The Mother Bar Boundary
The first candle in the pattern is the mother bar. It must have a relatively large body and a well-defined range from high to low. This range acts as the ultimate boundary for the entire setup.
Complete Engulfment
The second candle, the inside bar, must be completely contained within the high-to-low range of the mother bar. This means the inside bar’s high must be lower than the mother bar’s high, and the inside bar’s low must be higher than the mother bar’s low. The candle body color of either bar does not matter; only the extreme highs and lows dictate the pattern’s validity.
Relative Candle Size
The inside bar should ideally be much smaller than the mother bar, representing a significant drop in volatility. If the second candle is nearly the same size as the first, the consolidation is weak and the subsequent breakout is less likely to be explosive.
Chart Location and Context
An inside bar that forms in the middle of a choppy, sideways range is useless noise. To be tradable, the pattern must print after a clear, established trend or directly at a major horizontal support or resistance level where a reversal is highly anticipated.
The Exact Inside Bar Breakout Strategy Setup Criteria
A valid trading setup requires every single condition in this checklist to be met before you risk a single dollar.
- Timeframe: Daily (D1) or 4-Hour (H4) charts only. Lower timeframes contain too much noise and false breakouts.
- Trend Context: A clearly defined trend must be present, indicated by a sloping 50-period Exponential Moving Average (EMA) or clean higher highs and higher lows.
- Engulfing Rule: The high of the inside bar must be strictly lower than the mother bar’s high, and the low must be strictly higher than the mother bar’s low.
- Multiple Inside Bars (Optional but Preferred): Setups containing two or more inside bars within the same mother bar indicate a highly coiled market and lead to more powerful breakouts.
How Do You Trade the Inside Bar? (Entry, Stop Loss, Target)
Execution of the inside bar breakout strategy must be completely mechanical, utilizing pending orders to eliminate emotional decision-making.
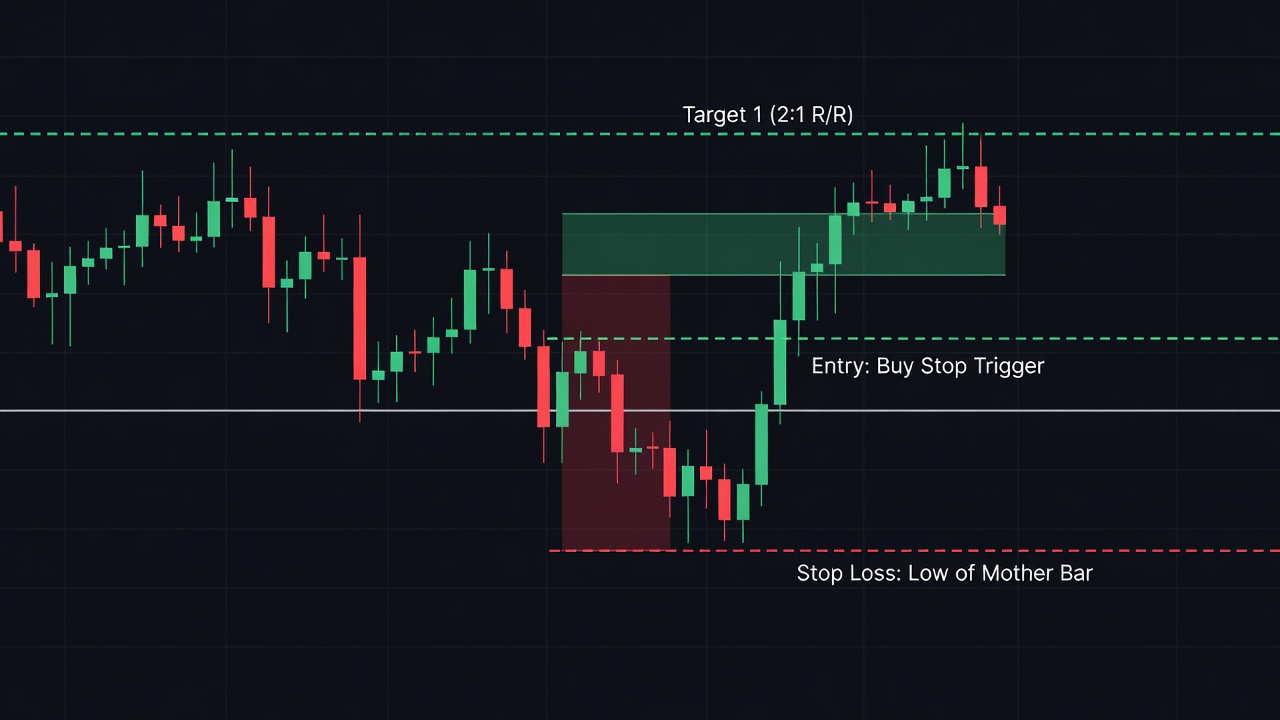
For a bullish breakout in an uptrend, place a Buy Stop order 2-3 pips/ticks above the high of the mother bar. For a bearish breakout in a downtrend, place a Sell Stop order 2-3 pips/ticks below the low of the mother bar. Do not trade with market orders; you only want to enter the market if price actively proves it has the momentum to break the mother bar’s boundary.
Your stop loss must be anchored defensively. The standard, safest placement is 2-3 pips/ticks below the opposite side of the mother bar (below the low for a long trade, or above the high for a short trade). If the mother bar is exceptionally large, you can place the stop loss just past the opposite side of the inside bar to improve your risk-to-reward ratio, though this increases the likelihood of being stopped out prematurely by a market test.
Targets should be projected using logical structural levels or fixed multiples. The primary target method is to project a 2:1 reward-to-risk ratio based on your initial risk. Alternatively, place your profit target just ahead of the next major key support or resistance level on the daily chart. If the trend is exceptionally strong, you can trail your stop loss behind the previous candle lows as the breakout expands.
Inside Bar Breakout Strategy Trade Example: Step-by-Step
Let us walk through a detailed, high-probability long setup using a hypothetical trade on EUR/USD on the Daily timeframe. The market had been in a strong, structural uptrend for three weeks, consistently printing higher highs and higher lows while holding cleanly above a rising 50 EMA. Price pulled back slightly to test a previous resistance-turned-support level at 1.1000.
On Tuesday, a large bullish green candle printed, establishing our mother bar with a high of 1.1050 and a low of 1.0970. On Wednesday, price action contracted significantly, printing a small red candle with a high of 1.1030 and a low of 1.0990. This second candle was completely engulfed within the high-to-low range of Tuesday’s mother bar, confirming a pristine inside bar setup at a major structural level.
We placed a pending Buy Stop order at 1.1053 (3 pips above the mother bar high) and anchored our Stop Loss at 1.0967 (3 pips below the mother bar low), resulting in a total risk of 86 pips. Our target was set at 1.1225, representing a clean 2:1 reward-to-risk ratio, situated just below the next major daily resistance level.
On Thursday, the market opened and immediately surged upward, triggering our Buy Stop entry. The momentum continued aggressively throughout the day, driven by the breakout. Over the next three days, the trend resumed, and the price hit our target at 1.1225, securing a highly profitable trade with minimal drawdown.
Inside Bar Breakout Strategy Across Different Timeframes
The inside bar behaves differently depending on the timeframe you choose, and failing to adjust your expectations will ruin your performance. On weekly and daily charts, inside bars represent significant macro consolidations. Breakouts from these setups often lead to major, multi-week trends with high reliability and minimal false triggers. On the 4-hour and 1-hour charts, the pattern is excellent for intraday trend continuation, allowing you to catch quick intraday swings. However, if you drop below the 1-hour chart to the 15-minute or 5-minute timeframes, inside bars become highly unreliable. At this level, the pattern is frequently caused by simple lunch-hour low volume rather than true structural market coiling, leading to constant false breakouts and heavy platform commissions.
Inside Bar vs. Engulfing Bar: Key Differences
Traders often confuse these two classic price action setups, but they represent completely opposite market dynamics and require different execution models.
The Inside Bar
The inside bar is a two-candle contraction pattern. The first candle is large, and the second candle is small, fitting entirely inside the first. It signals a contraction of volatility, a pause in trend, and a coiling of market energy. It is traded via breakout orders placed beyond the mother bar’s boundaries.
The Engulfing Bar
The engulfing bar is a two-candle expansion pattern. The first candle is small, and the second candle is large, completely engulfing the high and low range of the first. It signals an immediate, aggressive reversal of sentiment where one side of the market completely overwrites the other. It is typically traded immediately at the close of the engulfing candle, rather than waiting for a subsequent breakout.
Best Confluences to Stack With the Inside Bar
Trading inside bars in isolation is a quick way to drain your account; you must stack the odds in your favor by aligning multiple structural factors.
- Major Support or Resistance: An inside bar forming at a historical horizontal key level increases the likelihood of a powerful reversal or a highly defended trend continuation.
- 50 or 200 EMA: When price pulls back to a major moving average in a strong trend and prints an inside bar, it confirms the trend is respecting the dynamic support/resistance.
- Prior Day High or Low: An inside bar that forms just inside the previous day’s extreme boundaries highlights a market that is preparing to break out of the daily range.
- Volume Contraction: If volume decreases significantly during the formation of the inside bar, it confirms that institutional traders are stepping back, setting up an explosive volume spike on the breakout.
Common Inside Bar Mistakes to Avoid
Avoid these classic trading errors to protect your capital when trading this sensitive price action pattern.
- Trading inside bars during a messy, choppy, sideways market range where there is no clear dominant trend.
- Placing market orders as soon as the inside bar closes, instead of waiting for a pending stop order to trigger the actual breakout.
- Using inside bars on the 1-minute, 5-minute, or 15-minute timeframes where market noise dominates.
- Failing to adjust your stop loss wider when the mother bar is exceptionally large, resulting in tight stops getting hit on normal intraday breathing.
- Attempting to trade the pattern during low-liquidity holiday periods when consolidation is artificial rather than strategic.
Inside Bar Breakout Strategy Checklist
Before executing any trade, run through this quick checklist to ensure the setup is high-probability.
- Is the setup on a daily or 4-hour timeframe? (Yes/No)
- Is there a clearly defined trend or a major structural key level present? (Yes/No)
- Is the inside bar’s high strictly lower than the mother bar’s high? (Yes/No)
- Is the inside bar’s low strictly higher than the mother bar’s low? (Yes/No)
- Have you set a pending stop order to entry-trigger only on a true breakout? (Yes/No)
- Is your stop loss anchored logically past the mother bar or inside bar extreme? (Yes/No)
- Does the potential target offer at least a 1:2 risk-to-reward ratio before reaching major structure? (Yes/No)
Frequently Asked Questions About Inside Bars
What is the success rate of the inside bar strategy?
The success rate of the inside bar breakout strategy varies between 55% and 65% depending on the asset class and market conditions. Its true power lies in its asymmetrical risk-to-reward profile, where winning trades regularly return two to three times the amount risked, ensuring profitability even with a moderate win rate.
Which timeframe is best for trading inside bars?
The daily timeframe is the absolute best for identifying and trading inside bars because it eliminates false breakouts and captures major institutional order flow. The 4-hour chart is also highly effective for active traders looking for more frequent setups within strong weekly trends.
Should I trade inside bars in a range-bound market?
No, you should never trade inside bars in a sideways or range-bound market. Inside bars are contraction patterns that require an expansion phase to be profitable, and range-bound environments will simply trigger false breakouts in both directions, grinding your account down through whipsaws.
Can an inside bar have equal highs or lows with the mother bar?
No, an inside bar must have a strictly lower high and a strictly higher low than the mother bar. If the highs or lows are equal, the pattern is classified as a double top, double bottom, or a neutral range, which does not represent the contraction of volatility required for this specific strategy.
🎯 Get High-Probability Trade Setups — Free
The Big Dipper Dashboard delivers curated trade ideas straight to your screen every morning. Know what to watch before the opening bell.

📈 Want More? Join Our Free Trading Community
- Trading Strategy Guides Telegram — daily strategy tips and market insights
- Find Better Trades Telegram — free trade signals delivered to your phone
- Find Better Trades on YouTube — live trade breakdowns and tutorials