Topping Tail Candlestick Strategy: The Complete Guide

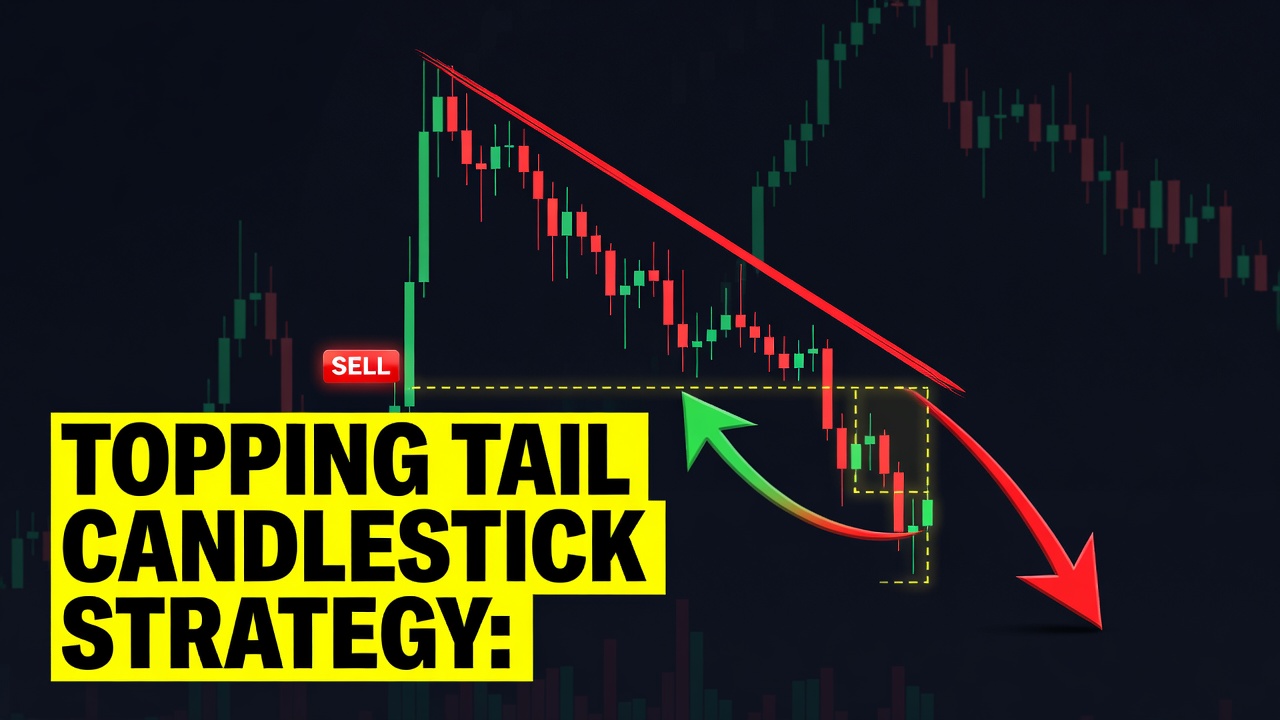
The Topping Tail Candlestick Strategy is an elite price action method used by professional traders to identify when an uptrend has exhausted its buying power and is about to reverse downward. This single-candle pattern features a long upper tail and a small real body near the bottom of the candle, signaling that buyers pushed prices aggressively higher only to be completely overwhelmed by sellers before the close. Successful swing traders and scalpers use this specific pattern to short markets at absolute structural highs with exceptionally tight, defined risk parameters.
- Topping tail candlesticks reveal real-time institutional distribution where heavy selling pressure overpowers retail buying momentum at key resistance.
- The pattern is defined by an upper wick that must make up at least two-thirds of the candle’s total high-to-low range.
- While the color of the small body does not break the setup, a red (bearish) close offers significantly higher mathematical probability.
- Placing stop losses immediately above the high of the topping tail wick provides a structurally logical, non-negotiable risk boundary.
What Is the Topping Tail Candlestick?
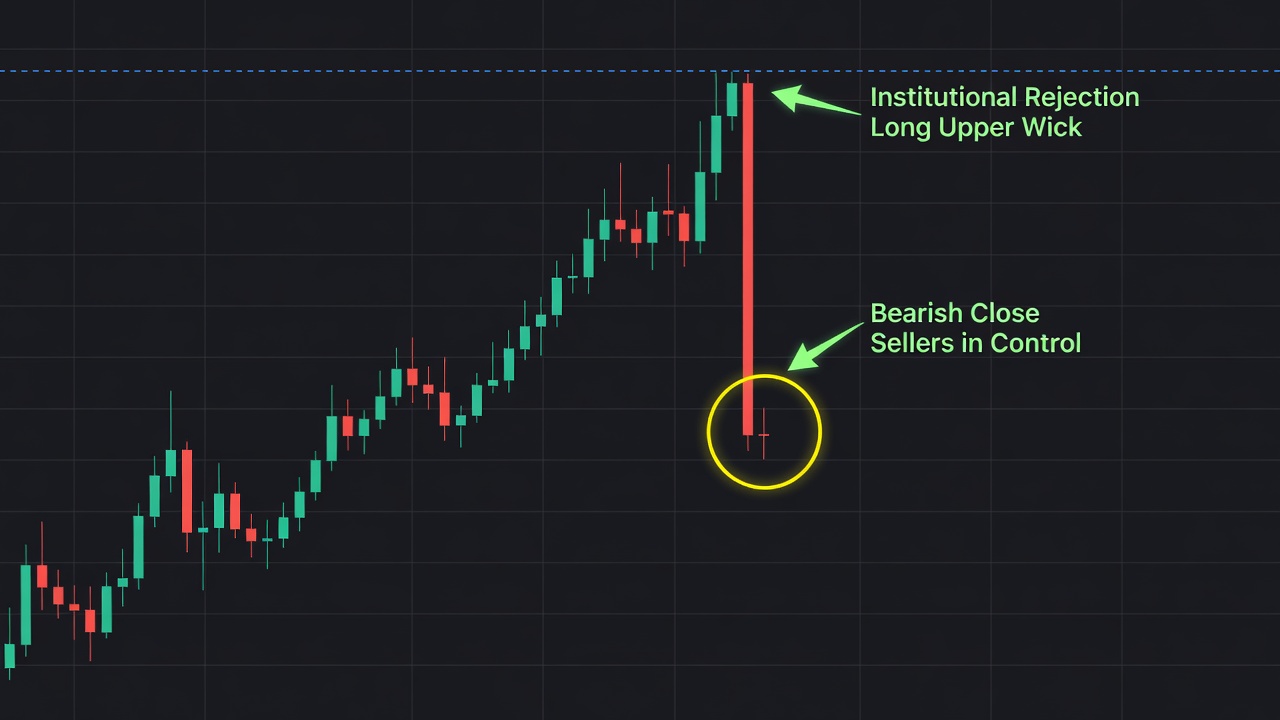
The topping tail candlestick is a bearish reversal pattern that materializes at the end of an uptrend, characterized by a long upper shadow and a small body near the daily low. First popularized in modern technical analysis literature as a variation of the classic shooting star or pin bar, this pattern represents a failed breakout. It occurs in markets where speculative buying drives price to new local highs, only to trigger massive institutional sell orders that flush the market back down to close near the session’s opening price. Traders monitor this pattern because it serves as a highly visible footprint of smart money distribution, showing that aggressive buyers have run out of inventory and aggressive sellers have seized control of the order flow.
The Market Psychology Behind Topping Tail Candlesticks
The psychology of a topping tail candle is a story of trapped breakout buyers and aggressive short-sellers stepping into a liquidity pool. Early in the session, strong bullish momentum drives prices higher, breaking through prior resistance levels and triggering buy-stop orders from retail shorts. This surge in price creates a FOMO (fear of missing out) environment, luring late-stage buyers to enter at the worst possible prices. Once the market reaches its peak, large institutional players use this influx of buy orders to fill their massive short positions without moving the market against themselves. As the institutional selling overwhelms the remaining buyers, the price collapses back down, trapping everyone who bought near the top and forcing them to hold losing positions as the candle closes near its low.
How to Identify the Topping Tail on a Chart
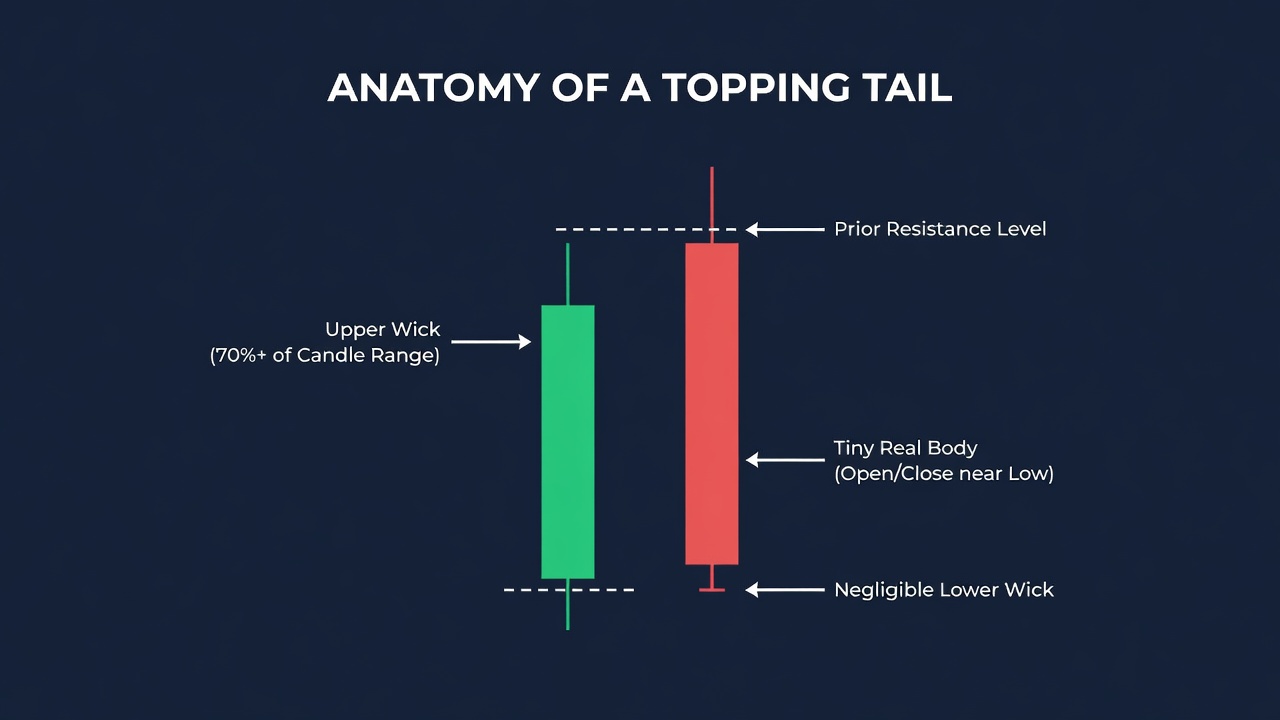
Accurately identifying a valid topping tail requires strict adherence to geometric rules rather than visual guesswork. Many traders fail because they mistake ordinary candles with minor upper wicks for true topping tails. To maintain a high-probability edge, the candlestick must meet three strict visual and structural benchmarks.
The Upper Tail Ratio
The upper tail, or wick, must be the dominant feature of the candlestick. Statistically, the upper tail must comprise at least 70% of the entire candle’s high-to-low range. Any wick shorter than this ratio indicates that sellers were unable to completely reject the price advance, leaving the setup highly vulnerable to failure.
The Real Body Position
The real body, which represents the distance between the open and close, must be exceptionally small and compressed. It must reside entirely within the bottom 25% of the candle’s total range. A real body located in the middle or top of the range invalidates the pattern, as it proves that buyers managed to defend their territory.
The Absence of a Lower Wick
A high-quality topping tail should have little to no lower wick. If a lower shadow exists, it must not exceed 5% to 10% of the candle’s total range. A noticeable lower shadow indicates that buyers stepped back in near the lows, which dilutes the bearish pressure required for an immediate reversal.
The Exact Topping Tail Setup Criteria
To filter out market noise and false signals, a tradeable topping tail setup must satisfy five non-negotiable structural conditions simultaneously. Do not trade this pattern in isolation; look for this confluence profile on your charting platform:
- Trend Context: The market must be in a clear, established uptrend or experiencing a sharp, multi-candle corrective rally within a larger downtrend.
- Location: The topping tail must print directly at a pre-identified key resistance level, such as a major horizontal supply zone, daily pivot point, or a key moving average.
- Wick-to-Body Ratio: The upper wick must be at least three times larger than the vertical height of the real body.
- Timeframes: The setup is highly reliable on the 4-Hour, Daily, and Weekly timeframes. Avoid timeframes below the 15-minute mark where noise destroys edge.
- Volume Confirmation: The topping tail candle should ideally be accompanied by above-average volume, confirming heavy institutional selling and distribution.
How Do You Trade the Topping Tail? (Entry, Stop Loss, Target)
Trading the topping tail successfully requires an execution plan that eliminates hesitation and protects capital through precise mathematical placement. Never market-order into a position while the candle is still active; wait for the candle to close to confirm the pattern structure.
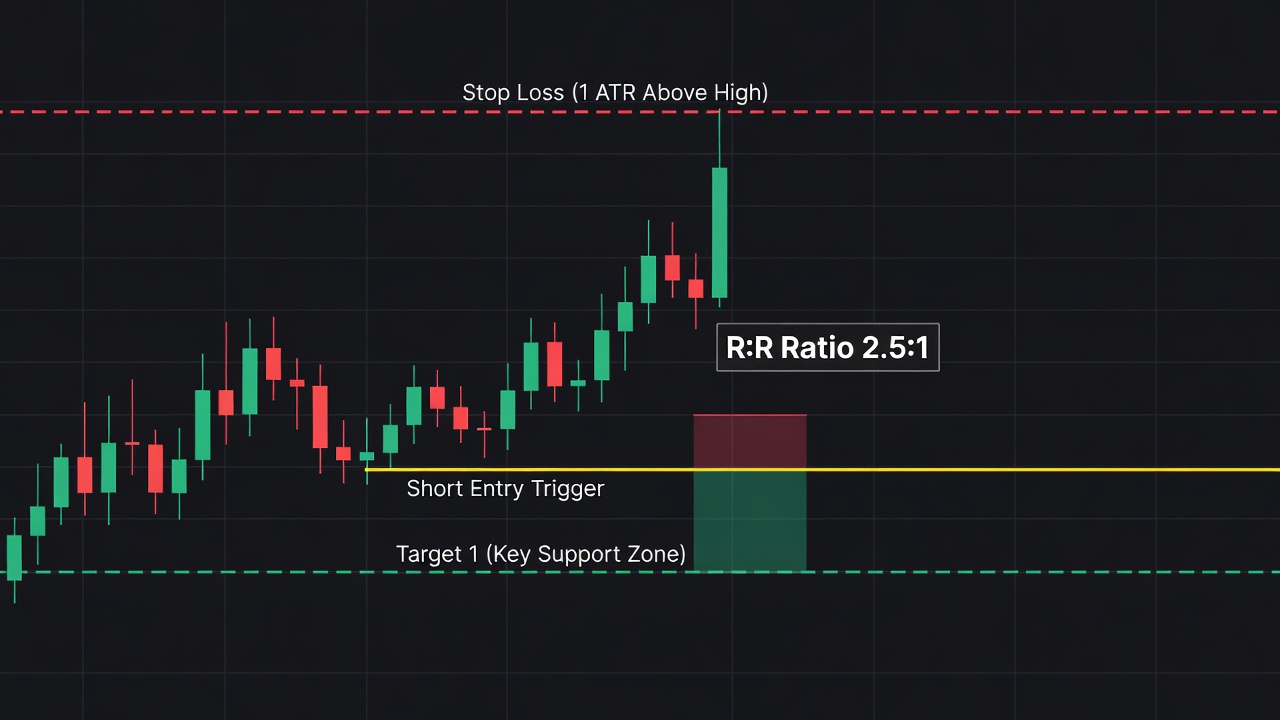
For your entry, place a sell-stop order slightly below the low of the topping tail candle. This ensures you are only dragged into the trade if bearish momentum continues into the next session. Alternatively, aggressive traders can enter on a 50% retracement of the upper tail during the next candle, which offers a tighter stop-loss distance but risks missing the move entirely if the price drops immediately.
Your stop loss must be placed slightly above the absolute high of the topping tail’s upper wick. To prevent getting prematurely stopped out by market noise or spread expansion, anchor your stop exactly 1 ATR (Average True Range) above that high. This provides a structural buffer while keeping risk tightly controlled.
Your profit targets should be anchored to major horizontal support areas, previous swing lows, or key moving averages. The minimum acceptable risk-to-reward ratio for this strategy is 2:1. You can manage the trade by taking half of the position off at the 2:1 mark and trailing the remaining half behind the 50-period EMA to capture a larger macroeconomic trend reversal.
Topping Tail Trade Example: Step-by-Step
Let us dissect a real-world short trade setup using the SPY ETF on the daily timeframe to illustrate the exact mechanics of execution. As you can see in the annotated chart above, SPY had been riding a strong, multi-week bullish trend, climbing from $510 up to a major horizontal resistance level at $535, which aligned perfectly with a psychological round number and the upper boundary of an ascending channel.
On day 14 of the rally, SPY opened strong and pushed higher to an intraday peak of $536.20. However, heavy institutional selling entered the market, forcing the price back down to close near the day’s low at $531.10. This price action formed a textbook topping tail candlestick with a massive 5.10-point upper wick and a tiny, red real body resting at the very bottom of the daily range. The daily volume was 35% higher than the 20-day moving average, confirming institutional distribution.
The trade was planned immediately after the daily close. A sell-stop order was placed at $530.90, just below the candle’s low. The stop loss was set at $537.20, which represented the high of the wick ($536.20) plus a 1.00-point ATR buffer. This created a total risk of 6.30 points per share. The profit target was identified at the major swing low support near $518.30, representing a potential gain of 12.60 points and offering a clean 2:1 risk-to-reward ratio.
The next day, the sell-stop was triggered within the first hour of trading. The market moved rapidly lower over the next five sessions, never threatening the stop loss at $537.20. On day six, the price hit the $518.30 target, completing a highly profitable, low-stress short trade executed entirely off price action rules.
Topping Tail Across Different Timeframes
While the topping tail pattern is universally applicable, its structural reliability scales significantly with higher timeframes. On intraday charts, such as the 5-minute or 15-minute, topping tails occur frequently but are often the result of minor algorithmic order matching rather than true institutional trend shifts. These lower-timeframe signals require strict volume confirmation and should only be traded in the direction of the higher-timeframe trend.
On the daily and weekly charts, a topping tail is an incredibly powerful event. It represents days or weeks of collective market positioning and is highly indicative of macro-level trend reversals. When a weekly topping tail forms at historical highs, it can signal the start of a multi-month bear market, making it one of the most profitable setups for swing traders and macro investors.
Topping Tail vs. Shooting Star: Key Differences
Topping Tail Candlestick
The topping tail is a pure price action term used to describe any candle with a long upper wick and a small body at the bottom of the range, regardless of prior trend. It is highly focus-driven on the immediate rejection of price at a specific key level, making it a highly localized structural tool.
Shooting Star Candlestick
The shooting star is a traditional Japanese candlestick term that strictly requires a prior upward trend to exist. While visually identical to a topping tail, a shooting star is specifically a trend-reversal pattern, whereas a topping tail can also be traded as a fake-out pattern in sideways ranges or as a continuation signal during a complex pullback in a downtrend.
Best Confluences to Stack With the Topping Tail
To maximize your win rate, never trade the topping tail in a vacuum; instead, stack multiple independent technical indicators to build a high-probability case.
- Major Resistance Zones: A topping tail that prints at a multi-month horizontal resistance line is twice as likely to succeed as one forming in the middle of nowhere.
- 50 or 200 EMA: When the price rallies up to a declining 200-period Exponential Moving Average and forms a topping tail, it signals a high-probability trend-continuation entry for shorts.
- Bearish Divergence (RSI/MACD): If the price prints a topping tail on a new high while the RSI shows a clear lower high, momentum is diverging, heavily favoring a deep sell-off.
- Prior Day High Liquidity Sweeps: If the upper wick sweeps just above the previous day’s high before reversing to form the tail, it indicates a successful stop-hunt that will likely crash immediately.
Common Topping Tail Mistakes to Avoid
- Trading the pattern in a strong, parabolic bull market without any prior signs of market structure breakdown or major historical resistance.
- Failing to wait for the candle to close, resulting in entry into a candle that eventually erases its tail and turns into a strong bullish breakout.
- Placing the stop loss too close to the real body to achieve an artificially high risk-to-reward ratio, leaving the trade vulnerable to normal market volatility.
- Ignoring the wick-to-body ratio and trading candles with large bodies and short wicks that do not represent true supply dominance.
- Disregarding the overall market context and trying to short a strong index when the broader sector is displaying massive bullish momentum.
Topping Tail Strategy Checklist
- Is the topping tail forming after a clear uptrend or a significant multi-candle swing high? (Yes/No)
- Is the upper wick at least 70% of the entire candle’s high-to-low range? (Yes/No)
- Is the real body located entirely within the bottom 25% of the candle range? (Yes/No)
- Does the pattern align directly with a major horizontal resistance level or key moving average? (Yes/No)
- Has the candlestick fully closed on the timeframe you are analyzing? (Yes/No)
Frequently Asked Questions About Topping Tails
What does a topping tail candle look like?
A topping tail candle features a very long upper wick and an incredibly small real body situated at the bottom of the session’s trading range. The lower wick must be virtually nonexistent, and the upper shadow must make up at least 70% of the entire candlestick from high to low.
Is a topping tail bullish or bearish?
The topping tail is a highly bearish price action pattern. It demonstrates that while buyers initially controlled the session and pushed prices to new highs, aggressive sellers completely rejected those high prices and forced the market to close near its low.
Where do you place the stop loss for a topping tail?
Your stop loss must be placed slightly above the absolute high of the topping tail’s upper wick. Adding a buffer of 1 ATR above this high prevents your position from being taken out by minor market noise or spread expansion before the downward move begins.
Can you trade topping tails on cryptocurrency charts?
Yes, the topping tail strategy is highly effective in cryptocurrency markets due to the frequent stop-hunts and liquidations that occur at key resistance levels. However, because crypto assets are highly volatile, you must use wider ATR stop-loss buffers and focus primarily on the daily and 4-hour charts to filter out noise.
🎯 Get High-Probability Trade Setups — Free
The Big Dipper Dashboard delivers curated trade ideas straight to your screen every morning. Know what to watch before the opening bell.

📈 Want More? Join Our Free Trading Community
- Trading Strategy Guides Telegram — daily strategy tips and market insights
- Find Better Trades Telegram — free trade signals delivered to your phone
- Find Better Trades on YouTube — live trade breakdowns and tutorials