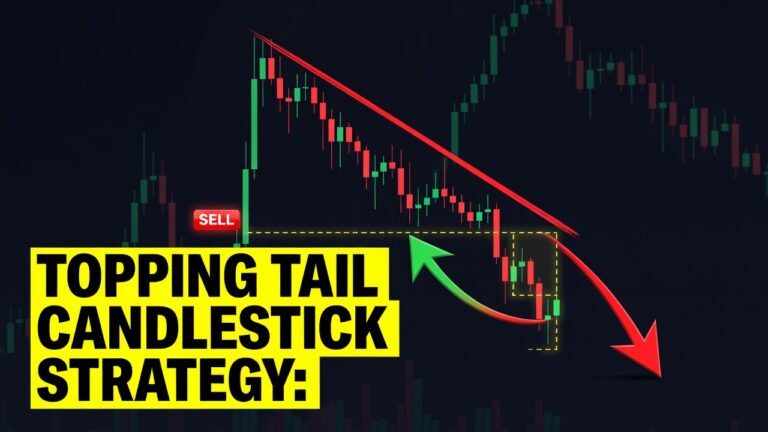
Complete Guide to the Topping Tail Candlestick Strategy

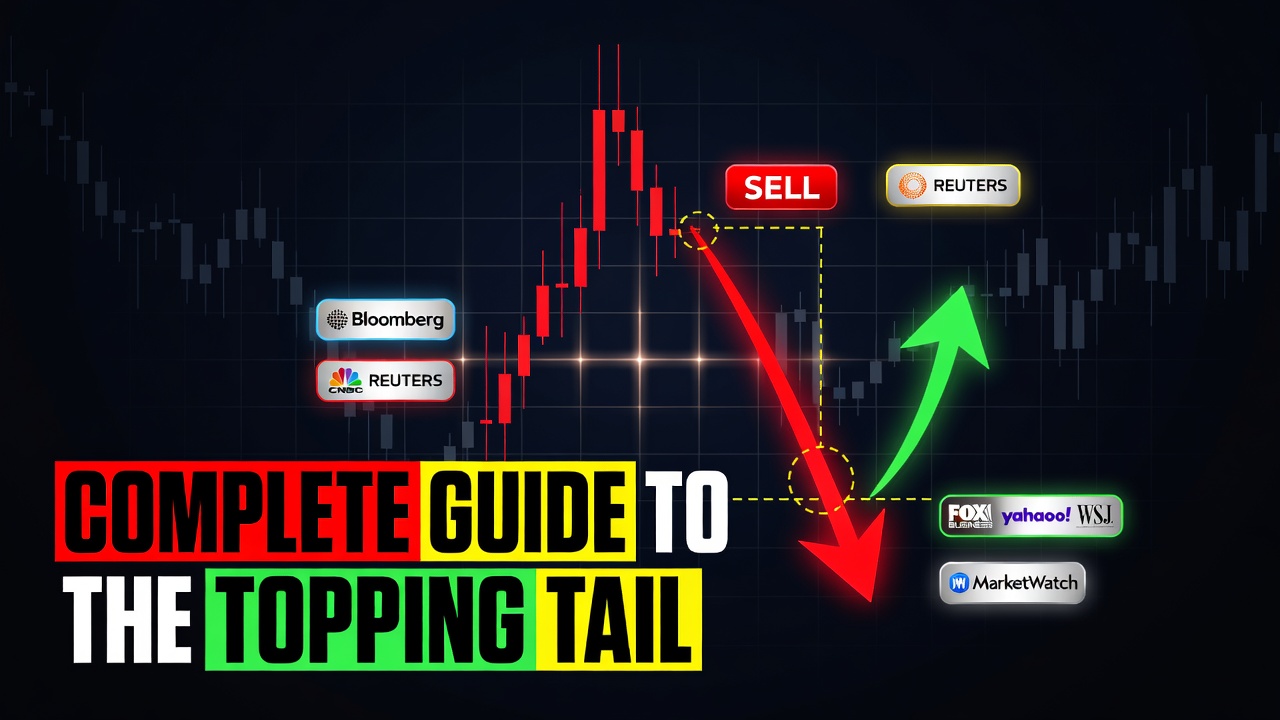
The topping tail candlestick strategy is a powerful price action method used by professional traders to identify when an uptrend has run out of momentum and is about to reverse aggressively downward. This single-candle pattern features a long upper tail, representing a fierce rejection of higher prices, and a small real body situated near the very bottom of the candle’s range. It serves as a highly reliable leading indicator of bearish trend reversals across all liquid asset classes, from forex and crypto to stocks and futures.
- High-Probability Reversals: The topping tail signals that buyers attempted to push prices higher but were completely overwhelmed by sellers before the candle closed.
- Clear Risk Definition: The high of the topping tail provides a definitive, unarguable level for stop-loss placement.
- Context is King: This pattern is only tradable when it appears after a sustained uptrend or at a key resistance level, not in choppy sideways markets.
- Excellent Risk-to-Reward: Because entries occur right at the turning point of a trend, traders can target substantial downside moves with relatively tight stop losses.
What Is the Topping Tail?
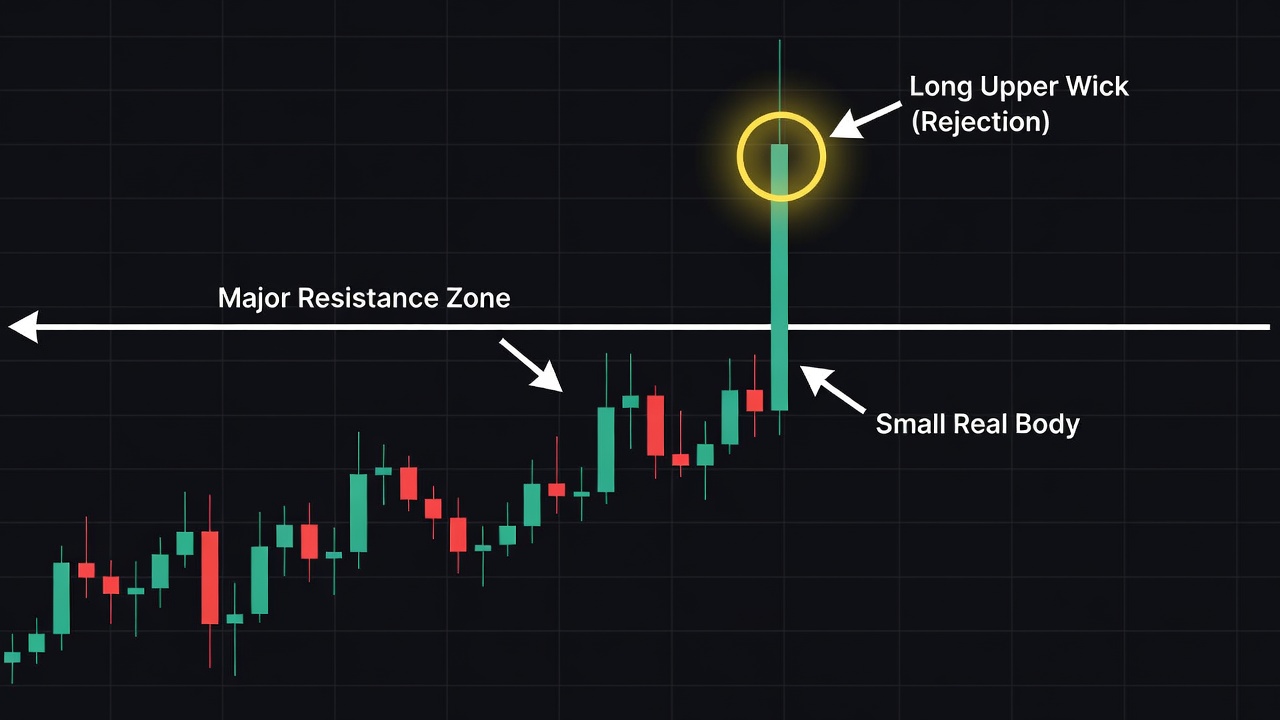
The topping tail candlestick is a single-bar price action pattern that shows a sharp, immediate rejection of higher prices during an uptrend. Often referred to in classic technical analysis as a shooting star or a bearish pin bar, the topping tail is characterized by its long upper shadow (the tail) and its small real body located at the bottom of the session’s trading range. Professional floor traders and institutional market makers first documented this pattern as they watched aggressive buying climaxes get rapidly absorbed and turned around by heavy institutional selling. It occurs when a market climbs to a new swing high, trapping late-stage buyers, only for aggressive short sellers to step in and push the price back down to close near the open. This leaves behind a stark visual record of failed bullish momentum.
The Market Psychology Behind the Topping Tail
The topping tail candlestick acts as a visual representation of a classic bull trap and a sudden shift in control from buyers to sellers. During the formation of the candle, early momentum looks incredibly bullish as buyers aggressively bid up the asset, breaking past previous highs and creating FOMO (fear of missing out) among retail traders. As these retail buyers chase the breakout, institutional sellers and large-scale profit-takers view the influx of buying liquidity as the perfect opportunity to exit their long positions and establish heavy short positions. This massive influx of sell orders completely overwhelms the buying pressure, forcing the price back down. The rapid decline triggers panic among the traders who just bought the high, forcing them to liquidate their positions, which adds further fuel to the downward move. When the candle closes near its low, it leaves behind a long tail of trapped buyers who are now sitting in losing positions, setting the stage for a rapid downward reversal.
How to Identify the Topping Tail on a Chart
Correctly identifying a genuine topping tail requires adhering to strict structural and spatial rules to filter out low-quality noise. Not every candle with an upper wick is a topping tail; the relationship between the wick, the body, and the surrounding price action must meet precise visual criteria.
The Upper Wick (The Tail)
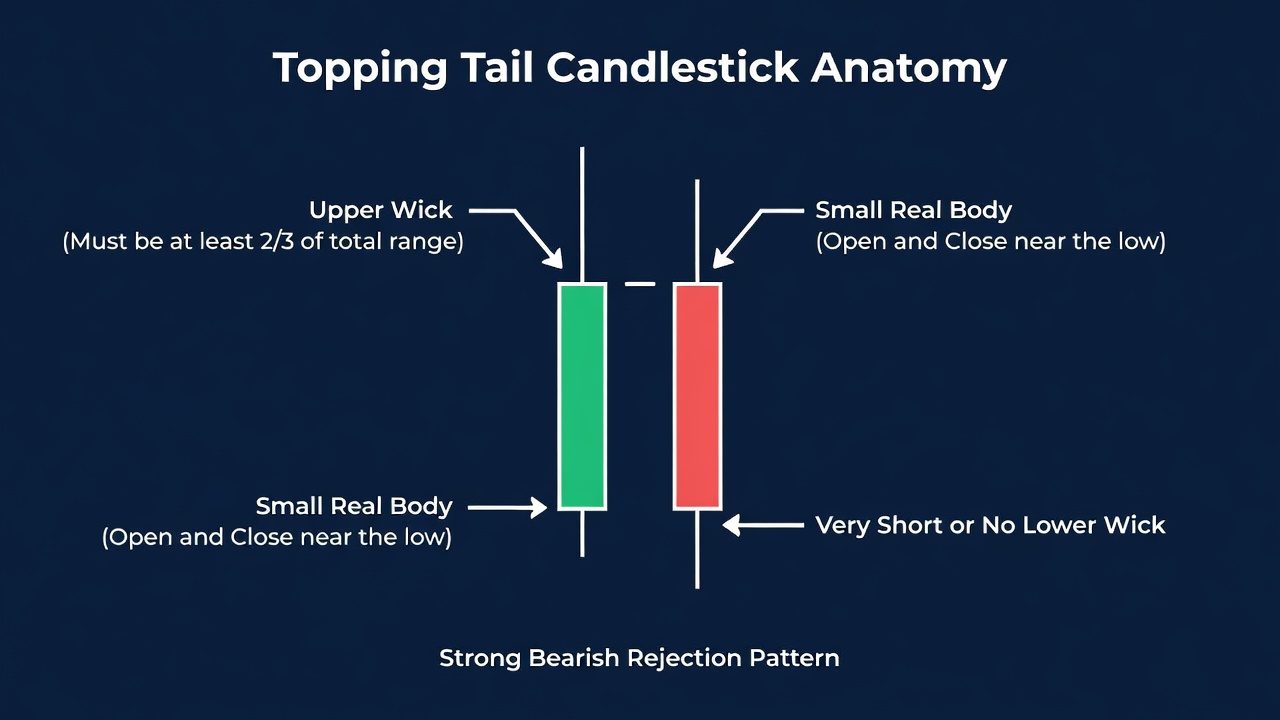
The upper tail must be the most prominent feature of the candlestick, representing at least two-thirds of the total candle range. This extreme length is non-negotiable because it proves that the market made a significant excursion upward before being violently rejected by sellers.
The Real Body
The real body of the candlestick must be very small and located entirely within the bottom third of the candle’s total range. The color of the body can be green or red, but a red body is vastly superior as it confirms that the price closed below its opening price, signaling absolute seller dominance at the end of the session.
The Lower Wick
The lower wick must be virtually non-existent or extremely small. A prominent lower wick indicates that buyers managed to push the price back up before the close, which dilutes the bearish implication of the topping tail.
Surrounding Context
A true topping tail must stand out from the surrounding price action and occur after a clear, sustained move upward. If the candle is buried inside a congested, sideways trading range, it is not a topping tail; it is merely noise within a consolidation phase.
The Exact Topping Tail Setup Criteria
To trade this pattern with a consistent edge, you must only take setups that meet every single condition of a strict operational checklist. Half-signals lead to break-even or losing trades.
- Sustained Uptrend: The market must have completed at least 3-5 consecutive bullish candles, or a clear extension above the 20-period Exponential Moving Average (EMA), preceding the pattern.
- Location at Key Resistance: The topping tail must print directly at a major daily resistance level, previous swing high, or psychological round number.
- Wick-to-Body Ratio: The upper wick must be at least 2 to 3 times the size of the real body.
- Closing Position: The candle close must be in the bottom 25% of the high-to-low range of that specific candle.
- Timeframe Alignment: The setup is highly reliable on the 1-hour (H1), 4-hour (H4), and Daily (D1) charts; intraday timeframes below the 15-minute chart should be avoided due to market noise.
How Do You Trade the Topping Tail? (Entry, Stop Loss, Target)
Successful execution of the topping tail strategy requires a systematic entry trigger, a rock-solid stop-loss anchor, and a realistic profit target.
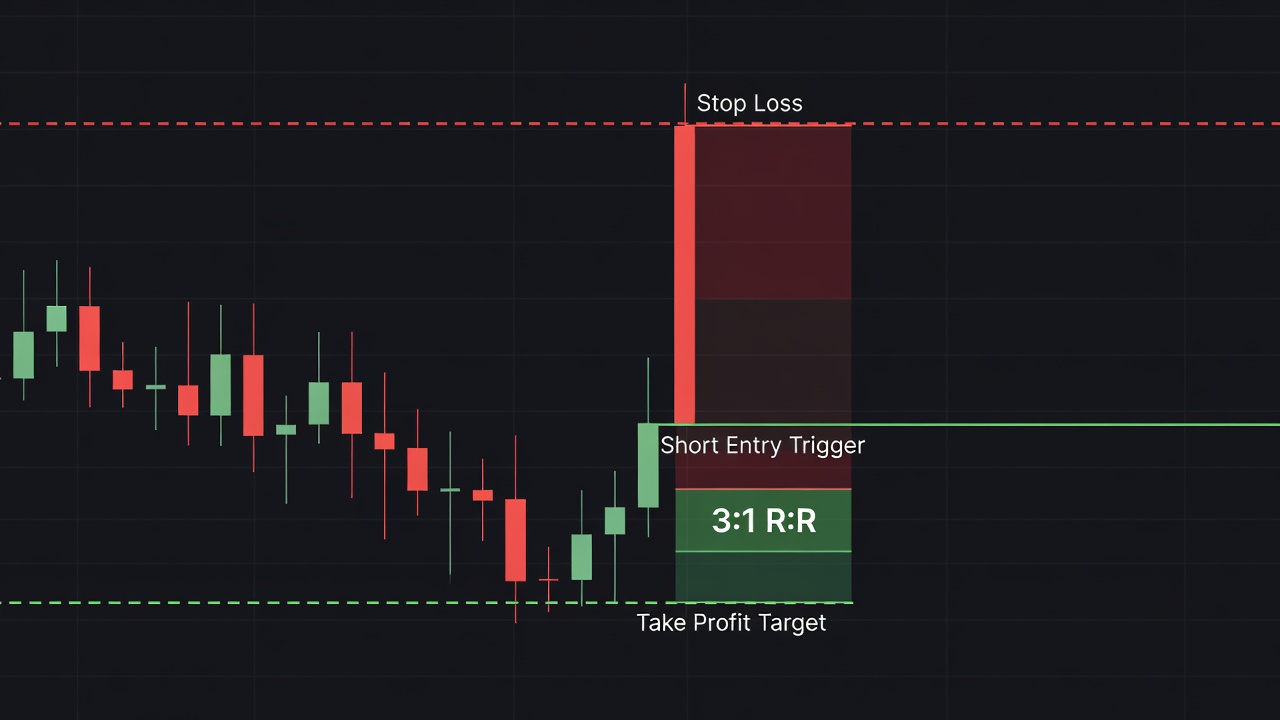
The Entry: There are two professional methods for entering a topping tail trade. The first is the momentum entry: place a sell-stop order 1-2 pips/cents below the low of the topping tail candle. This ensures you are only dragged into the trade if the market continues to move in your intended direction. The second is the pullback entry: wait for the next candle to open and trace back up to test the 50% retracement level of the topping tail’s upper wick. This provides a much tighter stop loss and a superior risk-to-reward ratio, though you risk missing the trade if the price drops immediately.
The Stop Loss: Your stop loss must be placed 2-5 pips/cents above the absolute high of the topping tail’s upper wick. If the price breaks above this high, the bearish rejection has been invalidated, and you must exit the trade immediately. Do not widen this stop under any circumstance.
The Target: Your first profit target (TP1) should be placed at the nearest major support level or previous swing low, which typically yields a 2:1 risk-to-reward ratio. To capture larger trend reversals, you can close half of your position at TP1, move your stop loss to break-even, and trail the remaining half using a moving average or a previous swing high structure until a bullish reversal pattern emerges.
Topping Tail Trade Example: Step-by-Step
To illustrate the strategy in action, let us walk through a high-probability short setup on a daily chart. As you can see in the annotated chart above, the asset has been in a strong, structural uptrend over the last three weeks, printing higher highs and higher lows. The price rallies aggressively toward a key horizontal resistance level that has held firm twice over the past six months.
On day 15 of the rally, the market gaps up at the open and surges past the resistance level, making a new multi-month high. However, institutional sell orders cluster heavily at this key level. Within hours, the upward momentum stalling turns into an aggressive wave of selling. The price collapses back below the resistance level, closing the day near its dead low. This prints a textbook Topping Tail candlestick with a massive upper wick that is four times larger than the small, red real body.
The trade is executed using a sell-stop order placed just below the low of this topping tail candle. The stop loss is anchored five pips above the high of the wick. On the next candle, the sell-stop is triggered as sellers immediately resume control. Over the next five sessions, the market drops sharply. The trade hits its first profit target at a key daily support level, securing a highly profitable 3:1 risk-to-reward return on the initial risk risked.
Topping Tail Across Different Timeframes
While the topping tail pattern forms on all timeframes, its reliability and overall market impact scale up significantly with higher timeframes. On lower timeframes, such as the 1-minute or 5-minute charts, topping tails print constantly due to minor order imbalances and high-frequency trading noise. These lower-timeframe patterns often fail to generate sustained reversals because they lack institutional backing. On the 1-hour and 4-hour charts, topping tails become highly effective tools for swing traders, as they mark intraday cycle turns with great accuracy. The daily and weekly charts produce the absolute cleanest and most reliable signals. When a topping tail prints on a weekly chart at a major historical level, it represents a massive macro-level shift in supply and demand that can spark multi-month bear markets, offering position traders massive run-up potentials.
Topping Tail vs. Shooting Star: Key Differences
While many retail traders use these terms interchangeably, there are distinct structural differences between a topping tail and a shooting star. Knowing these nuances helps you filter out weaker trade setups.
The Topping Tail
The topping tail is a pure price action term that focuses strictly on the location of the candle and the extreme ratio of the upper wick. A topping tail can have either a green or red body, but its defining feature is its occurrence at an overextended market point or a major horizontal resistance level. It represents absolute rejection of value above a certain price threshold.
The Shooting Star
The shooting star is a classic Japanese candlestick pattern that requires a specific sequence of candles to be fully valid. Specifically, a shooting star must gap up away from the real body of the previous candle, leaving a physical space between the two bodies. It is a more rigid structural definition that is harder to find in modern 24-hour markets like forex or crypto, where weekend gaps are the only physical gaps that occur.
Best Confluences to Stack With the Topping Tail
Trading the topping tail in isolation is a recipe for mediocrity; stacking it with complementary technical tools creates a highly accurate trading system.
- Horizontal Support and Resistance: A topping tail that pierces and rejects a long-term horizontal resistance level has double the probability of success compared to one in open space.
- Moving Average Rejection: Look for the topping tail to reject a key moving average, such as the 50-period or 200-period EMA, during a structural downtrend pullback.
- Fibonacci Retracement Levels: A topping tail forming precisely at the 61.8% or 78.6% Fibonacci retracement level of a major downward swing signals a highly profitable continuation entry point.
- Volume Spike: A massive spike in trading volume during the formation of the topping tail confirms that institutional players are actively distributing shares and shorting the asset.
- RSI Bearish Divergence: If the price prints a topping tail on a higher high while the Relative Strength Index (RSI) prints a lower high, it confirms that underlying buying momentum is completely exhausted.
Common Topping Tail Mistakes to Avoid
Even seasoned price action traders make critical mistakes when executing this strategy if they lose focus of market context. Avoid these common traps to protect your trading capital:
- Trading Against a Strong Trend: Never short a topping tail that prints during a massive, parabolic bull market that shows no signs of slowing down; the trend will easily run over your stop.
- Ignoring the Candle Close: Do not enter a trade while the candle is still active; wait for the candle to close to ensure the upper tail does not get filled by late-session buyers.
- Chasing Low-Ratio Candles: Avoid topping tails where the upper wick is less than twice the size of the real body, as these show weak rejection.
- Trading in Sideways Markets: Do not trade topping tails that form within a choppy, low-volume consolidation zone where the market is merely oscillating around a mean.
- Setting Targets Too Far: Avoid placing your profit targets beyond major, untested weekly support levels where buyers are highly likely to step back in.
Topping Tail Checklist
Run through this binary checklist before executing any topping tail trade setup:
- Is the market in an established uptrend or a pullback within a downtrend? (Yes/No)
- Did the topping tail form at a major key resistance level, EMA, or Fibonacci level? (Yes/No)
- Is the upper wick at least two times larger than the real body? (Yes/No)
- Is the real body located entirely within the bottom 25% of the candle’s range? (Yes/No)
- Has the topping tail candle officially closed? (Yes/No)
- Is your stop loss placed strictly above the highest point of the upper wick? (Yes/No)
Frequently Asked Questions About the Topping Tail
What is a topping tail candlestick?
A topping tail candlestick is a bearish price action reversal pattern characterized by a long upper shadow and a small real body near the low. It indicates that buyers pushed the price up during the session, but heavy selling pressure completely erased those gains before the candle closed.
Is a green topping tail still bearish?
Yes, a green topping tail is still a bearish signal, but it is slightly less powerful than a red topping tail. The key to this pattern is the massive upper wick proving rejection, though a red body is preferred as it shows sellers managed to push the close below the open.
What timeframe is best for trading topping tails?
The topping tail is most reliable on the 4-hour, daily, and weekly charts where market noise is minimal. While it appears on lower intraday timeframes, those signals suffer from high failure rates due to random volatility and lack of institutional backing.
Where do you place the stop loss for a topping tail?
Your stop loss must always be placed 2 to 5 pips or cents above the absolute high of the topping tail’s upper wick. If the price breaks this high, the bearish rejection thesis is completely invalidated, and you must exit the trade immediately to preserve capital.
🎯 Get High-Probability Trade Setups — Free
The Big Dipper Dashboard delivers curated trade ideas straight to your screen every morning. Know what to watch before the opening bell.

📈 Want More? Join Our Free Trading Community
- Trading Strategy Guides Telegram — daily strategy tips and market insights
- Find Better Trades Telegram — free trade signals delivered to your phone
- Find Better Trades on YouTube — live trade breakdowns and tutorials