Ultimate Guide to Trading SMC Inducement and FVG in Chipmaker Stocks

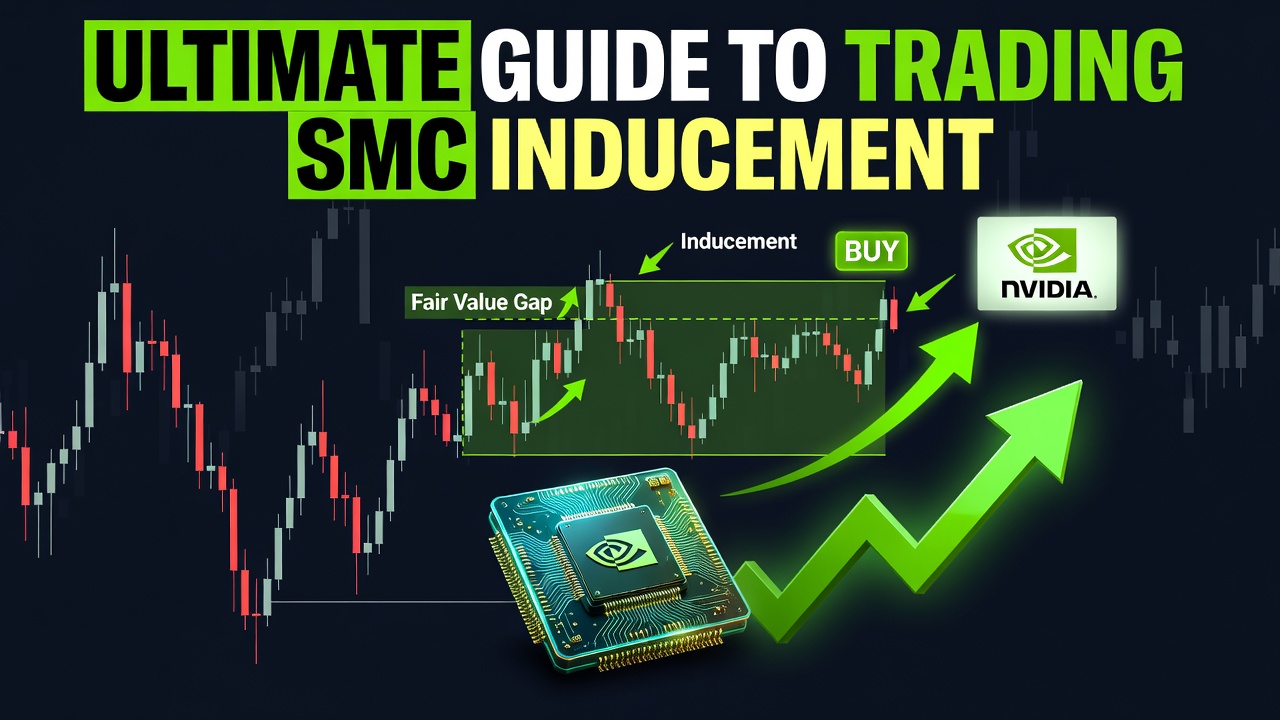
The SMC Inducement and Fair Value Gap strategy is a high-precision institutional trading framework designed to exploit retail liquidity traps in high-momentum equities. When applied to high-beta chipmaker stocks like Nvidia (NVDA), Advanced Micro Devices (AMD), and Micron (MU), this system becomes highly effective because AI data center demand drives massive volume and predictable institutional accumulation phases. If you want to stop getting stopped out right before the real move happens, this strategy is for you.
What Is SMC Inducement and Fair Value Gaps?
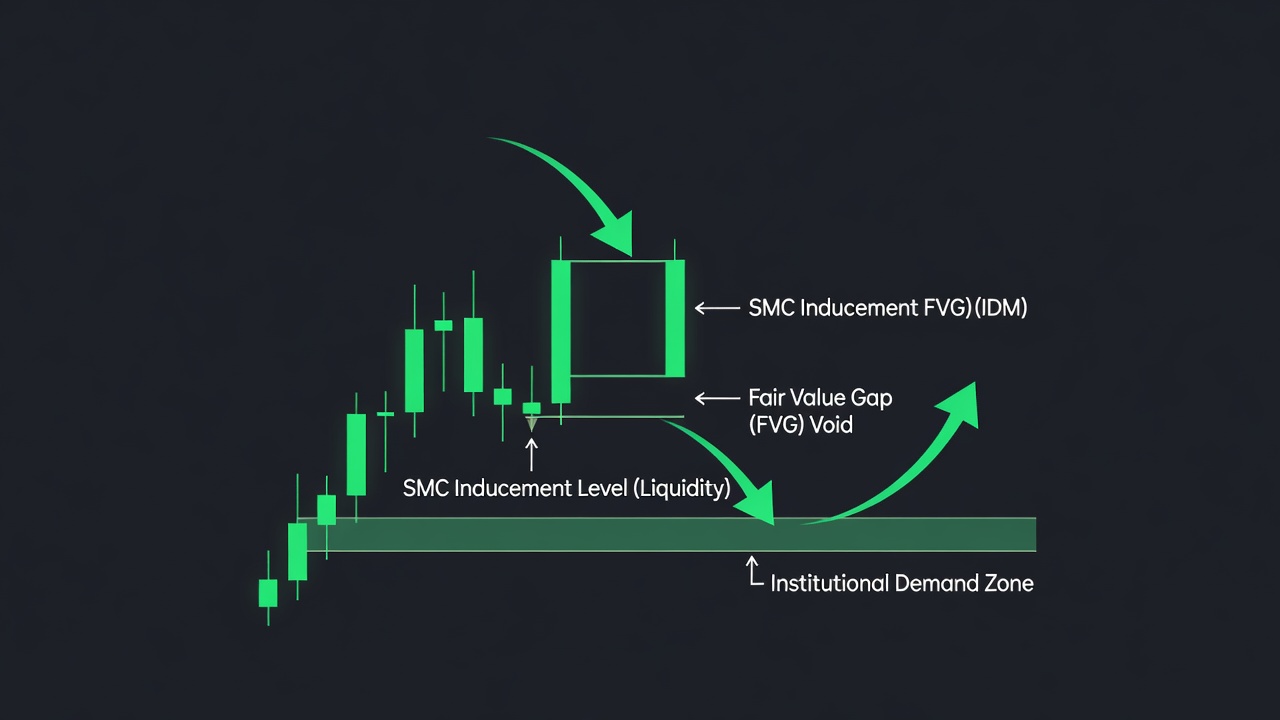
The SMC Inducement and Fair Value Gap strategy is a methodology derived from institutional order flow trading. Inducement refers to a specific market structure point (usually a minor swing high or swing low) designed to lure retail traders into taking positions too early, creating a pool of stop losses that smart money can target for liquidity. A Fair Value Gap (FVG) is a three-candle price imbalance where buying or selling pressure is so intense that it leaves a structural void, which the market must eventually return to fill.
Why This Edge Works
The edge of this strategy lies in understanding liquidity engineering. Major institutions cannot buy millions of shares of NVDA or MU without moving the market; they need counterparties to fill their large orders. To do this, they engineer an “inducement” point—a visible support level that retail traders buy. Once retail stop losses are clustered tightly below this support, institutions push price lower to trigger those sell stops, providing the necessary liquidity to fill their buy orders inside an underlying Fair Value Gap. This creates a high-probability reversal zone where we can align our trades directly with institutional order blocks.
The Setup Rules
- Asset Selection & Timeframe: Trade only highly liquid chipmaker stocks (NVDA, AMD, MU, AVGO) during active US market sessions. Use the 15-minute chart for identifying structural zones and the 1-minute or 3-minute chart for entry execution.
- Market Structure: Confirm an overall bullish trend on the 15-minute chart, marked by a clear Break of Structure (BOS) to the upside.
- Identify the Inducement (IDM): Locate the most recent minor swing low that retail traders would define as short-term support. This level must sit above an unfilled bullish 15-minute Fair Value Gap.
- Locate the Fair Value Gap (FVG): Find the three-candle imbalance directly below the inducement level. The space between Candle 1’s high and Candle 3’s low represents the FVG zone.
- Liquidity Sweep: Wait for price to aggressively trade down, sweep past the inducement level to trigger the retail stop losses, and tap into the FVG zone.
Entry Trigger
The moment price sweeps the inducement low and enters the 15-minute FVG, drop to the 1-minute chart. Your entry is triggered when you see a Change of Character (CHOCH) to the upside, which is defined as the first 1-minute swing high being broken by a full candle body close. Alternatively, you can execute a direct limit entry at the 50% equilibrium level (consequent encroachment) of the 15-minute FVG if the immediate reaction shows high-volume buying tails.
Stop Loss & Profit Target
Place your stop loss exactly 1.00 USD below the structural swing low that formed the demand zone or order block directly beneath the FVG. Your profit target is set at the recent 15-minute swing high (the original point of origin for the retracement). This structural setup routinely offers a risk-to-reward ratio of 3:1 or higher, meaning you can be wrong half the time and still remain highly profitable.
Trade Walkthrough: What It Looks Like on a Chart
As you can see in the chart above, we are looking at NVDA on the 15-minute timeframe. The stock had just broken local resistance, printing a massive expansion candle that created a clear Fair Value Gap between $838.00 (Candle 1 high) and $844.00 (Candle 3 low). Just above this FVG, price formed a minor pullback swing low at $845.00—this is our Inducement (IDM) level.
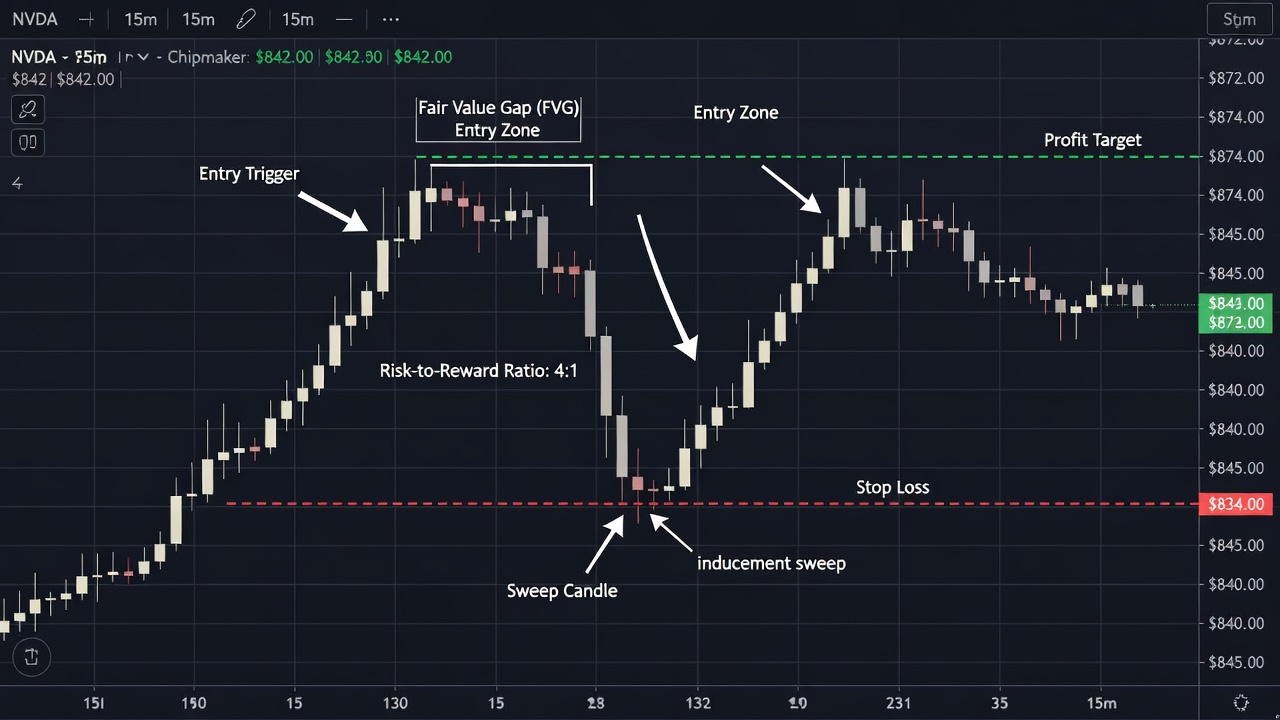
Retail traders saw this $845.00 level as support and went long, placing their stops just under it. Institutional algorithms pushed price down rapidly, sweeping the $845.00 level to grab that liquidity. Price dipped directly into the 50% mark of the FVG at $841.00. On the 1-minute chart, a bullish engulfing candle closed above the local swing high, confirming our entry trigger at $842.00. The stop loss was set below the demand block at $834.00. Price immediately reversed, soaring to hit our profit target at the prior swing high of $874.00, securing a massive 4:1 reward-to-risk trade.
Common Mistakes to Avoid
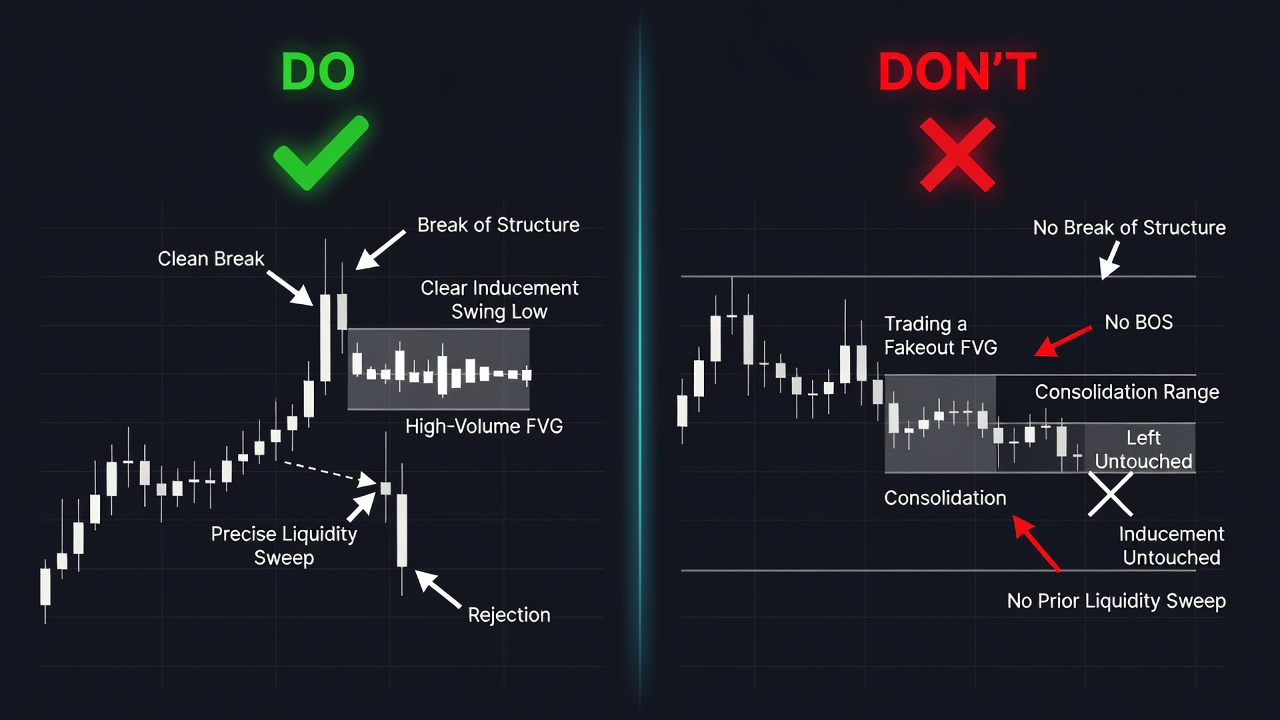
- Trading without a Sweep: Do not enter a trade inside an FVG if the inducement low has not been swept yet; without a liquidity grab, the market will likely drop deeper to hunt for stops.
- Ignoring High-Impact News: Avoid trading this strategy within 15 minutes of major chipmaker earnings reports or US CPI data releases, as slippage can ruin your risk profile.
- Using the Wrong FVG: Avoid trading FVGs that are in the “Premium” zone of the current trading range; only look for setups in the “Discount” zone (lower 50% of the active range).
- Impatient Entry Execution: Do not buy immediately when price touches the top of the FVG; always wait for the inducement sweep and the lower-timeframe structural shift.
Quick Reference Checklist
- Is the higher-timeframe trend in chipmaker stocks strongly bullish? (Yes/No)
- Has a clear Break of Structure (BOS) occurred to establish a new trading range? (Yes/No)
- Is there a visible swing low acting as an inducement above our target FVG? (Yes/No)
- Has price swept the inducement level to trigger retail stop losses? (Yes/No)
- Did price tap into the lower 50% of the 15-minute FVG zone? (Yes/No)
- Has a 1-minute or 3-minute Change of Character (CHOCH) confirmed institutional buying pressure? (Yes/No)
🎯 Get High-Probability Trade Setups — Free
The Big Dipper Dashboard delivers curated trade ideas straight to your screen every morning. Know what to watch before the opening bell.

📈 Want More? Join Our Free Trading Community
- Trading Strategy Guides Telegram — daily strategy tips and market insights
- Find Better Trades Telegram — free trade signals delivered to your phone
- Find Better Trades on YouTube — live trade breakdowns and tutorials