The Complete Guide to Trading USD/JPY with ICT MSS and FVG


Trading USD/JPY during periods of heavy Bank of Japan (BOJ) intervention speculation requires a framework that tracks where institutional money actually moves, rather than guessing at news headlines. This strategy combines Inner Circle Trader (ICT) Market Structure Shifts (MSS) and Fair Value Gaps (FVG) to exploit the massive volatility generated when the BOJ steps in or when major market makers front-run sovereign policy changes. Designed specifically for intraday currency traders, this strategy filters out the noise of retail indicators and focuses strictly on algorithmic liquidity sweeps and rapid institutional repricing, allowing you to ride explosive Japanese Yen moves with pinpoint risk parameters.
What Is ICT Market Structure Shift and Fair Value Gap?
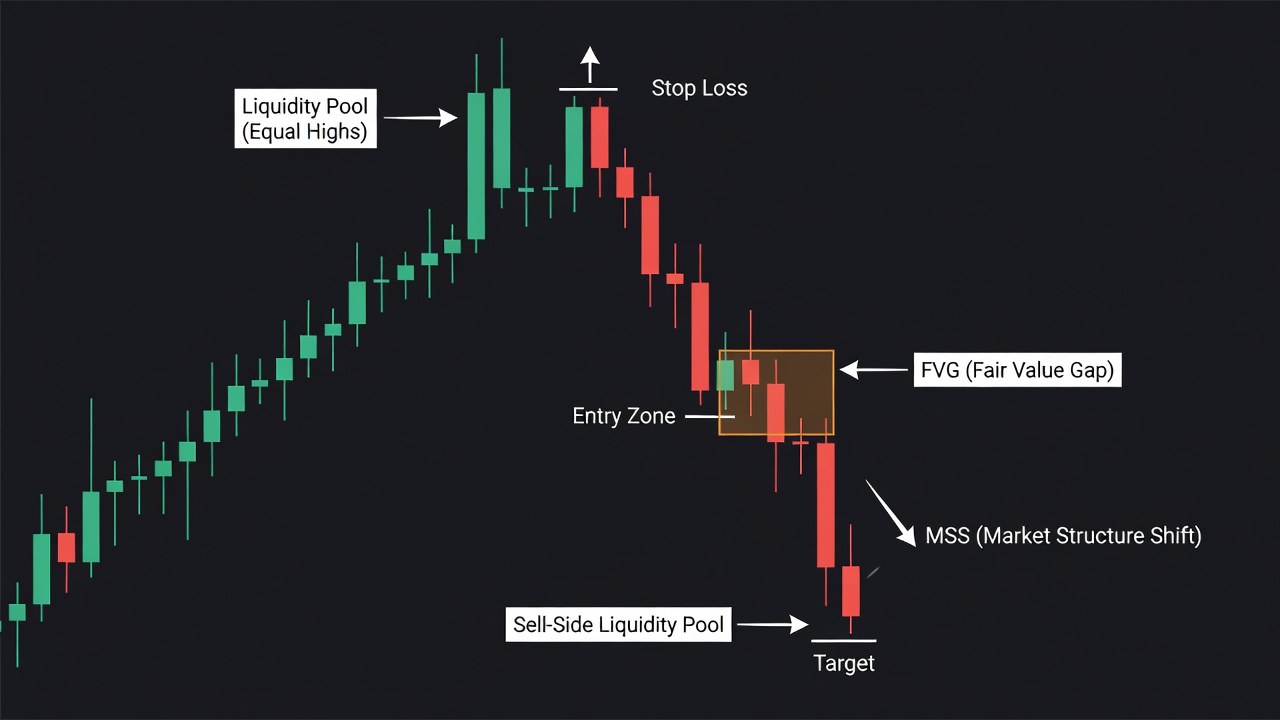
The ICT Market Structure Shift (MSS) and Fair Value Gap (FVG) strategy is a price-action-based trading methodology developed by Michael J. Huddleston. It identifies points of institutional trend reversal by tracking where smart money sweeps retail liquidity and rapidly shifts market direction. An MSS occurs when a key swing high or low is broken with aggressive displacement, signaling a change in near-term order flow, while an FVG is a three-candle price imbalance that marks the exact zone where smart money left behind unfilled orders during that aggressive move.
Why This Edge Works
The USD/JPY currency pair is highly sensitive to the yield differential between the Federal Reserve and the BOJ, making it a prime target for sudden, massive capital shifts. When the BOJ threatens to intervene, or actively dumps billions of dollars to strengthen the Yen, retail traders panic and place stop-losses at obvious technical levels. Market makers exploit this herd behavior by driving price past these liquidity pools (liquidity sweeps) to fill massive institutional sell orders. Once these orders are filled, the market moves away violently, creating an imbalance or Fair Value Gap. Retail traders who missed the move get trapped, and as the market retraces to fill the imbalance, smart money enters again at premium prices, driving the market to the next logical liquidity pool. This structural cycle creates a highly repeatable, non-random edge.
The Setup Rules
- Determine the Higher Timeframe Bias: Identify key daily or 4-hour liquidity pools (previous daily highs/lows, session highs/lows, or psychological round numbers like 155.00, 156.00) where BOJ intervention or major defense of price is expected.
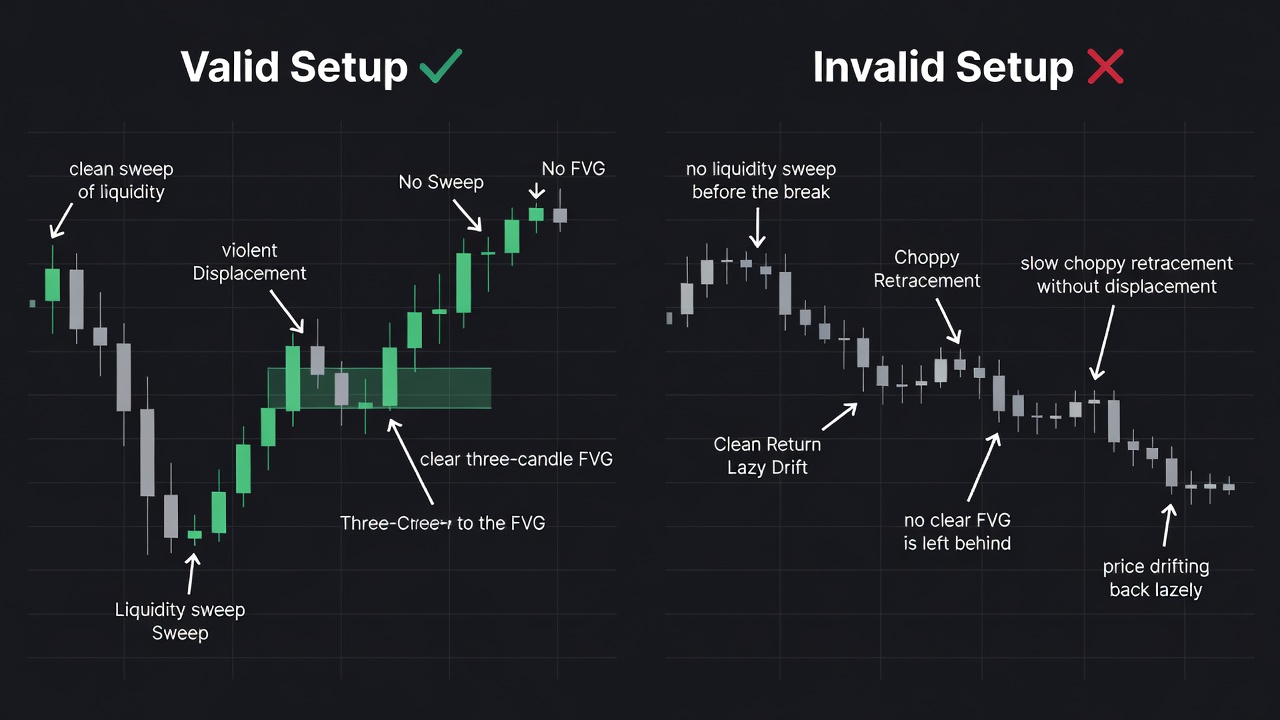
- Wait for the Liquidity Sweep: On the 15-minute execution timeframe, wait for price to aggressively run past one of these key higher timeframe levels to hunt stops. No trade is taken until this sweep occurs.
- Identify the Market Structure Shift (MSS): Look for a violent reversal away from the swept level. This displacement must break the most recent key 15-minute swing low (for shorts) or swing high (for longs). The break must occur with a strong, large-bodied candle closing past the swing point, not just a wick.
- Locate the Fair Value Gap (FVG): Inside the displacement leg that caused the MSS, locate the three-candle imbalance. For a short setup, this is a gap between the low of Candle 1 and the high of Candle 3, with Candle 2 being a large-bodied down candle. This gap is your institutional entry zone.
Entry Trigger
For a short trade, place a limit sell order at the consecutive low of Candle 1 of the FVG as soon as the displacement leg closes and confirms the structural shift. For a long trade, place a limit buy order at the consecutive high of Candle 1 of the FVG once the displacement leg completes and confirms the bullish structural shift.
Stop Loss & Profit Target
Place your stop loss precisely 2-5 pips above the swing high established during the liquidity sweep for a short setup, or 2-5 pips below the swing low of the sweep for a long setup. This ensures your risk remains tight and structural invalidation is clean. Set your profit target at the opposing high-probability liquidity pool, such as the Asian Session low/high or the nearest major 15-minute swing point. This setup regularly yields a highly favorable risk-to-reward ratio of 1:3 to 1:5, as you enter at the absolute premium or discount of the new intraday leg.
Trade Walkthrough: What It Looks Like on a Chart
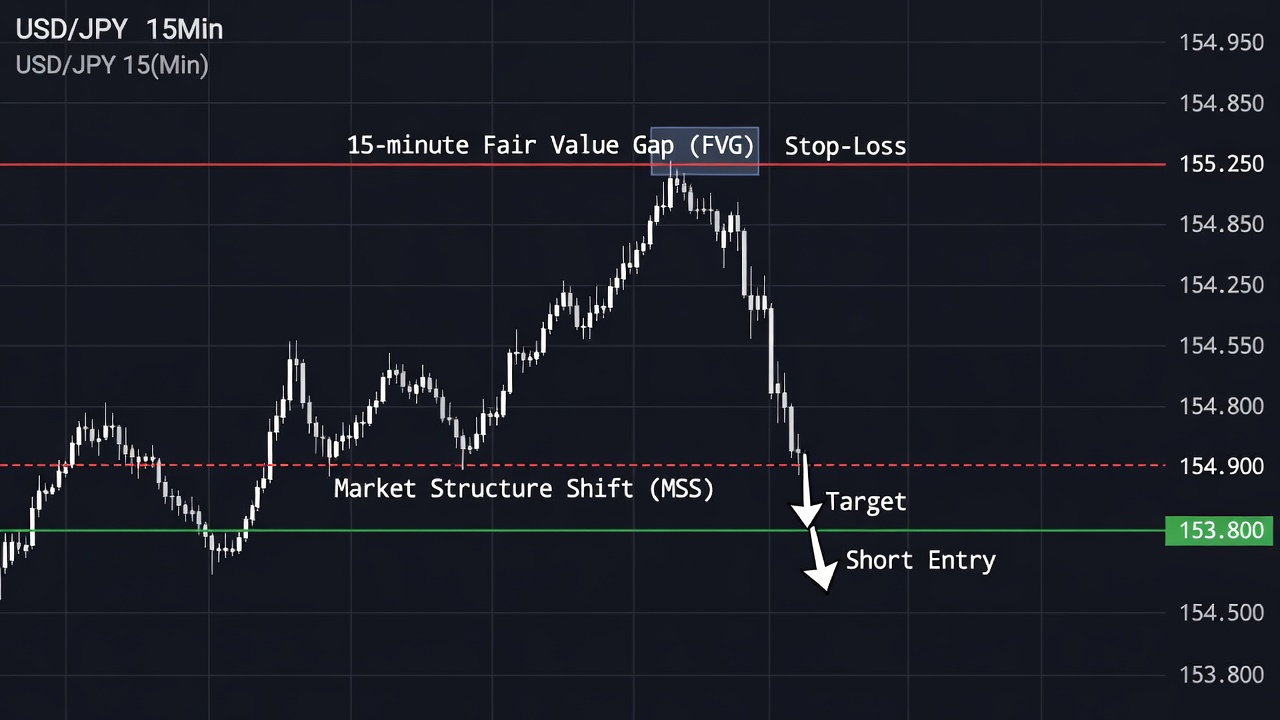
As you can see in the chart above, USD/JPY has been climbing steadily during the London session, approaching a major daily resistance level at 155.200 amidst heavy rumors of BOJ yen-buying intervention. Retail traders are heavily shorting, placing their buy-stop orders just above the 155.200 level, while breakout buyers have pending orders directly above it.
Suddenly, the New York Killzone opens, and price spikes rapidly up to 155.220, executing all buy-stops and trapping breakout buyers in a classic liquidity sweep. Instantly, massive institutional sell orders hit the market, sending USD/JPY crashing downward. The 15-minute candle closes as a massive red candle, cutting through the prior swing low at 154.800 to create a clear Market Structure Shift (MSS).
This aggressive displacement downward creates a prominent three-candle Fair Value Gap between 154.950 (the low of Candle 1) and 154.850 (the high of Candle 3). We immediately place a limit sell order at 154.900, right in the middle of the FVG. Within two candles, price retraces mildly up to 154.920, triggering our short entry, and instantly resumes its downward plunge. Our stop loss is safely tucked at 155.250 (above the manipulation swing high), and we ride the intervention-driven momentum down to the Asian Session low at 153.800, securing a massive 110-pip gain against a risk of only 35 pips, resulting in a highly profitable 3.1R trade.
Common Mistakes to Avoid
- Trading without a Liquidity Sweep: Entering a trade on an MSS and FVG when price has simply drifted sideways without sweeping a major higher-timeframe liquidity level first. This results in getting stopped out as the market hunts the actual liquidity pool.
- Chasing Slow displacement: Entering setups where the market structure shift occurred via slow, overlapping candles rather than a rapid, high-momentum displacement leg. If there is no displacement, there is no institutional backing.
- Ignoring High-Impact BOJ News Releases: Placing limit orders directly inside an FVG minutes before an official BOJ policy rate decision or press conference, where extreme slippage can bypass your stop loss.
- Placing Stops Inside the FVG: Setting stop losses too tight, such as inside the FVG itself, which gets easily triggered by minor market-maker testing before the actual distribution phase begins.
Quick Reference Checklist
- Has price swept a key Daily, 4-Hour, or Session high/low? (Yes/No)
- Did the market shift structure (MSS) on the 15-minute or 5-minute chart with clear displacement? (Yes/No)
- Is there a visible three-candle Fair Value Gap (FVG) left behind in the displacement leg? (Yes/No)
- Is your stop loss placed safely beyond the invalidation level of the liquidity sweep high/low? (Yes/No)
- Does the distance to the target liquidity pool offer at least a 1:3 risk-to-reward ratio? (Yes/No)
🎯 Get High-Probability Trade Setups — Free
The Big Dipper Dashboard delivers curated trade ideas straight to your screen every morning. Know what to watch before the opening bell.

📈 Want More? Join Our Free Trading Community
- Trading Strategy Guides Telegram — daily strategy tips and market insights
- Find Better Trades Telegram — free trade signals delivered to your phone
- Find Better Trades on YouTube — live trade breakdowns and tutorials