Complete Guide to the Pin Bar Reversal Strategy

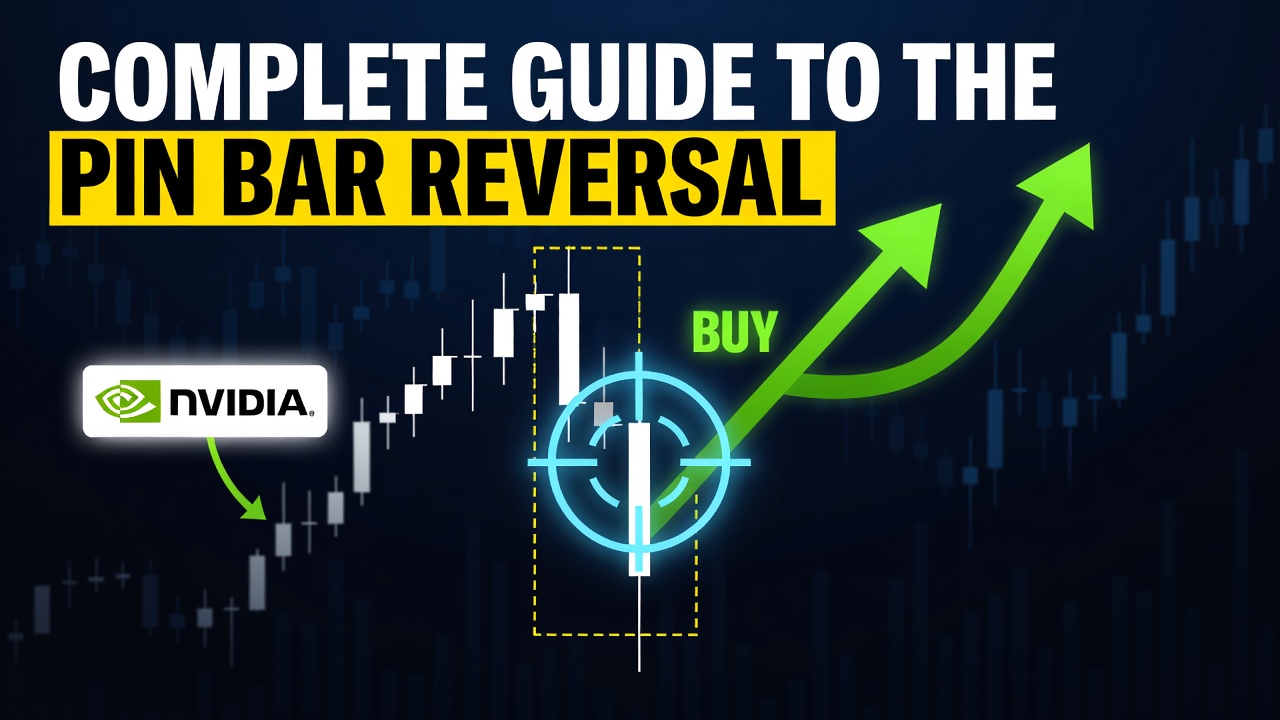
The pin bar reversal strategy is a high-probability price action trading method that identifies sharp, immediate market rejections at key structural price levels. This single-candle candlestick pattern reveals an aggressive shift in momentum where one side of the market completely overwhelms the other within a single session. Professional traders use this setup across all liquid asset classes to spot high-reward entry points right as a correction ends and the dominant trend resumes.
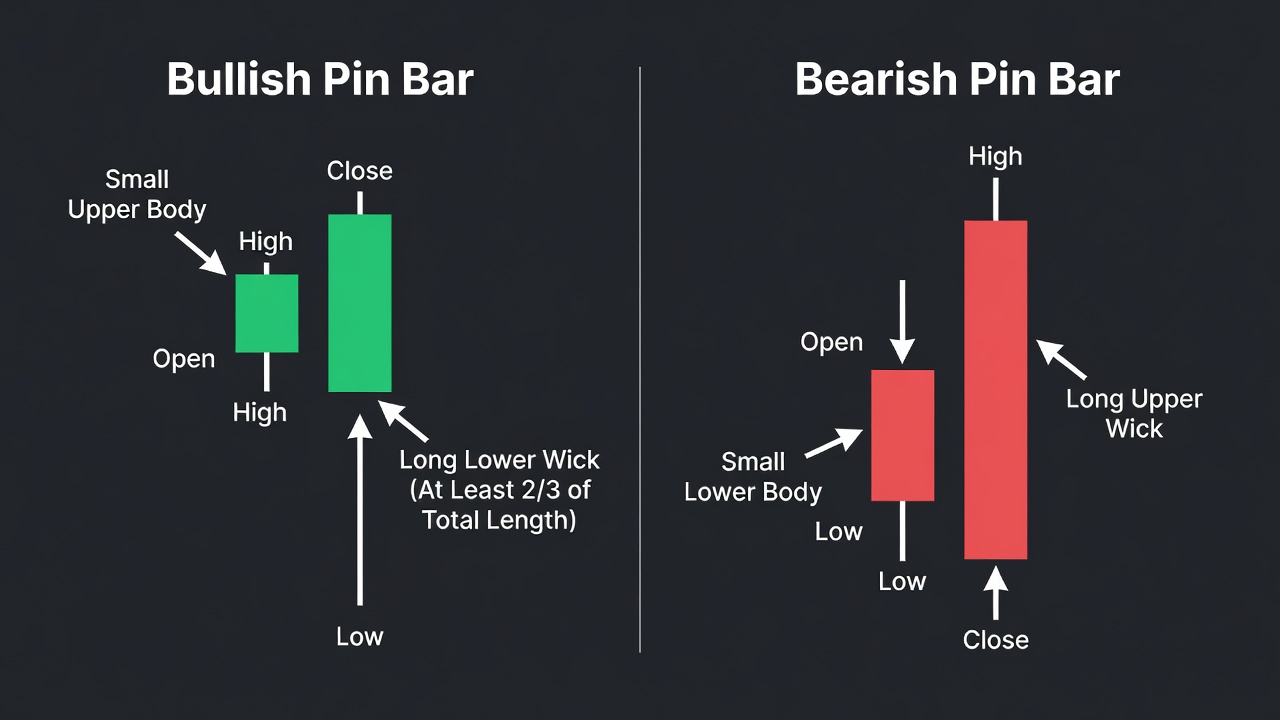
- The pin bar is defined by a long nose (wick) that must make up at least two-thirds of the total candle length, indicating a massive intra-session rejection of price.
- This setup must print at an established support or resistance level to be considered a valid, tradable signal; random pin bars in the middle of trading ranges should be ignored.
- Standard entry triggers include a break of the pin bar nose or a limit order set at the 50% retracement level of the entire candle’s range.
- Stop losses are systematically placed just beyond the extreme tip of the pin bar’s wick to ensure a strictly defined, invalidation-based risk profile.
What Is the Pin Bar Reversal?
The pin bar reversal is a single-session candlestick pattern that represents a sharp, sudden rejection of higher or lower prices. Originally popularized by legendary price action traders, the term “pin bar” is shorthand for “Pinocchio bar” because its long wick (or nose) lies about where the market is actually going. When price spikes into a level only to snap back quickly and close near its open, it leaves behind a distinct footprint of institutional exhaustion. Traders watch this pattern closely because it visually displays the exact moment where the prevailing trend has run out of gas and smart money has stepped in to reverse the direction. It is not just a chart pattern; it is a real-time window into institutional order flow.
The Market Psychology Behind Pin Bar Reversals
The psychology of a pin bar is rooted in trapped traders and sudden institutional liquidity sweeps. In a bullish pin bar, for example, the session begins with sellers aggressively pushing the market lower, breaking past visible support levels to create the illusion of a sustained breakout. This drop triggers sell-stop orders and coaxes breakout traders into short positions. Once those sell orders are activated, large institutional buyers step into the market with massive buy orders, capitalizing on the highly concentrated sell-side liquidity. They rapidly absorb all selling pressure and drive prices back up to the top of the session’s range. The trapped breakout traders are immediately placed in a losing position and are forced to buy back their shorts, fueling the upward reversal as the candle closes near its high.
How to Identify the Pin Bar Reversal on a Chart
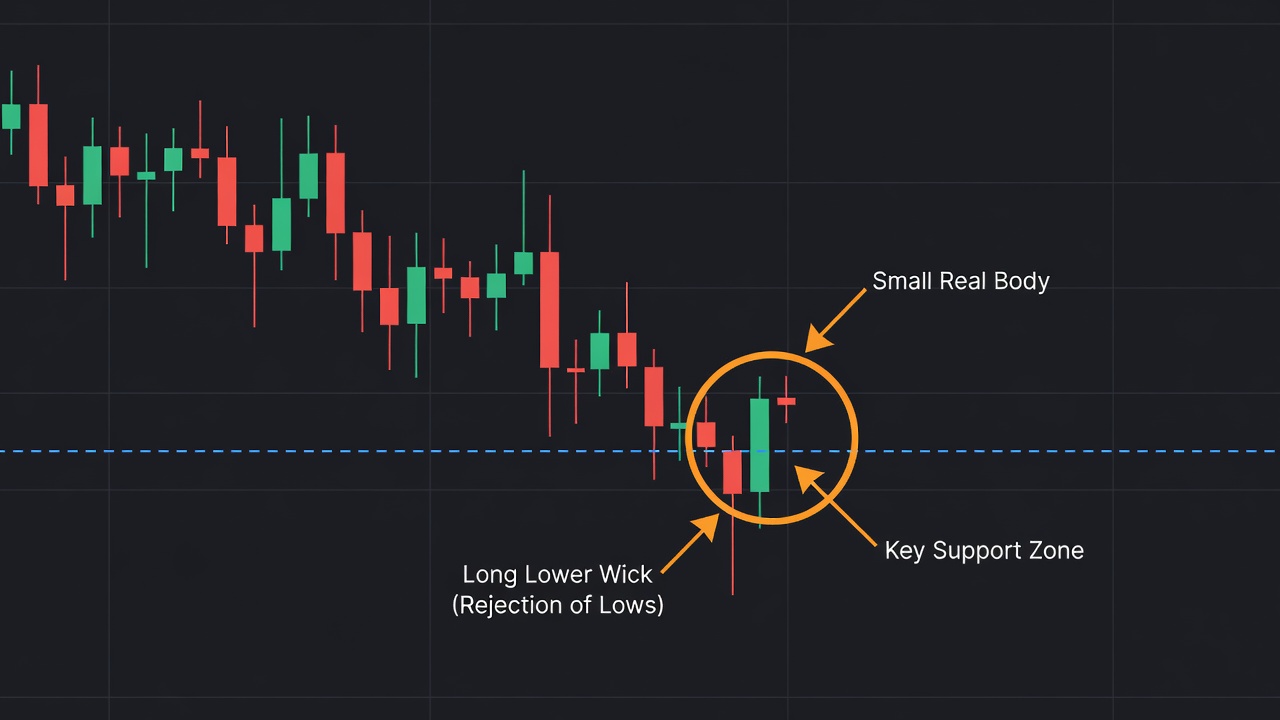
To identify a valid pin bar reversal, you must look for a highly disproportionate relationship between the candle’s wick and its real body. Most candles on your chart will have balanced bodies and wicks; a pin bar stands out immediately because it looks completely lopsided. There are three key visual components you must look for to confirm a pin bar’s structural validity.
The Long Wick (The Nose)
The wick of the candlestick is the most critical element. It must be at least two-thirds (67%) of the entire length of the candlestick from high to low. This long shadow represents the rejected price territory where the market tried to go but was aggressively pushed back.
The Real Body
The real body of the pin bar represents the area between the open and the close. It must be exceptionally small and situated entirely at one end of the candlestick, close to the opposite end of the long wick. The color of the body is secondary to its size and position, though a green body on a bullish pin bar offers slightly stronger confluence.
The Opposite Wick (The Tail)
The side opposite the long rejecting wick should have little to no shadow. If there is a wick on the opposite side, it must be negligible. A large wick on both ends of a candle indicates market indecision (a spinning top or doji), not the decisive rejection required for a pin bar.
The Exact Pin Bar Reversal Setup Criteria
A highly profitable pin bar reversal trade must meet a strict set of rule-based conditions before you risk any capital. You must avoid trading every pin bar you see and instead wait for these specific alignment criteria:
- Asset Liquidity: Only trade this pattern on highly liquid instruments (major currency pairs, large-cap equities, or high-volume stock indices) where order flow is smooth.
- Timeframe Selection: Stick to the 1-hour, 4-hour, and daily timeframes. Lower timeframes produce excessive market noise and false breakouts.
- Market Structure: The pin bar must align with the dominant higher-timeframe trend or print directly at a well-established swing high or swing low.
- Wick Ratio: The rejecting wick must be at least twice the length of the real candle body.
- Location Confluence: The long wick must protrude cleanly through a key technical level, such as a horizontal support/resistance line, a dynamic moving average, or a Fibonacci retracement zone.
How Do You Trade the Pin Bar Reversal? (Entry, Stop Loss, Target)
Trading the pin bar reversal successfully requires a systematic approach to entry, risk definition, and trade management. You should never guess or enter early; instead, use one of the two standard mechanical entry protocols.
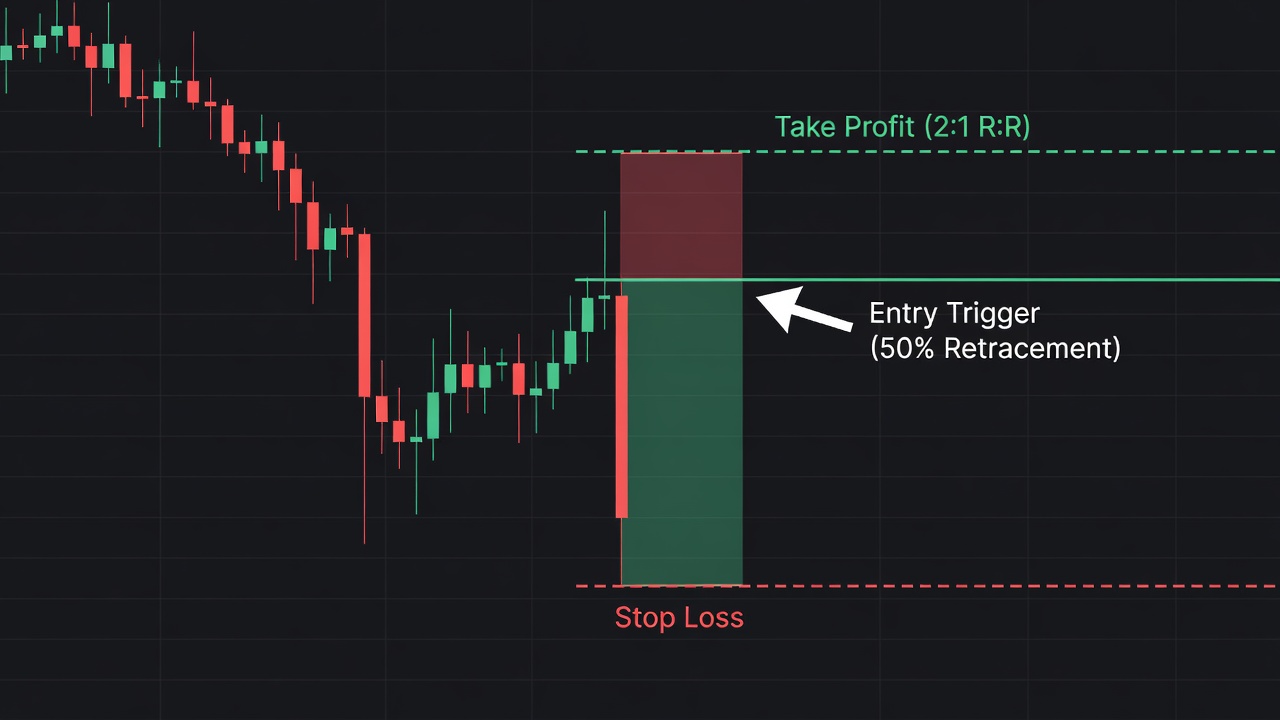
The first entry method is the Market On-Close Entry. As soon as the pin bar candle closes, you immediately enter a market order. This ensures you do not miss the move if the market reverses rapidly. The second, more refined approach is the 50% Limit Entry. You place a limit order exactly at the midpoint of the pin bar’s entire range (from high to low). This entry method significantly improves your risk-to-reward ratio, though it carries the risk of the market running without filling your order.
Your stop loss placement is non-negotiable: place it 1 ATR (Average True Range) beyond the extreme tip of the pin bar’s long wick. This buffer prevents you from getting stopped out by minor market noise or retests before the actual move begins. For your profit target, look for the next major structural swing high or low. Aim for a minimum risk-to-reward ratio of 2:1. If your stop loss requires 50 pips of risk, your target must be located at least 100 pips away from your entry point to ensure long-term mathematical expectancy.
Pin Bar Reversal Trade Example: Step-by-Step
Let us analyze a step-by-step hypothetical trade on the Daily EUR/USD chart to see how this strategy functions in real market conditions. The market has been in a sustained primary uptrend over the past three months, but has recently undergone a healthy two-week corrective pullback. This correction brings the price down to test a major horizontal support level at 1.0800, which also aligns perfectly with the rising 50-day Exponential Moving Average (EMA).
On the test of this support zone, a massive bullish pin bar prints. The candle has a total range of 120 pips, with a tiny real body at the very top of the range and a long lower wick measuring 90 pips (well over the required 67% ratio). This structure demonstrates that sellers tried to push the price deep below 1.0800, but were met with a wave of institutional buying that drove the session close back to 1.0820.
As you can see in the annotated chart above, we place a buy-limit order at the 50% retracement level of the pin bar at 1.0760. Our stop loss is placed 15 pips below the pin bar’s low of 1.0700, establishing our risk at 75 pips. We target the previous major swing high at 1.0960. The market dips slightly on the next session, filling our 50% limit order perfectly, before launching into a strong upward trend. The price reaches our profit target of 1.0960 within four days, resulting in a clean 200-pip gain and a highly profitable 2.6:1 risk-to-reward ratio.
Pin Bar Reversal Across Different Timeframes
The reliability and performance of the pin bar reversal strategy scale dramatically with the timeframe you trade. While the pattern forms on all charts, its structural meaning changes based on the duration of the candle.
On the daily and weekly charts, pin bars are highly reliable macro signals. A weekly pin bar represents five days of massive capital allocation and rejection, making it a powerful trend-turning signal that swing traders can build entire campaigns around. The 4-hour chart is widely considered the sweet spot for active traders, offering a perfect balance between high-quality institutional signals and a steady frequency of setups.
Conversely, on the 5-minute or 15-minute charts, pin bars are frequently visual traps. Intraday price action is heavily influenced by algorithm noise, minor news releases, and localized order flow imbalances. A pin bar on a 5-minute chart does not represent a major institutional shift; it is often just a temporary liquidity spike that will be quickly overrun. If you choose to trade intraday pin bars, you must demand much stricter structural confluence to offset the lower baseline reliability of the timeframe.
Pin Bar vs. Doji: Key Differences
Traders often confuse the pin bar with the classic doji candlestick, but they represent entirely different market dynamics.
The Pin Bar Reversal
A pin bar represents a highly decisive rejection of price. The buyers or sellers pushed price aggressively in one direction, but the opposing force took complete control and shoved price all the way back to the opposite end of the session. It features a small body at one extreme end of the candle and a single long wick, signaling a high-probability reversal.
The Doji Candlestick
A doji represents complete market equilibrium and indecision. It opens and closes at virtually the exact same price, leaving a small real body centered between upper and lower wicks of roughly equal length. No side has won the battle; the market is simply waiting for a catalyst, making the doji a signal to pause rather than an active trigger to trade a reversal.
Best Confluences to Stack With Pin Bar Reversals
To maximize the win rate of your pin bar reversal strategy, you must only trade setups that feature multiple technical layers of support or resistance. Stacking these factors creates an institutional barrier that price is highly unlikely to break.
- Major Horizontal S/R Levels: Pin bars that reject historical key swing highs or lows carry a significantly higher win rate because these areas have pre-existing resting order blocks.
- 50-day and 200-day EMAs: In a trending market, these moving averages act as dynamic support or resistance. A pin bar rejecting these averages signals trend continuation.
- Fibonacci Retracement Levels: A pin bar whose wick spikes through the 50% or 61.8% retracement level and closes above it confirms that the market’s correction has exhausted itself.
- High Volume Confirmation: A spike in trading volume during the formation of the pin bar confirms that large-scale institutional players participated in the rejection.
Common Pin Bar Reversal Mistakes to Avoid
- Trading pin bars in tight consolidation ranges: When the market is moving sideways, pin bars are meaningless noise and will quickly trap you in choppy price action.
- Placing stops exactly at the tip of the wick: Market makers often run price just past the high or low of a major candlestick to sweep liquidity before moving in the intended direction.
- Ignoring the broader market trend: Taking counter-trend pin bars without significant macro structural backing is a quick way to experience consecutive losses.
- Entering on ugly, low-proportion wicks: If the wick does not comprise at least two-thirds of the candle, it is not a pin bar; do not force a setup that is not there.
- Chasing the trade after a massive breakout: If the pin bar closes and the next candle immediately surges toward your target, do not chase it; wait for a pullback or move on to the next setup.
Pin Bar Reversal Checklist
- Is the pin bar printing on a 1-hour, 4-hour, or daily timeframe? (Yes/No)
- Does the rejecting wick make up at least 67% of the total candlestick length? (Yes/No)
- Is the real body situated entirely at one extreme end of the candle? (Yes/No)
- Is the pin bar printing directly at a major horizontal, dynamic, or Fibonacci level? (Yes/No)
- Is there a clear, unobstructed path to your profit target that offers at least a 2:1 risk-to-reward ratio? (Yes/No)
Frequently Asked Questions About Pin Bar Reversals
What is a pin bar reversal?
A pin bar reversal is a single-candle price action pattern characterized by a long wick and a tiny real body. It signifies that the market aggressively rejected a specific price zone during the session, indicating that a strong reversal is likely to follow.
How do you trade a pin bar reversal?
You can trade a pin bar reversal by entering immediately on the candle close or by placing a limit order at the 50% retracement level of the candle. Your stop loss should always be placed slightly beyond the tip of the long rejecting wick, targeting a major key level that offers a minimum 2:1 risk-to-reward ratio.
Which timeframe is best for pin bars?
The daily and 4-hour timeframes are the absolute best for trading pin bars because they filter out the intraday noise found on lower charts. Higher timeframes represent significant, multi-hour institutional capital shifts, which makes the resulting signals far more reliable.
What is the difference between a pin bar and a hammer?
A hammer is a specific type of bullish pin bar that occurs exclusively at the bottom of a downtrend. While all hammers are structurally bullish pin bars, not all pin bars are hammers, as pin bars can also appear at the top of uptrends (referred to as shooting stars) or as trend continuation signals.
🎯 Get High-Probability Trade Setups — Free
The Big Dipper Dashboard delivers curated trade ideas straight to your screen every morning. Know what to watch before the opening bell.

📈 Want More? Join Our Free Trading Community
- Trading Strategy Guides Telegram — daily strategy tips and market insights
- Find Better Trades Telegram — free trade signals delivered to your phone
- Find Better Trades on YouTube — live trade breakdowns and tutorials