Ultimate Guide to Trading Market Structure Shifts in Major Indices


Major financial institutions are sounding the alarm on a monumental transition in the macro environment, warning that the long-standing post-2008 regime of cheap money and predictable index trends is fracturing. For retail traders, passive index-holding is no longer a safe bet. To capture the massive swings inside index ETFs like SPY and QQQ, you need to spot institutional footprint changes before they dominate the daily chart. The Smart Money Concepts (SMC) Market Structure Shift (MSS) is the sharpest tool for this job, letting you identify the exact moment institutions stop buying dips and start distributing positions to unsuspecting retail buyers.
What Is Market Structure Shift?
A Market Structure Shift (MSS) is an aggressive, displacement-fueled price movement that breaks the existing trend’s structural order, signaling a change in institutional flow. Unlike a simple minor pullback, a true MSS marks the point where the dominant market participants switch from buying swing lows to aggressively selling them, or vice versa. This concept, popularized within Smart Money Concepts (SMC) and closely related to Michael J. Huddleston’s Inner Circle Trader (ICT) teachings, represents the transition from a bullish order flow to a bearish order flow (or bearish to bullish) before the wider market realizes a reversal has occurred.
Why This Edge Works
Markets do not turn on a dime without leaving clues. The mechanics of the market structure shift rely on liquidity distribution. In a bullish trend, major institutions are forced to accumulate massive buy positions, which requires driving the market higher. Once they decide to reverse their bias due to shifting macroeconomic conditions or technical targets, they cannot simply sell their entire block at once without crashing the price. Instead, they engineer a liquidity sweep to bait retail traders into buying breakout attempts at key highs. Once retail buy-stop liquidity is triggered, the institutions fill their massive sell orders against those buyers. The resulting downward flush is violent because there is no institutional support beneath the market. This creates a displacement leg that shatters the previous swing low, leaving behind structural imbalances that serve as our entry trigger.
The Setup Rules
To successfully trade an MSS on major index ETFs like AMEX:SPY or NASDAQ:QQQ, you must follow these rigid structural rules:
- Determine High-Timeframe Bias: Analyze the 1-hour or 4-hour chart to identify key daily liquidity pools, swing highs, or major resistance levels where institutional distribution is likely to occur.
- Wait for Liquidity Sweep: On the execution timeframe (typically the 5-minute or 15-minute chart), the price must sweep above a prominent swing high (or below a swing low for bullish setups) to capture stop-loss orders.
- Identify the Key Swing Low: Locate the last valid swing low that directly led to the highest high of the sweep. This is your Market Structure Shift line.
- Confirm Displacement: The price must break below this swing low with a strong, large-bodied candle. A mere wick below the line is not enough; we require a candle body close below the level to confirm a true MSS.
- Locate the Fair Value Gap (FVG): Within the aggressive displacement leg that caused the break, there must be a valid three-candle imbalance where the first candle’s low and the third candle’s high do not overlap.
Entry Trigger
Once the market structure shift is confirmed by a candle body closing below the key swing low, place a limit entry order at the open boundary of the newly formed Fair Value Gap (FVG) within the displacement leg, waiting for a corrective pullback to mitigate the imbalance.
Stop Loss & Profit Target
Your stop loss must be placed immediately above the high of the liquidity sweep candle that triggered the reversal sequence. Do not compromise on this placement; if the price breaches that high, the bearish narrative is invalidated. Your profit targets should be mapped to opposing pools of sell-side liquidity, such as previous daily swing lows or key structural support zones. A typical setup of this nature easily yields a 1:3 or 1:4 risk-to-reward ratio, ensuring you maintain a highly positive expectancy even with a moderate win rate.
Trade Walkthrough: What It Looks Like on a Chart
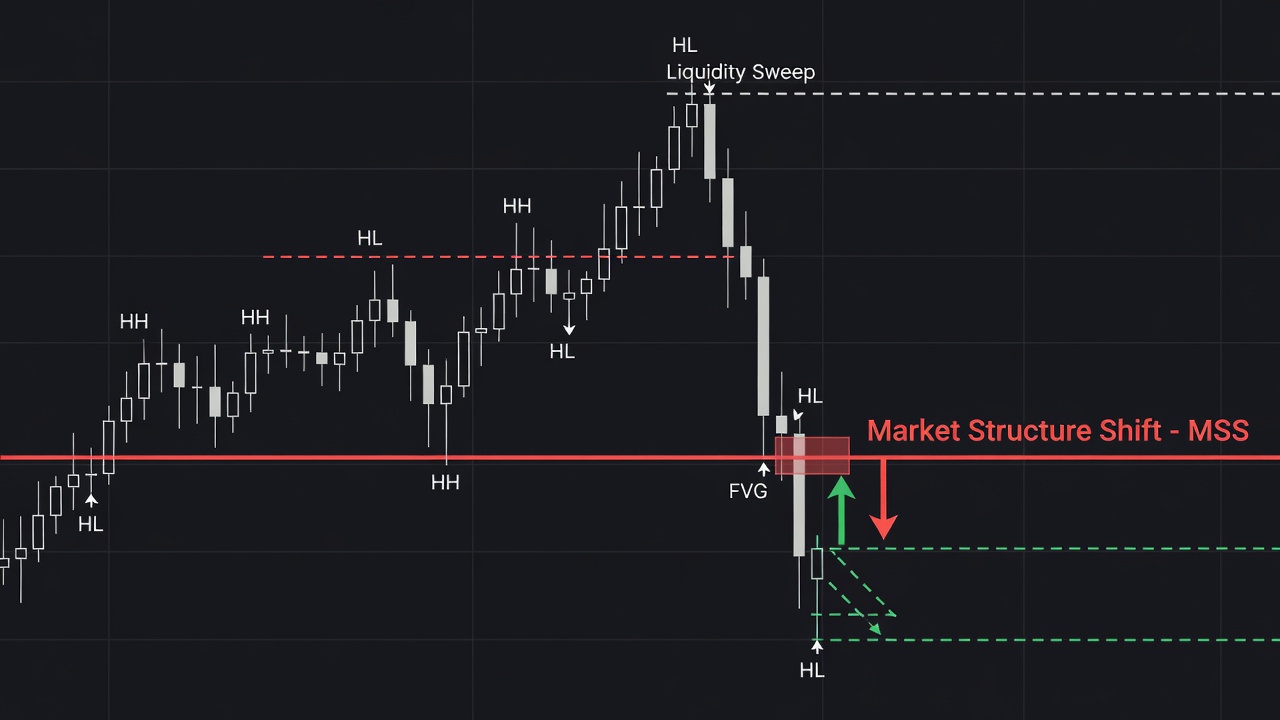
Let us walk through a high-probability trade example using AMEX:SPY on the 15-minute intraday chart during a highly volatile session. The index has been in a steady uptrend throughout the morning, making consecutive higher highs and higher lows. As you can see in the chart above, SPY pushes up to sweep the previous day’s high at $512.50. This rapid move triggers buy-stop orders from breakout traders and short-sellers who are forced to cover.
Immediately after clearing the high, a massive bearish candle closes at $511.20, shifting market structure by breaking below the morning’s key swing low at $511.50. This displacement leg is characterized by high volume and consecutive red candles, leaving behind a clear 15-minute Fair Value Gap between the low of the sweep candle and the high of the third candle in the sequence. We place a limit sell order at the top of this FVG at $511.60. Our stop loss is set at $512.65, just above the sweep high. The price retraces briefly, tapping into our FVG to fill our short position, before dropping aggressively toward our targets at the prior session’s swing low of $508.50. This trade achieves a clean 3R return as the market structure shifts in alignment with institutional distribution.
Common Mistakes to Avoid
- Trading Without a Liquidity Sweep: Entering a trade on a break of a swing low without a prior sweep of an opposing high. This often results in getting caught in a complex pullback rather than a structural reversal.
- Accepting Wick Breaks: Confirming an MSS based on a candle wick breaching the swing low instead of demanding a full candle body close. Wicks signify rejection, not structural shifts.
- Chasing the Displacement Leg: Panic-selling at the bottom of the aggressive drop out of fear of missing the move. Always wait for the price to pull back to the premium Fair Value Gap for a disciplined entry.
- Ignoring High-Timeframe Context: Attempting to trade 15-minute structure shifts that run directly into major daily or weekly support zones, which can easily override short-term bearish shifts.
Quick Reference Checklist
- Has the price swept a major high-timeframe liquidity level or session high? (Yes/No)
- Has a key swing low been identified on the execution timeframe? (Yes/No)
- Did a candle body close decisively below that swing low to confirm the shift? (Yes/No)
- Is there a visible Fair Value Gap (FVG) within the displacement leg? (Yes/No)
- Is the stop loss placed safely above the swing high of the sweep? (Yes/No)
🎯 Get High-Probability Trade Setups — Free
The Big Dipper Dashboard delivers curated trade ideas straight to your screen every morning. Know what to watch before the opening bell.

📈 Want More? Join Our Free Trading Community
- Trading Strategy Guides Telegram — daily strategy tips and market insights
- Find Better Trades Telegram — free trade signals delivered to your phone
- Find Better Trades on YouTube — live trade breakdowns and tutorials