Complete Guide to the Bullish and Bearish Engulfing Candle Strategy

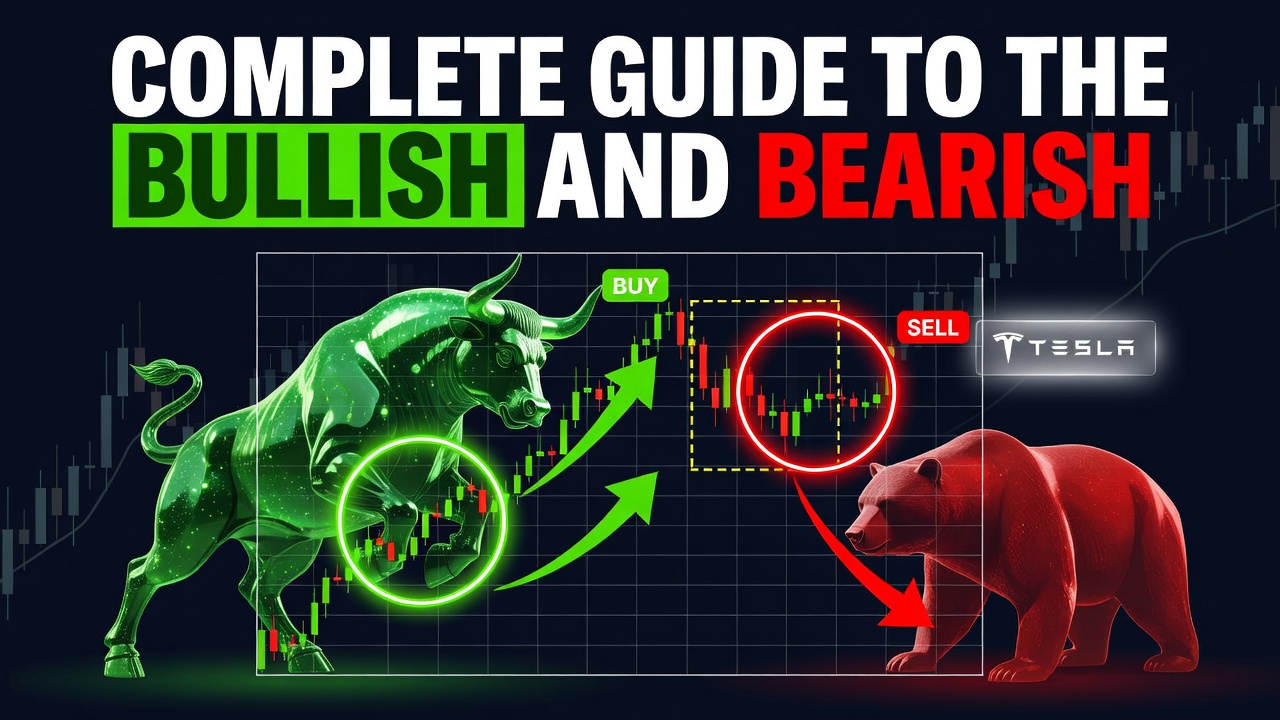
The bullish and bearish engulfing candle strategy is a powerful price action trading method designed to identify high-probability trend reversals at key market inflection points. By spotting a large candlestick that completely visualizes a total shift in momentum by swallowing the body of the preceding candle, traders can pinpoint exactly when retail exhaustion meets institutional order flow. This guide provides a definitive blueprint for mastering this pattern across any liquid financial market.
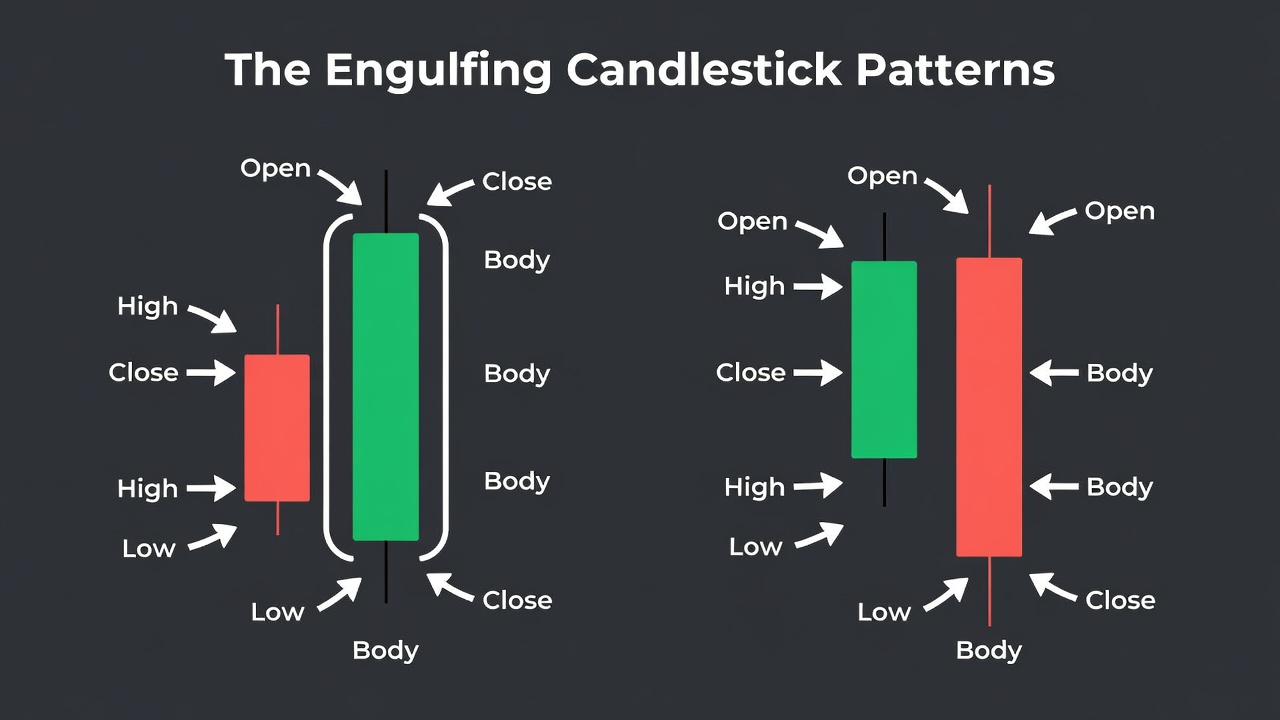
- The engulfing pattern requires the second candle’s body to completely overlap or swallow the real body of the first candle.
- Volume expansion on the engulfing candle significantly increases the probability of a genuine trend reversal.
- This strategy must only be traded at major swing highs or lows, or when aligning with key support and resistance levels.
- Stop losses must always be anchored beyond the extreme wick of the engulfing candle to protect against market noise.
What Is the Engulfing Candle Strategy?
The engulfing candle strategy is a reversal trading methodology based on a two-candle price action pattern that signals a complete shift in market control. First documented by Japanese rice traders centuries ago as part of candlestick charting analysis, this pattern represents a swift and violent transition from buyers to sellers, or vice versa. It appears strictly within trending markets or at key structural boundaries, signaling to astute market participants that the prevailing trend has run out of gas and an immediate correction or reversal is underway. Because it is highly visual and easy to identify, it serves as a cornerstone for both retail traders and institutional desks looking to capture new swing legs.
The Market Psychology Behind Engulfing Candles
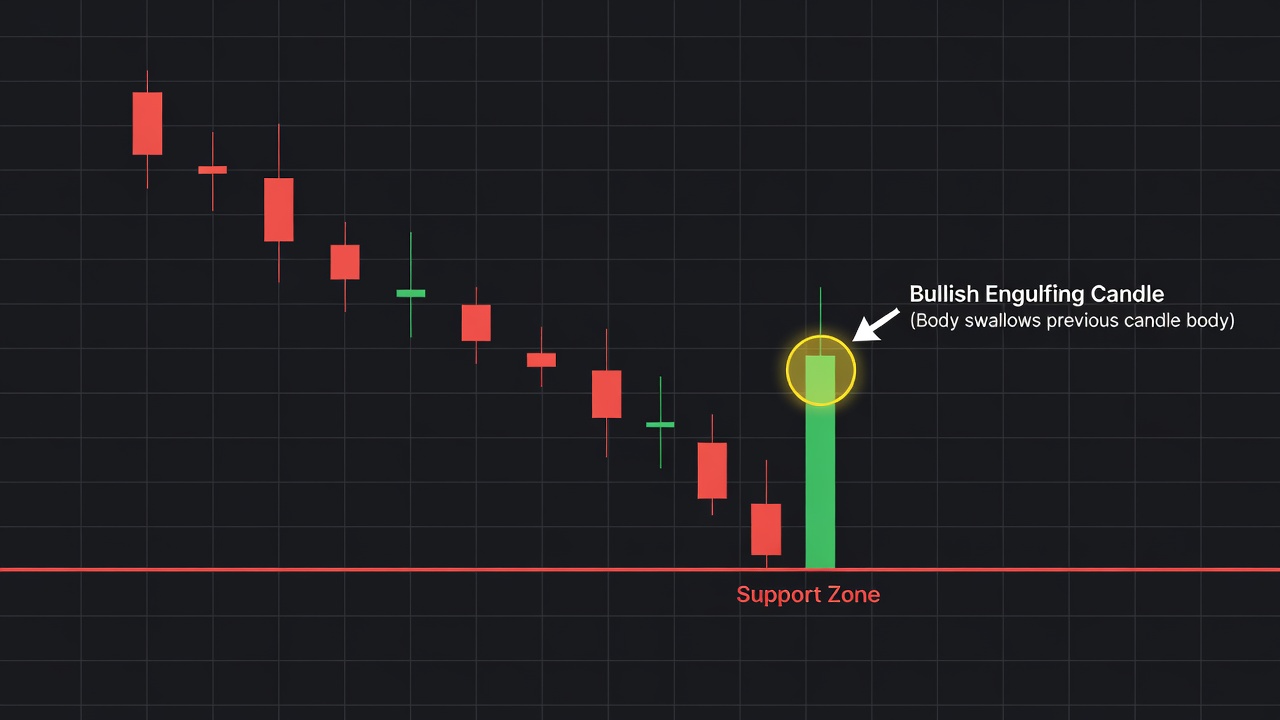
The power of the engulfing pattern lies in its representation of sudden, overwhelming order flow that completely wipes out the opposing side of the market. In a bullish engulfing scenario, the market opens with a continuation of the prior downtrend, pushing prices lower to trap late-joining short sellers. Mid-session, institutional buying power enters the market, driving prices aggressively upward and forcing those trapped shorts to cover their positions. The sheer volume of buy orders completely overrides the remaining sellers, causing the candle to close above the previous day’s open. This visual ‘swallowing’ of the previous candle’s body shows that sellers are completely trapped, exhausted, and no longer capable of defending their levels, paving the way for an aggressive upward run.
How to Identify the Engulfing Candle on a Chart
To identify a valid engulfing candlestick pattern, you must look for specific structural relationship guidelines between two consecutive candles. Do not make the mistake of trading every large candle you see; instead, verify these visual rules to ensure the pattern carries statistical validity.
The First Candle (The Setup)
The first candle must align with the current micro-trend. In a bullish engulfing setup, this is a bearish (red/black) candle. In a bearish engulfing setup, this is a bullish (green/white) candle. The physical size of this first candle should ideally be relatively small to medium, indicating that the prevailing trend is starting to lose momentum and consolidate.
The Second Candle (The Engulfing Force)
The second candle must be the opposite color of the first candle. Its real body must completely cover, or engulf, the real body of the first candle. While some textbook definitions require the wicks to be engulfed as well, in real-world trading, it is the real bodies (the open and close prices) that dictate market control. The second candle should close near its high (for bullish setups) or near its low (for bearish setups), showing little to no rejection of the new direction.
Market Context Location
An engulfing candle in the middle of a sideways, choppy range is completely useless and should be ignored. For a bullish engulfing candle to be valid, it must occur at the end of a clear downtrend or at a defined support level. Conversely, a bearish engulfing candle must print at the absolute peak of an uptrend or at a proven resistance level.
The Exact Engulfing Candle Setup Criteria
Every high-probability engulfing setup must meet a strict set of rule-based conditions before you ever risk a single dollar. Do not deviate from this checklist:
- Timeframe: Use the 1-Hour, 4-Hour, or Daily charts; lower timeframes contain too much noise and produce false engulfing signals.
- Trend Context: The market must show an established trend (at least 5-10 prior candles moving in one clear direction) or be testing a major historical key level.
- Anatomy: The body of candle two must completely overlap the body of candle one. The candle two close must be in the top 20% of its range (bullish) or bottom 20% of its range (bearish).
- Volume Confirmation: The volume on the second candle must be noticeably higher than the volume of the preceding 3-5 candles, proving institutional participation.
How Do You Trade the Engulfing Candle? (Entry, Stop Loss, Target)
Trading the engulfing candle successfully requires a disciplined execution strategy with defined parameters for entering, protecting, and exiting the trade. Never guess where to put your orders; let the structure of the pattern dictate your placement.
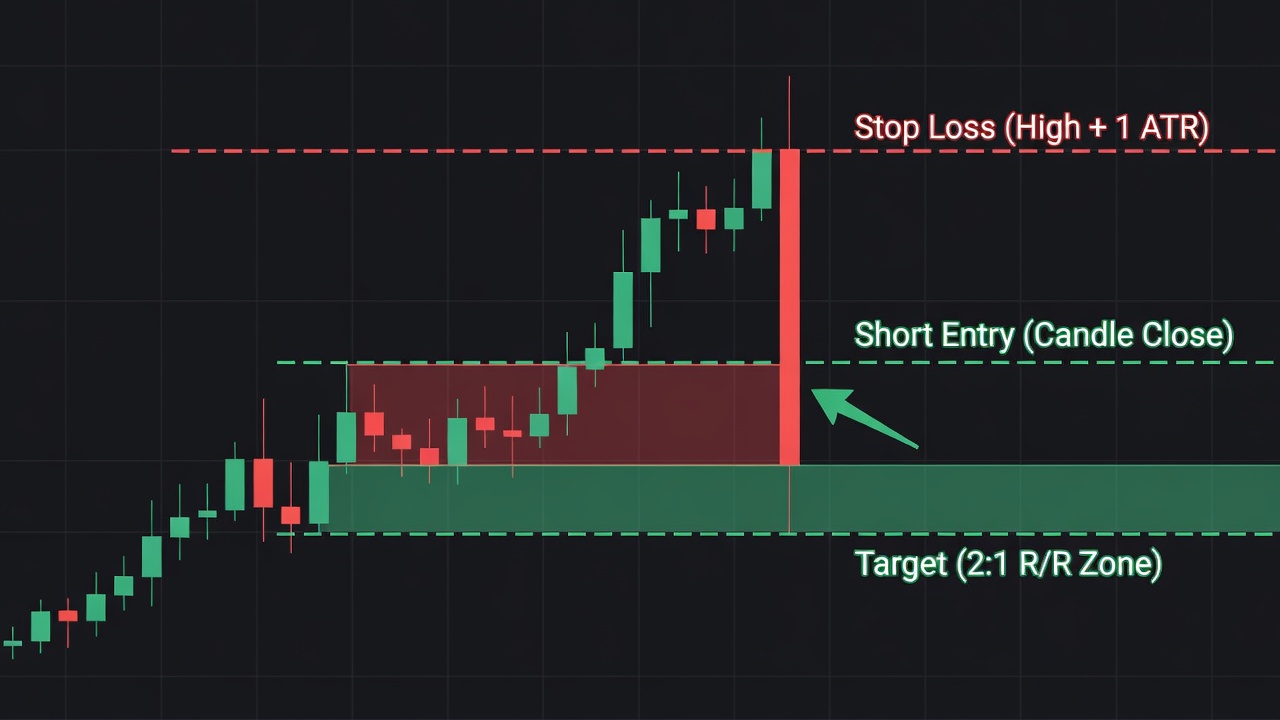
For a bullish engulfing setup, your entry trigger occurs the exact moment the second candle closes. Do not front-run the close, as a late-session reversal can turn an engulfing shape into a weak pin bar. Alternatively, conservative traders can place a buy limit order at the 50% retracement level of the engulfing candle’s body to secure a tighter stop loss and higher risk-to-reward ratio.
Your stop loss must be placed below the lowest point of the entire two-candle pattern. To prevent premature stop-outs caused by market noise, anchor your stop loss exactly 1 Average True Range (ATR) below the pattern’s low. This gives the trade breathing room to breathe and validate.
Your profit target should be set at the next major structural level, such as key horizontal resistance or the most recent swing high. To make the math work over the long run, aim for a minimum risk-to-reward ratio of 2:1. If the nearest key level does not allow for a 2:1 return relative to your stop distance, pass on the trade.
Engulfing Candle Trade Example: Step-by-Step
Let us look at a practical, step-by-step walk-through of how to execute this strategy. Imagine we are monitoring a major currency pair on the 4-Hour timeframe. The market has been in a sustained downtrend for several days, characterized by lower highs and lower lows, pushing price down toward a major daily support level at 1.1200.
As you can see in the annotated chart above, price approaches the 1.1200 level with a series of small, hesitant red candles. This represents selling exhaustion. Suddenly, a massive bullish candle prints, completely swallowing the body of the previous red candle and closing strongly near its high. This confirms a highly valid bullish engulfing pattern. The volume indicator below confirms a surge of 1.5x the average volume, indicating institutional buying presence.
We execute a market buy order at the immediate close of this engulfing candle. The entry price is locked in at 1.1240. We immediately measure the ATR for this timeframe, which is 20 pips. The low of the engulfing pattern is 1.1190. We set our stop loss exactly 20 pips below that low, placing our stop at 1.1170. This represents a total risk of 70 pips. To achieve a clean 2:1 risk-to-reward ratio, we set our take-profit target at 1.1380, which sits just below the next major swing high resistance. Over the next three sessions, the market moves aggressively upward, validating our entry and hitting the target for a highly profitable outcome.
Engulfing Candle Across Different Timeframes
The engulfing pattern’s reliability increases dramatically as you move up to higher timeframes because they represent significantly more capital flow. On the weekly and daily charts, an engulfing pattern represents days of macro-positioning by central banks, hedge funds, and large institutions. These patterns rarely fail and often kickstart multi-week trends. On the 1-Hour and 4-Hour charts, the patterns are excellent for swing trading, capturing medium-term market swings. Avoid trading engulfing candles on timeframes below the 15-minute chart, as high-frequency algorithms and market noise frequently create random engulfing shapes that lack genuine institutional buying or selling power behind them.
Bullish Engulfing vs. Piercing Line: Key Differences
Traders often confuse the bullish engulfing pattern with other multi-candle structures, specifically the piercing line pattern. Understanding the differences is critical for proper market classification.
The Bullish Engulfing Pattern
The bullish engulfing pattern is a two-candle reversal formation where the second green candle’s body completely wraps around and swallows the first red candle’s body. It signals an absolute change in control, showing that buyers have completely dominated the market and obliterated the previous sellers.
The Piercing Line Pattern
The piercing line is a weaker two-candle reversal pattern where the second green candle opens with a gap down but only closes at or above the 50% midpoint of the first red candle’s body. While still bullish, it shows less aggressive buying force than the engulfing pattern, making it a lower-probability signal that requires tighter confirmation before entry.
Best Confluences to Stack With Engulfing Candles
To transform the engulfing pattern from a simple chart shape into an elite, high-probability strategy, you must stack it with technical confluence. Never trade this pattern in isolation. Look for these powerful overlays:
- Major Support or Resistance: An engulfing candle printing exactly on a long-term horizontal key level drastically increases its reversal probability.
- The 50 or 200 EMA: During a strong trend, look for price to pull back to the 50 or 200 Exponential Moving Average and print an engulfing candle in the direction of the macro trend.
- Relative Strength Index (RSI) Divergence: If the RSI displays a bullish divergence while a bullish engulfing candle forms at a swing low, a major trend reversal is highly likely.
- Prior Day High or Low: Watch for price to temporarily sweep the previous day’s high or low, fail, and immediately print an engulfing candle back in the opposite direction. This traps breakout traders.
Common Engulfing Candle Mistakes to Avoid
- Trading the pattern in low-volatility, sideways consolidation markets where candles wrap around each other naturally.
- Entering the trade before the engulfing candle officially closes, only to watch it pull back and close as a continuation pin bar.
- Ignoring the overall market structure and trading counter-trend engulfing setups against powerful macro trends.
- Using an excessively tight stop loss placed directly at the pattern’s low without accounting for market volatility and ATR.
- Failing to look at volume confirmation to ensure there is actual institutional participation backing the move.
Engulfing Candle Checklist
- Is the engulfing pattern forming on a 1-Hour timeframe or higher? (Yes/No)
- Is there an established trend or a clear test of a major key support/resistance level? (Yes/No)
- Does the body of the second candle completely cover the real body of the first candle? (Yes/No)
- Did the second candle close in the extreme 20% of its range, showing strong conviction? (Yes/No)
- Is the volume on the engulfing candle higher than the average volume of the preceding candles? (Yes/No)
- Does the distance to the next major technical level allow for at least a 2:1 risk-to-reward ratio? (Yes/No)
Frequently Asked Questions About Engulfing Candles
Do wicks have to be engulfed for a valid engulfing candle?
No, the wicks do not need to be engulfed for the pattern to be valid. The real body of the second candle must completely swallow the real body of the first candle, as the body represents the true opening and closing consensus of market value.
Is a bullish engulfing pattern reliable in a downtrend?
A bullish engulfing pattern is highly reliable in a downtrend only if it occurs at a major, predetermined support level or a historical swing low. Trading it blindly in the middle of a strong downtrend without structural confluence will lead to frequent losses.
What is the best timeframe to trade the engulfing candle strategy?
The daily and 4-hour timeframes are the most effective for trading the engulfing candle strategy. These higher timeframes filter out intraday market noise and represent significant, highly reliable institutional capital movements.
How do you handle an engulfing candle that is extremely large?
If the engulfing candle is massive, it means the stop loss will be too far away, ruining your risk-to-reward ratio. In this scenario, you should either pass on the trade or use a limit order to enter on a 50% pullback of the engulfing candle’s body.
🎯 Get High-Probability Trade Setups — Free
The Big Dipper Dashboard delivers curated trade ideas straight to your screen every morning. Know what to watch before the opening bell.

📈 Want More? Join Our Free Trading Community
- Trading Strategy Guides Telegram — daily strategy tips and market insights
- Find Better Trades Telegram — free trade signals delivered to your phone
- Find Better Trades on YouTube — live trade breakdowns and tutorials