Ultimate Guide to the Bullish and Bearish Engulfing Candle Strategy

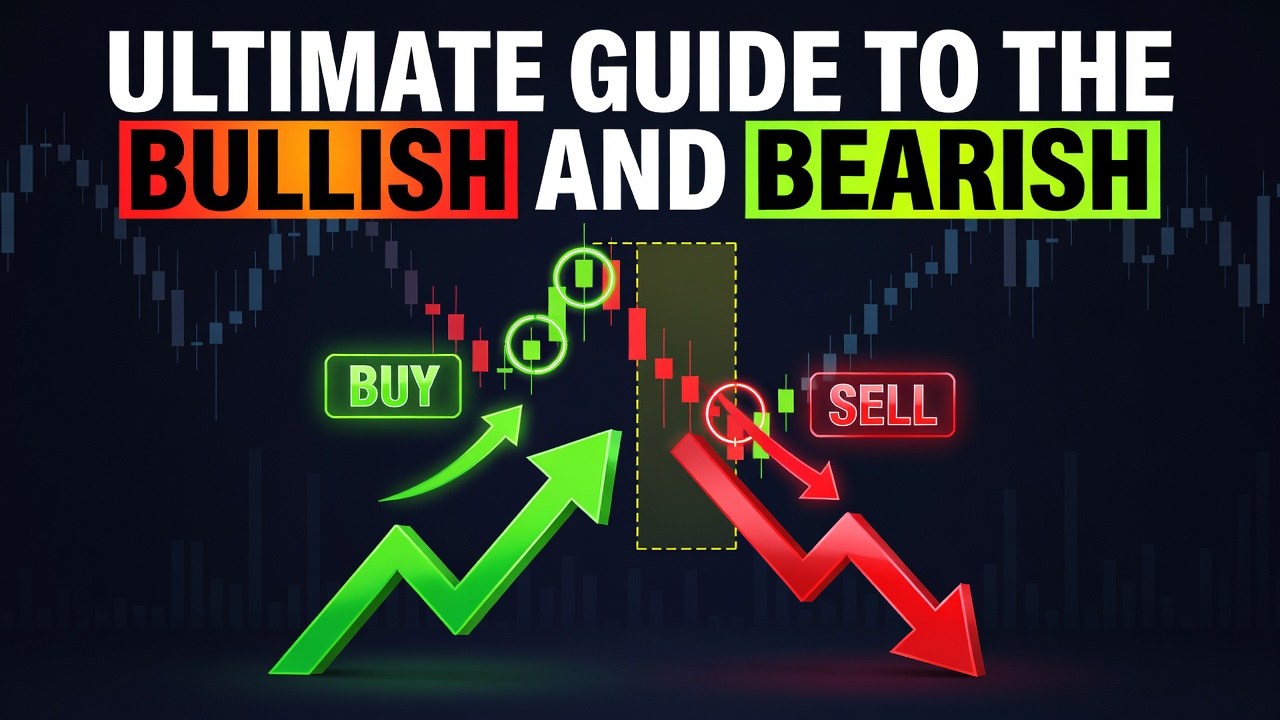
The bullish and bearish engulfing candle strategy is a high-probability price action method used to spot major trend reversals in financial markets. This strategy relies on a two-candle sequence where the second, larger candle completely covers the entire body range of the preceding candle, signaling a violent transfer of control between buyers and sellers. Successful traders use this pattern across multiple assets to enter new trends early, manage risk tightly, and ride momentum shifts.
- Engulfing patterns require a two-candle sequence where the body of the second candle completely swallows the first candle’s real body.
- A valid setup must occur after a prolonged, sustained price trend or at a major key support and resistance level.
- Stop losses must always be anchored beyond the extreme wick of the engulfing candle to protect against market noise.
- Reliability increases significantly when the engulfing candle experiences a massive spike in trading volume.
What Is the Bullish and Bearish Engulfing Candle?
The engulfing pattern is a classic Japanese candlestick reversal formation that signals a complete shift in market sentiment. Originally documented by Munehisa Homma in the 18th-century Japanese rice markets, this pattern represents the absolute capitulation of one side of the market and the sudden dominance of the other. The pattern consists of two candles: a trend-aligned candle with a small body, followed immediately by a massive counter-trend candle that completely wraps around the prior candle’s body. Unlike inside bars or pin bars, the engulfing pattern shows explosive, active momentum. This isn’t just a pause in the market; it is an aggressive, visual representation of a major liquidity sweep and trend reversal.
The Market Psychology Behind Engulfing Candles
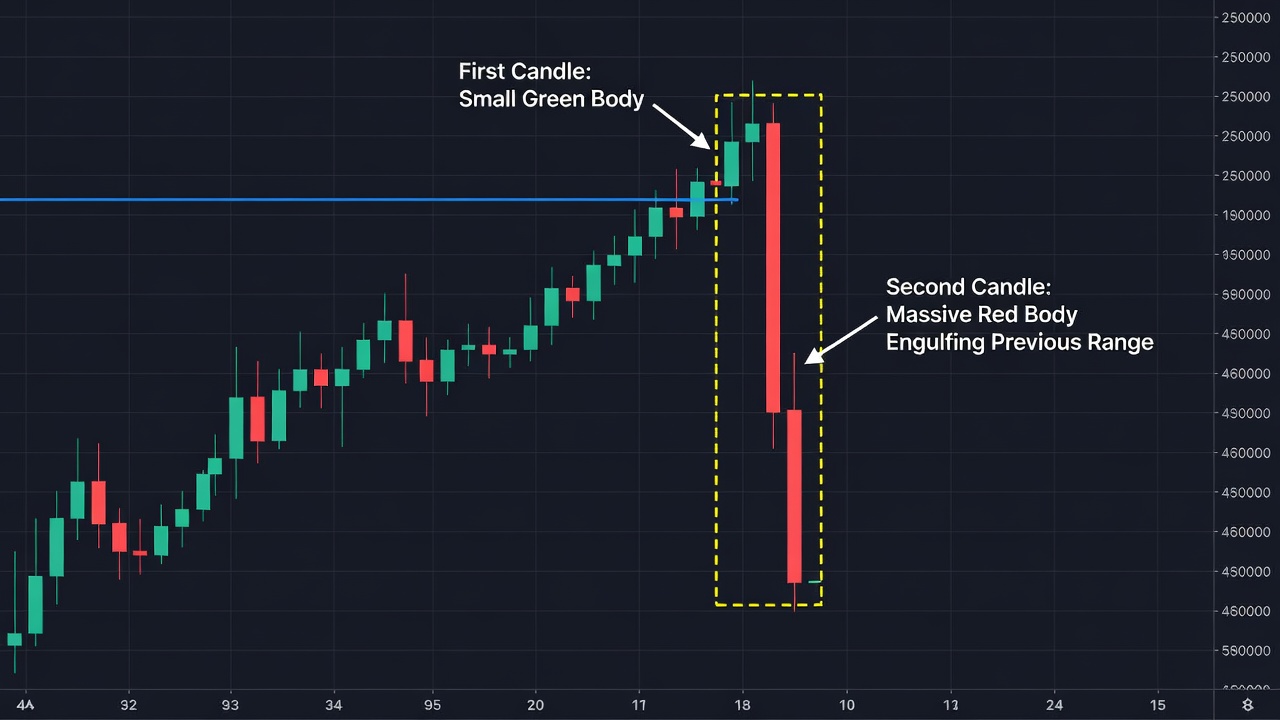
The visual structure of an engulfing candle tells the story of an institutional trap springing shut on retail traders. In a bearish engulfing scenario, the market opens and initially pushes higher, continuing the established uptrend and trapping late-stage buyers who FOMO into the market at the highs. Once those buy orders are filled, institutional selling pressure floods the market, driving the price down rapidly. This rapid decline triggers stop-loss orders from those who just bought, adding massive downward fuel to the fire. By the time the candle closes, the sellers have driven the price below the previous session’s open. The bulls are completely trapped, their positions are underwater, and the sudden rush of selling pressure creates a waterfall effect that initiates a new downtrend.
How to Identify the Engulfing Candle on a Chart
To trade this pattern successfully, you must ignore minor, noisy engulfing candles and only trade those that meet strict structural rules. Many traders fail because they label every large candle as an engulfing setup regardless of its structural properties or location.
The Preceding Trend
An engulfing candle cannot exist in a vacuum or in a choppy, sideways market. A bullish engulfing candle must be preceded by a clear, defined downtrend of at least 5 to 7 candles. A bearish engulfing candle must be preceded by a clear, defined uptrend. If the market is consolidating, ignore the pattern entirely.
Body-to-Body Relationship
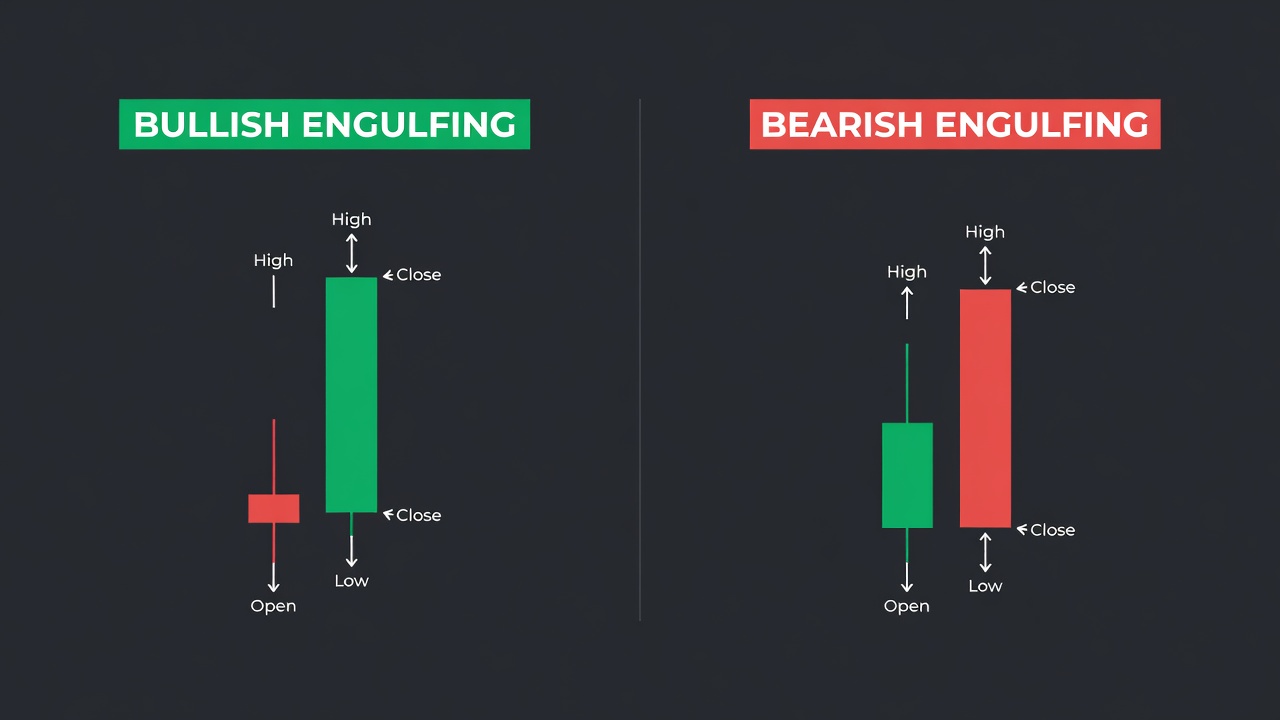
The real body of the second candle must completely envelope, or engulf, the real body of the first candle. While some traders debate whether the wicks must also be engulfed, the most reliable setups occur when the second candle’s body covers both the body and the wicks of the first candle.
Color Contrast
The two candles must be of opposite colors. For a bullish engulfing pattern, candle one must be bearish (red/black) and candle two must be bullish (green/white). For a bearish engulfing pattern, candle one must be bullish and candle two must be bearish.
The Exact Engulfing Candle Setup Criteria
You must only execute trades when all of the following structural and environmental criteria are met. Disregarding even one of these rules turns your trading into pure gambling.
- Timeframe: The 4-hour, Daily, and Weekly timeframes are highly recommended; avoid timeframes below the 15-minute mark due to excessive market noise.
- Trend Location: The pattern must form at a prominent swing high (bearish) or swing low (bullish).
- Key Level Alignment: The engulfing candle must reject or bounce off a key daily horizontal support/resistance level, a weekly pivot point, or a major moving average.
- Candle Size Ratio: The engulfing candle must be at least twice the average size of the previous five candles on the chart.
- Volume Confirmation: The volume on the second candle must be significantly higher than the volume on the first candle, showing institutional participation.
How Do You Trade the Engulfing Candle? (Entry, Stop Loss, Target)
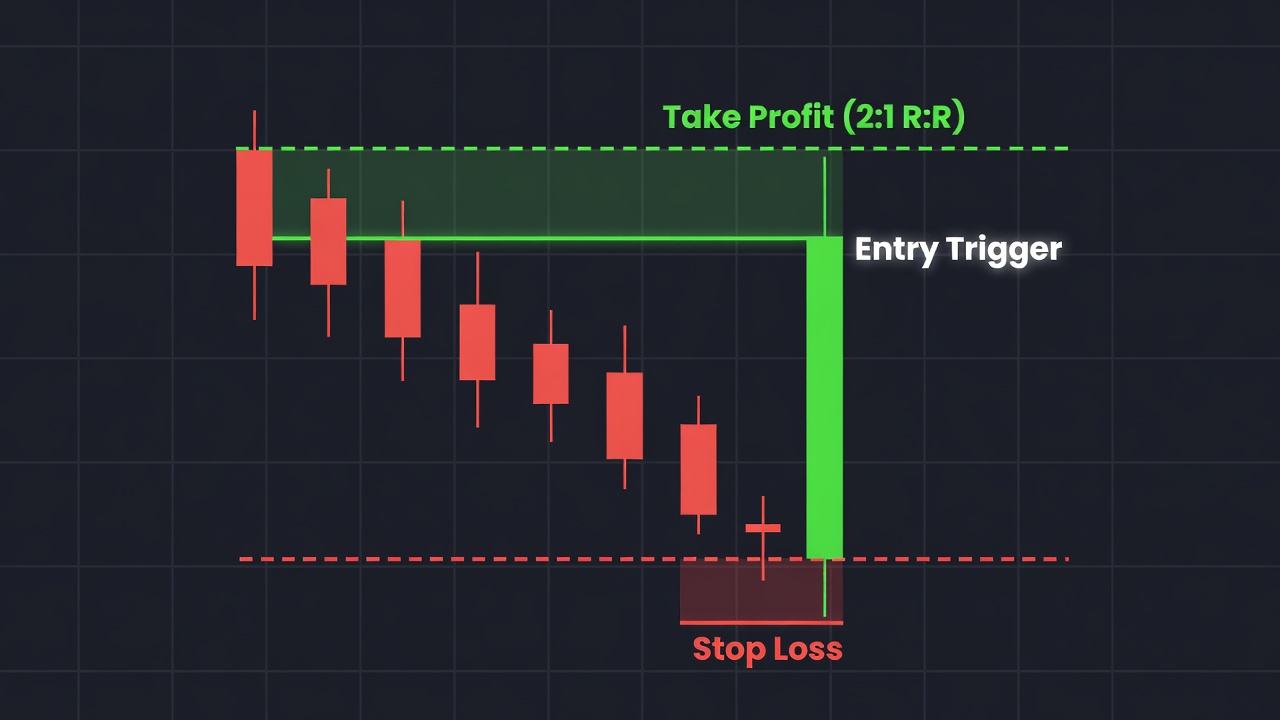
Successful execution requires a mechanical entry trigger and a protective stop placement that accounts for market volatility. Do not guess or front-run the pattern before the second candle closes.
To enter a bullish engulfing trade, wait for the second candle to close completely. Place a buy stop order 1 pip above the high of this green engulfing candle. This ensures that you are only dragged into the trade if the upward momentum continues immediately after the candle’s close.
For your stop loss, place it 1 ATR (Average True Range) below the low of the engulfing candle. Using an ATR-based buffer prevents you from getting knocked out of the trade by temporary wick tests or market spread widening. If the market breaks the low of that massive engulfing candle, the setup is invalidated, and you must exit immediately.
Set your primary profit target at a minimum of 2:1 reward-to-risk ratio. Alternatively, target the nearest major opposing swing high (for longs) or swing low (for shorts). If the momentum is exceptionally strong, take partial profits at 2:1 and trail your remaining position behind the most recent swing points using a 20-period Exponential Moving Average.
Engulfing Candle Trade Example: Step-by-Step
Let us break down a hypothetical short trade on EUR/USD on the 4-Hour timeframe. The asset has been in a sustained uptrend for several days, pushing higher and making consecutive higher highs. As price approaches a critical daily resistance level at 1.1000, momentum begins to slow down, signaled by smaller bullish candles.
Suddenly, a small green candle is printed, showing indecision near the key resistance level. The very next 4-Hour candle opens with a slight gap up, enticing retail breakout buyers to go long. However, institutional sellers immediately step in and aggressively drive the price down. By the end of the 4-hour session, a massive red candle closes well below the previous green candle’s open. The bearish engulfing pattern is fully formed. The volume panel shows a massive spike, registering 2.5 times the average volume of the last ten sessions.
As you can see in the annotated chart above, you place a sell stop order 1 pip below the low of this massive red engulfing candle. Your stop loss is positioned 1 ATR above the high of the engulfing candle. Two hours into the next candle, the sell stop is triggered. Over the next three days, the price drops rapidly, heading straight toward the next major support zone. The market easily hits the 2:1 reward-to-risk target, pocketing a highly profitable, clean trade with minimal drawdown.
Engulfing Candle Across Different Timeframes
While engulfing candles appear on all timeframes, their accuracy and market impact scale exponentially as the timeframe increases. On lower timeframes, like the 1-minute or 5-minute charts, engulfing patterns occur constantly, but most of them are false signals caused by minor order flow imbalances and market noise. These micro-engulfing candles lack the institutional commitment required for sustained reversals.
On the daily and weekly charts, an engulfing pattern represents days or weeks of massive capital flow shifts. A weekly engulfing candle can initiate a macro-reversal that lasts for several months. If you trade lower timeframes, always use the higher timeframe charts to identify the dominant trend and key support/resistance levels, then look for your engulfing triggers on the lower execution timeframes.
Engulfing Candle vs. Outside Bar: Key Differences
Traders often confuse these two prominent price action patterns, but they represent different market structures.
The Engulfing Candle
The engulfing candle focus is strictly on the real bodies of the candles. The body of the second candle must completely envelope the body of the first candle. The wicks of the first candle do not necessarily have to be swallowed by the second candle’s body, though it is preferred. It specifically marks a decisive momentum reversal.
The Outside Bar
An outside bar is a broader pattern where the entire high-to-low range of the second candle must exceed the entire high-to-low range of the first candle. This means both the highest wick and the lowest wick of the second candle must completely overlap the extreme wicks of the first candle. It represents a massive expansion of overall volatility rather than just a shift in candle body sentiment.
Best Confluences to Stack With Engulfing Candles
Never trade engulfing candles in isolation; always stack them with high-probability technical filters. Stacking your setup with key market levels increases your win rate dramatically.
- Horizontal Support and Resistance: Trading a bullish engulfing pattern right at a historical support level ensures you have market memory on your side.
- The 200-period EMA: Only take bullish engulfing candles that align with the direction of the 200 EMA to keep yourself on the side of the macro trend.
- Prior Day High/Low: An engulfing candle that sweeps the liquidity above the previous day’s high before reversing is an incredibly high-probability short setup.
- RSI Divergence: If the RSI shows a bullish divergence while a bullish engulfing candle forms at support, a powerful reversal is highly likely.
Common Engulfing Candle Mistakes to Avoid
- Trading the pattern in low-liquidity market conditions or during major, unpredictable high-impact news releases.
- Entering a trade on an engulfing candle that has an abnormally massive body, which forces your stop loss to be too wide and ruins your risk-to-reward ratio.
- Taking engulfing setups in the middle of choppy, sideways consolidation ranges where price action has no direction.
- Forgetting to verify if the previous trend was mature enough to warrant a reversal setup.
- Using market orders to enter early before the second engulfing candle has officially closed.
Engulfing Candle Checklist
- Is the market currently in a clear, defined uptrend or downtrend? (Yes/No)
- Has the engulfing candle formed at a key support, resistance, or moving average level? (Yes/No)
- Does the body of the second candle completely cover the body of the first candle? (Yes/No)
- Is the color of the second candle opposite to the color of the first candle? (Yes/No)
- Is the trading volume on the engulfing candle higher than the previous candle’s volume? (Yes/No)
- Is the engulfing candle’s body size reasonable enough to allow for a good risk-to-reward ratio? (Yes/No)
Frequently Asked Questions About Engulfing Candles
Does a bullish engulfing candle have to engulf the wicks?
No, standard price action rules state that only the real body of the second candle must engulf the real body of the first candle. However, if the second candle’s body also covers the entire high-to-low wick range of the first candle, the signal is considered much stronger and more reliable.
What is the success rate of the engulfing candle strategy?
The success rate varies depending on risk management and market selection, but it typically ranges between 55% and 65% when combined with high-quality confluence factors like support/resistance levels and volume. Trading the pattern in isolation without confluence will result in a much lower win rate due to false breakouts.
Can you trade engulfing candles on the 1-minute chart?
While you can find them on the 1-minute chart, it is highly discouraged due to the extreme noise and frequent false moves present on micro-timeframes. Professional traders prefer using the 1-hour, 4-hour, and daily charts where the patterns carry far more institutional weight.
What is the difference between an engulfing candle and an outside bar?
An engulfing candle only requires the second candle’s body to swallow the first candle’s body. An outside bar is a specific structural high-to-low pattern where the entire high-to-low price range of the second candle completely covers the high-to-low range of the prior candle.
🎯 Get High-Probability Trade Setups — Free
The Big Dipper Dashboard delivers curated trade ideas straight to your screen every morning. Know what to watch before the opening bell.

📈 Want More? Join Our Free Trading Community
- Trading Strategy Guides Telegram — daily strategy tips and market insights
- Find Better Trades Telegram — free trade signals delivered to your phone
- Find Better Trades on YouTube — live trade breakdowns and tutorials