

The Velvet Hammer: A Precision Momentum Reversal Strategy

The Velvet Hammer is a high-conviction momentum reversal strategy engineered to capture explosive trend-continuation moves right as a brief retracement ends. Instead of guessing where a pullback stops, this strategy uses a combination of high-speed trend filtering, deep momentum exhaustion, and price action execution to strike the market with absolute precision. This is for active swing traders and day traders who want to stop catching falling knives and start entering trades at the exact micro-second momentum swings back in their direction.
What Is The Velvet Hammer?
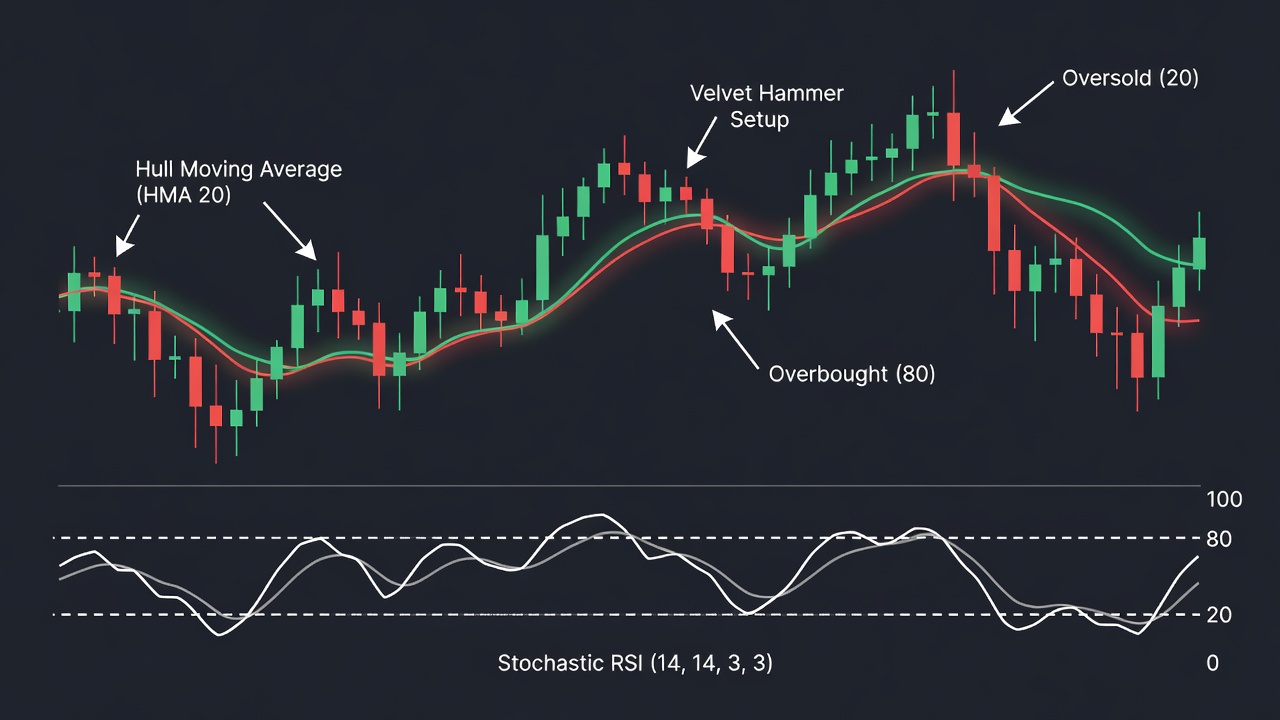
The Velvet Hammer is a trend-following momentum strategy that waits for a highly liquid market to establish a clear directional trend, pulls back to a dynamic level of support or resistance, and then strikes the moment price action confirms the trend is resuming. The ‘velvet’ component is the Hull Moving Average, which smooths out market noise without the lag of traditional moving averages. The ‘hammer’ is the aggressive trigger candle that signals the absolute end of the retracement and the immediate resumption of the dominant trend.
Indicators You Need
- Hull Moving Average (HMA) – Period 20: This serves as our dynamic trend filter and support/resistance line. We color-code it so that it is green when sloping upward and red when sloping downward.
- Stochastic RSI (14, 14, 3, 3): This is our momentum exhaustion tracker. We use it to identify deep, high-probability pullbacks within a strong trend when the indicator crosses below 20 (oversold) or above 80 (overbought).
- Engulfing Candle Pattern: This is our price action trigger. We do not use indicator-based entry signals; we require a physical engulfing candle to confirm institutional buying or selling pressure has returned.
This strategy is highly versatile but performs exceptionally well on the 15-minute, 1-hour, and 4-hour timeframes where market trends have structural stability.
The Velvet Hammer Rules — Step by Step
- Step 1: Establish the Trend and Dynamic Support
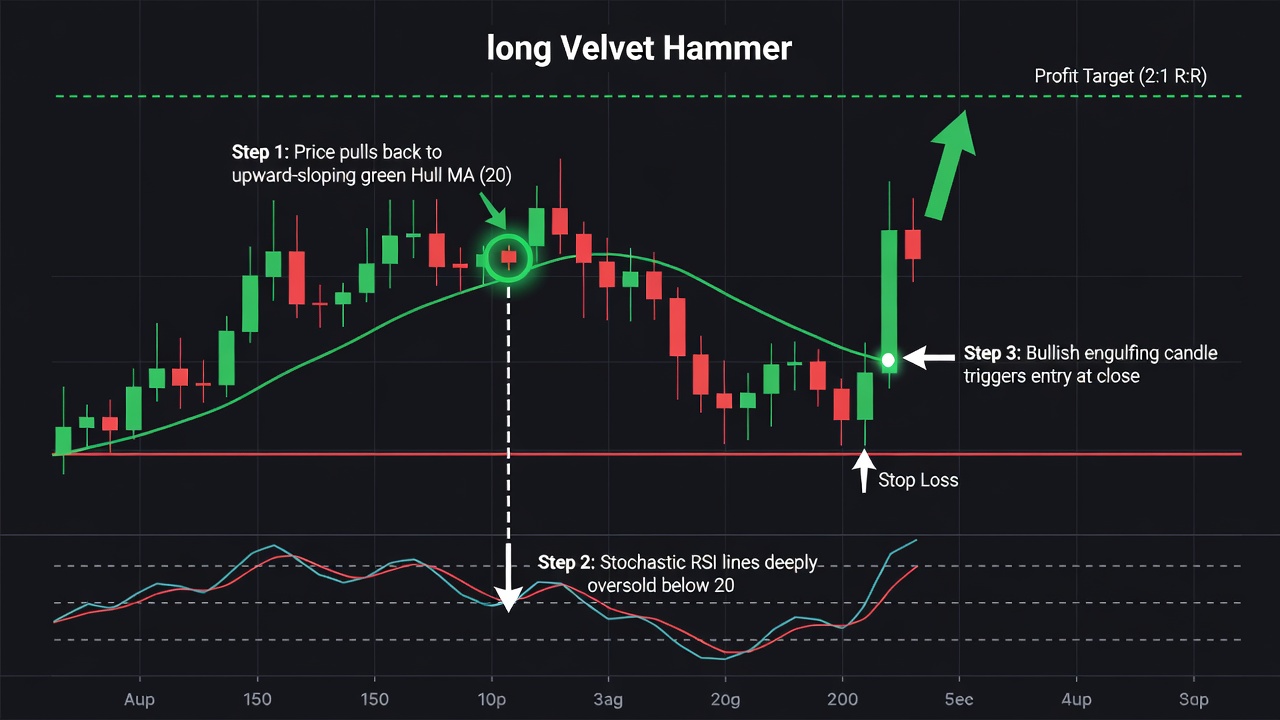
Put the 20-period Hull Moving Average (HMA) on your chart. For a long trade, the HMA must be sloping upward and colored green. Price must be trading cleanly above the HMA. For a short trade, the HMA must be sloping downward and colored red, with price trading cleanly below it. Before looking for any entry, price must pull back and touch or pierce the 20 HMA without the HMA changing slope. - Step 2: Wait for Momentum Exhaustion
While price is contacting the 20 HMA, look down at your Stochastic RSI. For a long setup, both the %K and %D lines must cross below the 20 level into oversold territory, indicating the pullback is fully mature. For a short setup, both lines must cross above the 80 level into overbought territory. This puts the strategy on active alert. - Step 3: Trigger the Trade with an Engulfing Candle
The final trigger is price action. For a long entry, you must wait for a bullish engulfing candle to close. The body of this green candle must completely engulf the body of the previous red candle, and it must close while the HMA is still green and sloping upward. Enter the trade immediately at the close of this engulfing candle. For a short entry, a bearish engulfing candle must close while the HMA is red and sloping downward.
Entry, Stop Loss & Profit Target
Precision execution is what separates profitable traders from the rest. Enter the trade at the exact market close of the qualifying engulfing candle. Do not front-run the close; wait for the candle to lock in.
For long setups, place your stop loss 2-3 pips/cents below the physical swing low of the pullback structure or the low of the engulfing candle, whichever is lower. For short setups, place your stop loss 2-3 pips/cents above the physical swing high of the pullback or the high of the engulfing candle, whichever is higher.
Set your profit target at a strict 2:1 reward-to-risk ratio. For example, if your stop loss is 30 cents away from your entry price, your limit order goes exactly 60 cents away from your entry. Alternatively, you can target the most recent major swing high (for longs) or swing low (for shorts) if it yields a risk-to-reward ratio of at least 1.8:1.
The Velvet Hammer on a Live Chart
The live chart below showcases the strategy applied to a highly liquid index ETF. This asset is perfect for the strategy because index trends are heavily institutionalized, creating clean pullbacks to the 20 HMA that react reliably to oversold momentum readings.
Common Mistakes to Avoid
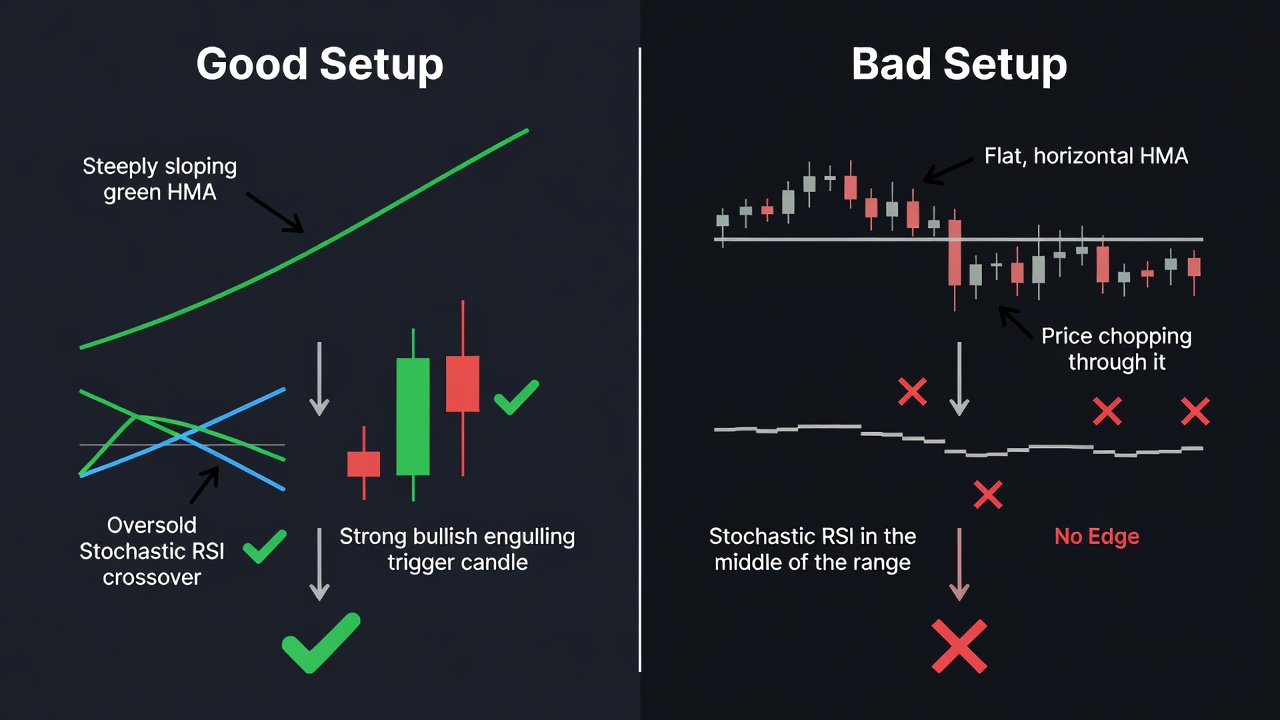
- Chasing flat moving averages: Do not trade this strategy when the HMA is moving horizontally. The HMA must show a distinct, visible slope up or down.
- Ignoring the candle close: Entering before the engulfing candle officially closes is a recipe for disaster. False breakouts happen constantly; the close is your protection.
- Trading through high-impact news: Major economic releases can easily slice through the 20 HMA regardless of how oversold the Stochastic RSI is. Step aside during red-folder events.
- Taking weak engulfing candles: If the trigger candle barely covers the previous candle body or has massive wicks, skip the trade. We want a strong, decisive, full-bodied engulfing candle.
Quick Reference Checklist
- Is the asset highly liquid? (Yes/No)
- Is the 20 HMA showing a clear, visible slope? (Yes/No)
- Is price trading on the correct side of the HMA? (Yes/No)
- Has price physically touched or breached the 20 HMA during a pullback? (Yes/No)
- Are both Stochastic RSI lines in the deep exhaustion zone (under 20 for long, over 80 for short)? (Yes/No)
- Did a valid engulfing candle close in the direction of the dominant trend? (Yes/No)
- Is your risk-to-reward ratio at least 1.8:1 to the nearest major structural key level? (Yes/No)
Frequently Asked Questions
Q: Can I use this strategy on cryptocurrency or forex pairs?
A: Yes. The strategy relies on momentum and structural pullbacks, which are universal market dynamics. Just ensure the pair you trade has high volume to avoid erratic wick behavior that can trigger bad fills.
Q: What should I do if the HMA changes color before the engulfing candle closes?
A: The trade is invalidated. If the HMA changes color, it means the short-term trend has lost its structural integrity, and the pullback might be turning into a full-scale trend reversal.
Q: Why use the Hull Moving Average instead of a standard EMA?
A: Standard EMAs lag too much, which leads to late entries on fast-moving pullbacks. The Hull Moving Average solves the lag problem while remaining incredibly smooth, giving you the fastest possible trend confirmation.
🎯 Get High-Probability Trade Setups — Free
The Big Dipper Dashboard delivers curated trade ideas straight to your screen every morning. Know what to watch before the opening bell.

📈 Want More? Join Our Free Trading Community
- Trading Strategy Guides Telegram — daily strategy tips and market insights
- Find Better Trades Telegram — free trade signals delivered to your phone
- Find Better Trades on YouTube — live trade breakdowns and tutorials
