Complete Guide to the Bull Flag and Bear Flag Pattern Trading Guide

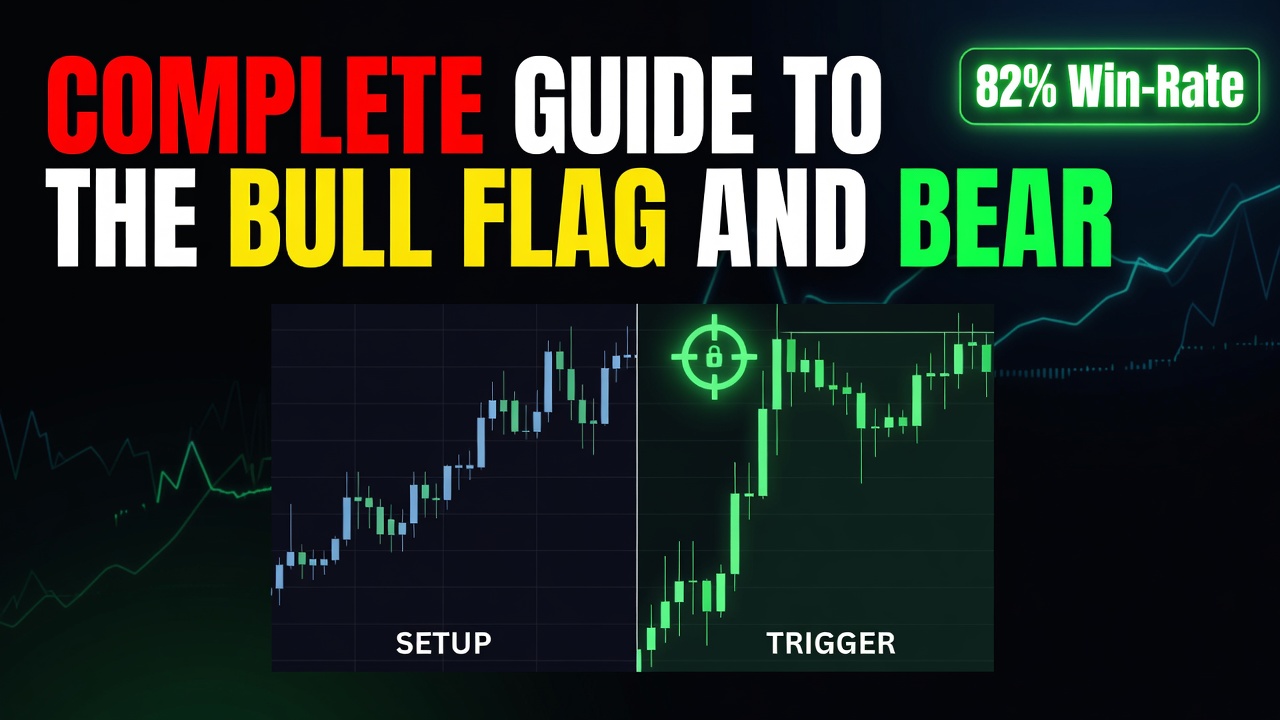
The bull flag and bear flag pattern is a high-probability continuation setup that signals a brief pause in a powerful market trend before the dominant momentum resumes. This reliable price action structure allows traders to enter established trends with tight risk parameters and clear, mathematically defined profit targets. Whether you trade forex, equities, crypto, or futures, mastering these flag variations gives you a repeatable edge for capturing explosive trend expansion phases.
- Trend Continuation: Flags are reliable continuation structures that signal the prevailing trend is taking a temporary breather before resuming.
- Asymmetrical Risk/Reward: The tight consolidation phase allows traders to place narrow stop losses, yielding highly favorable risk-to-reward ratios.
- Two Core Components: Every valid pattern requires a sharp, high-volume impulse move (the flagpole) followed by a orderly, sloping consolidation channel (the flag).
- Objective Targets: Profit targets are easily projected using the measured move technique, which projects the length of the flagpole from the breakout point.
What Is the Bull Flag and Bear Flag Pattern?
The bull flag and bear flag pattern represents a temporary pause in a strongly trending market. First documented systematically by early technical analysts like Richard Schabacker and Edwards & Magee, these patterns visually depict a period of market digestion. When institutional money aggressively pushes price in one direction, the market becomes temporarily overextended. Instead of reversing, the price holds its ground, drifting slightly backward in a tight, parallel channel. This orderly consolidation shows that the dominant market force is not letting go of control, making it one of the most watched continuation setups in modern technical analysis.
The Market Psychology Behind the Flag Patterns
The visual structure of a flag pattern is a direct representation of institutional accumulation and profit-taking. During the formation of the flagpole, large institutional players buy or sell aggressively, clearing out all opposing liquidity and creating a rapid, near-vertical price expansion. Once this initial buying or selling climax halts, shorter-term traders begin taking profits, which causes a minor pullback. However, because underlying institutional demand remains strong, sellers cannot push the price down significantly. Instead of a deep retracement, price forms a tight, downward-sloping channel (in a bull flag) or upward-sloping channel (in a bear flag). The lack of selling pressure during a bull flag’s downward drift proves that supply is scarce; as soon as buyers step back in to clear the upper boundary of the channel, short-sellers are forced to cover, fueling the explosive breakout.
How to Identify the Flag Patterns on a Chart
Accurate identification requires strict adherence to visual rules to avoid trading weak, random market noise. You cannot simply call any pause in price action a flag; it must meet specific structural and proportional criteria.
The Flagpole (Impulse Phase)
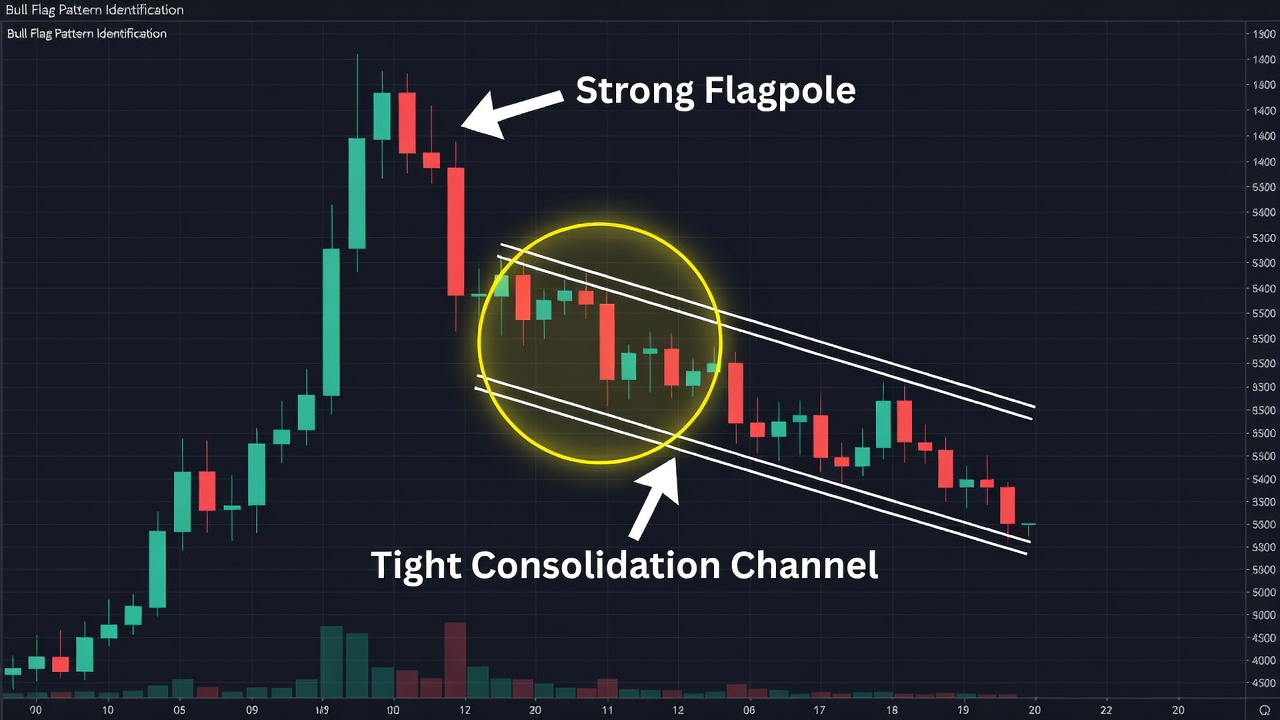
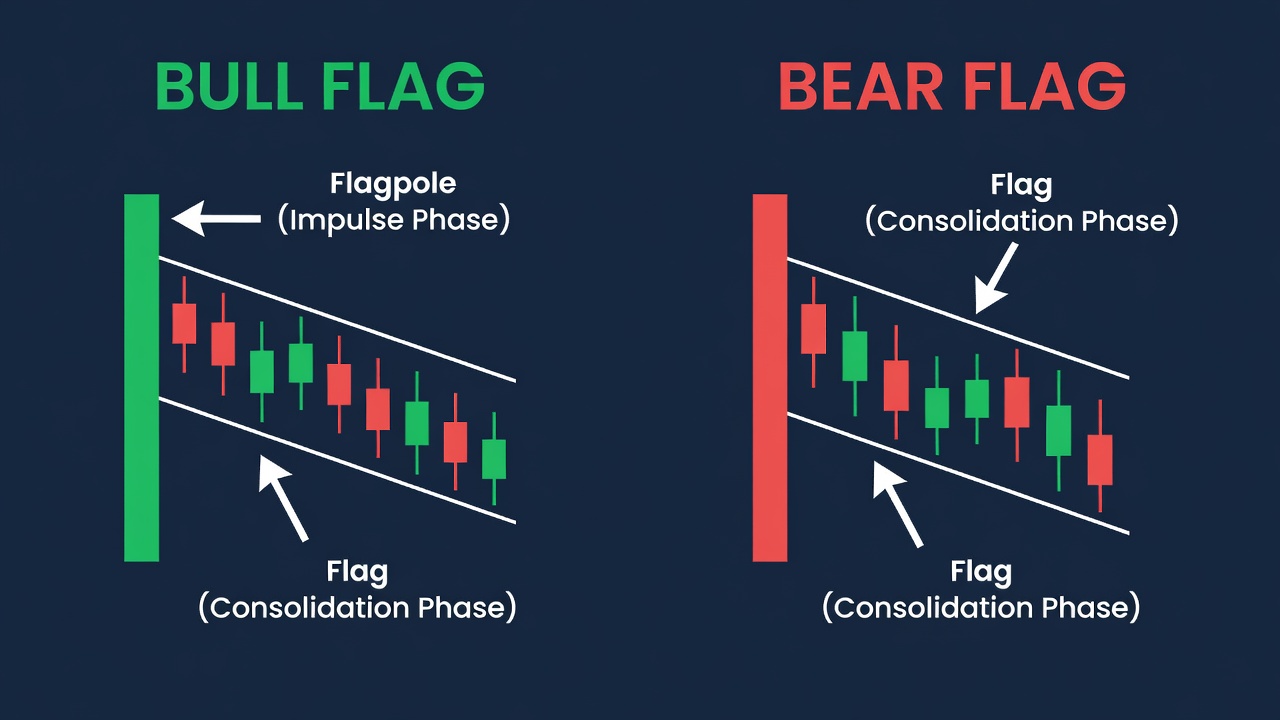
The flagpole must be a rapid, near-vertical price expansion characterized by large-bodied candles. This move should stand out clearly from the surrounding price action. The candles within the flagpole should have minimal wicks, showing absolute dominance by one side of the market. This phase represents the momentum that you want to ride after the pattern resolves.
The Flag (Consolidation Phase)
The consolidation must form a tight, parallel channel that slopes against the direction of the flagpole. For a bull flag, the channel must slope downward; for a bear flag, the channel must slope upward. If the consolidation slopes in the same direction as the trend, it is highly prone to failure. The consolidation should be tight, orderly, and contain smaller candle bodies with overlapping wicks, reflecting a temporary equilibrium.
The Retracement Depth
The depth of the consolidation channel must not retrace more than 50% of the flagpole’s length. Ideally, the strongest flag patterns find support or resistance near the 38.2% Fibonacci retracement level of the flagpole. A consolidation that drifts past the 50% retracement level indicates that the opposing forces are gaining too much power, which invalidates the continuation thesis.
The Exact Flag Pattern Setup Criteria
- Identify a Strong Trend: The market must be in a clear, established trend on your trading timeframe, preceded by a high-volume breakout.
- Confirm the Flagpole: Locate an impulsive, vertical move consisting of consecutive large-bodied candles in the direction of the trend.
- Analyze the Consolidation: Ensure the pullback forms a parallel channel (not a wedge or triangle) sloping against the flagpole.
- Check Retracement Levels: Confirm the pullback does not penetrate deeper than the 50% Fibonacci retracement level of the flagpole.
- Monitor Volume: Volume should spike during the flagpole formation, dry up significantly during the flag consolidation, and spike again on the breakout.
How Do You Trade the Flag Patterns? (Entry, Stop Loss, Target)
Trading flag patterns successfully requires waiting for confirmation rather than anticipating the breakout. Trying to buy at the absolute bottom of a bull flag or sell at the absolute top of a bear flag is a low-probability guessing game.
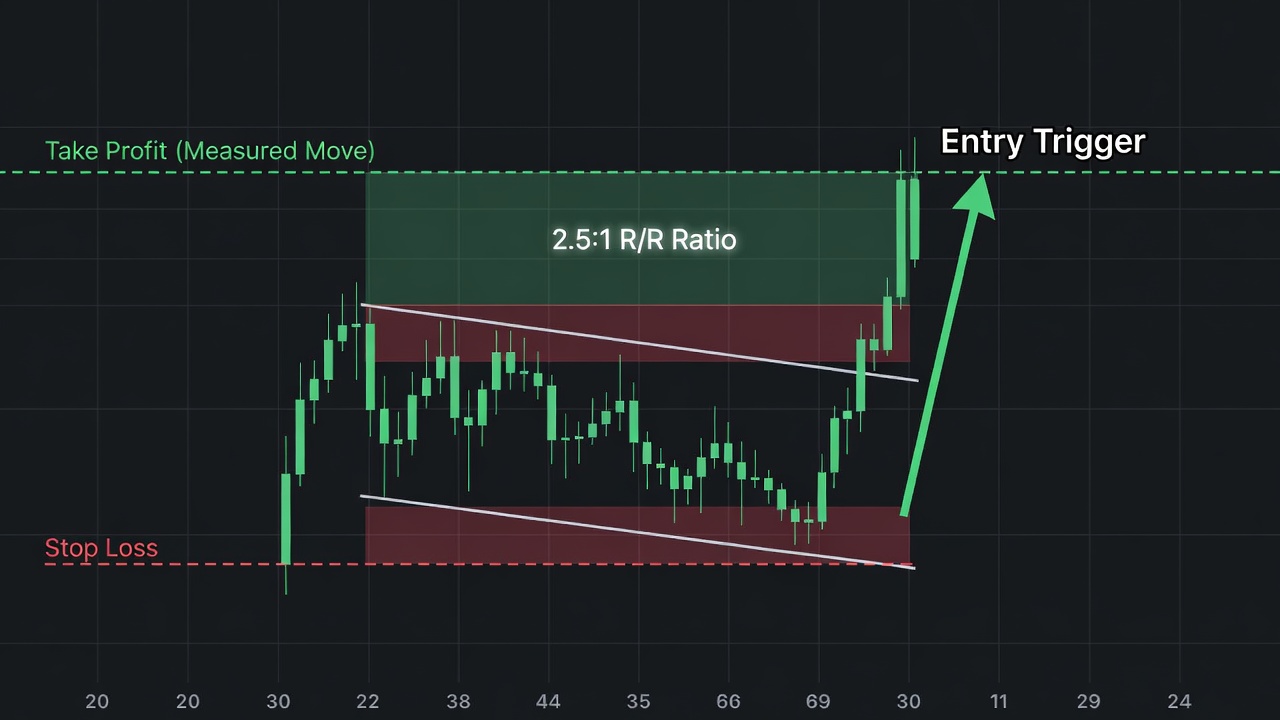
The Entry Trigger: Enter the trade on the close of the candle that breaks and closes outside the flag’s parallel channel. Alternatively, conservative traders can wait for a retest of the broken channel boundary, though strong flags often run immediately without offering a retest.
Stop Loss Placement: Place your stop loss 1 ATR below the lowest point of the consolidation channel for a bull flag, or 1 ATR above the highest point of the consolidation channel for a bear flag. This structural anchor protects your capital from normal market noise while invalidating the trade if the pattern truly fails.
Profit Target Methods: Use the “measured move” method. Measure the vertical height of the flagpole from its initial swing start to its absolute peak. Project that exact distance upward from the breakout point of the flag to establish your primary profit target. This setup routinely yields a risk-to-reward ratio of 2:1 or higher.
Flag Pattern Trade Example: Step-by-Step
Let’s walk through a step-by-step trade execution to illustrate these rules in a real market scenario. Assume we are monitoring a major currency pair on the 1-Hour chart. The market has been quietly consolidating before a major economic release, which acts as a catalyst.
Suddenly, a massive surge of buying pressure enters the market. Over the course of four consecutive hourly candles, the price surges upward by 120 pips, forming a near-vertical flagpole. Volume spikes to twice the 20-period average. Following this aggressive expansion, the price begins to drift lower in an orderly, downward-sloping channel over the next nine hours. The candles during this drift are small, with overlapping wicks, and the volume drops off to extremely low levels. This tells us the selling pressure is weak.
As you can see in the annotated chart above, the retracement bottoms out precisely at the 38.2% Fibonacci retracement level of the flagpole. On the tenth hour of consolidation, a strong green candle surges through the upper resistance line of the flag channel and closes above it. This is our entry signal. We immediately enter long at the close of that breakout candle. We place our stop loss 5 pips (approximately 1 ATR) below the lowest swing low of the flag consolidation. Our target is set using the measured move: we project the 120-pip height of the flagpole from our breakout entry point. The market momentum surges again, hitting our target within five hours for a clean, disciplined win with a 2.3:1 risk-to-reward ratio.
Flag Patterns Across Different Timeframes
While flag patterns are fractal and appear on all charts, their reliability and average yield change significantly across timeframes. High-frequency charts like the 5-minute or 15-minute produce frequent flag setups, but they are highly susceptible to market noise, spread costs, and false breakouts caused by minor order flow imbalances.
The cleanest and most reliable flag patterns appear on the 1-Hour, 4-Hour, and Daily timeframes. On these higher timeframes, it takes substantial capital to form a flagpole and a flag, meaning the pattern is a direct result of institutional flow rather than retail noise. Daily and weekly flags can lead to massive macro-trend continuations that run for weeks or months, making them highly profitable for swing traders and position traders.
Bull/Bear Flags vs. Pennants: Key Differences
Traders often confuse flags with pennants, but their structural differences represent distinct market dynamics. Knowing which one you are looking at determines how you should manage your trade expectations.
The Flag Pattern
The flag consists of a consolidation phase bounded by two strictly parallel trendlines. This parallel structure indicates a systematic, orderly profit-taking phase where buyers and sellers maintain a steady, balanced counter-trend channel before the breakout. Flags typically offer cleaner, more predictable breakout triggers.
The Pennant Pattern
The pennant consists of a consolidation phase bounded by converging trendlines, forming a small symmetrical triangle. This represents a rapid contraction of volatility where both highs and lows are compressed quickly. Pennants tend to resolve faster than flags, but their converging nature can make clean entry signals slightly trickier to time.
Best Confluences to Stack With Flag Patterns
- Moving Average Support: Look for a bull flag consolidation to find support at a rising 20-period or 50-period Exponential Moving Average (EMA), which confirms the trend’s dynamic strength.
- Prior Resistance Turned Support: A flag pattern is highly reliable when the consolidation phase forms directly on top of a major broken horizontal resistance level.
- Volume Confirmation: A clear, unmistakable drop in volume during the flag formation, followed by a massive expansion of volume on the breakout candle, confirms institutional participation.
- VWAP Touch: Intraday traders should look for a bull flag pullback to test and bounce off the Volume Weighted Average Price (VWAP) before breaking out.
Common Flag Pattern Mistakes to Avoid
- Trading Flags in a Ranging Market: Flags only work in strong trending environments; attempting to trade them in a sideways, choppy market results in constant whip-saws.
- Ignoring the Slope: Do not trade a bull flag that slopes upward in the direction of the trend, as this represents exhaustion rather than healthy consolidation.
- Accepting Deep Pullbacks: Avoid any flag where the consolidation retraces more than 50% of the flagpole, as the dominant trend’s momentum has been compromised.
- Chasing the Breakout: Entering a trade after the breakout candle has already extended far past the pattern severely damages your risk-to-reward ratio.
- Failing to Verify Volume: A breakout on low, declining volume is highly likely to be a trap; always wait for volume expansion to confirm the move.
Flag Pattern Trading Checklist
- Is there an obvious, near-vertical flagpole formed by large-bodied candles? [Yes/No]
- Is the consolidation bounded by parallel trendlines sloping against the flagpole? [Yes/No]
- Has the consolidation retraced 50% or less of the flagpole’s total height? [Yes/No]
- Did a candle clearly break and close outside of the flag’s channel boundaries? [Yes/No]
- Did volume expand significantly on the breakout candle compared to the flag consolidation? [Yes/No]
- Is your stop loss placed safely outside of the pattern’s structure? [Yes/No]
Frequently Asked Questions About Flag Patterns
Are bull flag patterns bullish or bearish?
Bull flag patterns are highly bullish continuation structures that occur within established uptrends. They signal a temporary pause in buying before the upward momentum resumes. Bear flags, conversely, are bearish continuation structures that occur within downtrends.
What is the success rate of a bull flag pattern?
While the exact success rate varies depending on market conditions, well-identified flag patterns that occur on higher timeframes (like the 4-Hour or Daily) and have clear volume confirmation typically yield a high win rate. Success is maximized by strictly avoiding flags with deep retracements or messy consolidations.
How do you calculate a flag pattern’s price target?
You calculate the price target using the measured move method by measuring the vertical height of the flagpole from its origin to its peak. You then add this exact distance to the breakout point of the flag consolidation to determine your take-profit level.
Can you trade flag patterns on intraday charts?
Yes, you can trade flag patterns on intraday charts like the 5-minute or 15-minute timeframes. However, you must be highly selective, look for clean volume confirmation, and ensure that spreads do not consume too much of your potential profit margin.
🎯 Get High-Probability Trade Setups — Free
The Big Dipper Dashboard delivers curated trade ideas straight to your screen every morning. Know what to watch before the opening bell.

📈 Want More? Join Our Free Trading Community
- Trading Strategy Guides Telegram — daily strategy tips and market insights
- Find Better Trades Telegram — free trade signals delivered to your phone
- Find Better Trades on YouTube — live trade breakdowns and tutorials