Ultimate Guide to the Bull Flag and Bear Flag Pattern Trading Guide


The bull flag and bear flag pattern is a highly reliable trend continuation structure that signals a temporary pause in a powerful, directional market movement. This price action formation allows traders to enter established trends with tight risk parameters before the next impulsive leg begins. Designed for swing traders and day traders alike, mastering this pattern is essential for capitalizing on momentum across all liquid financial markets.
- The flag pattern is a continuation structure consisting of a sharp, high-volume price thrust (the flagpole) followed by a tight, sloping consolidation channel (the flag).
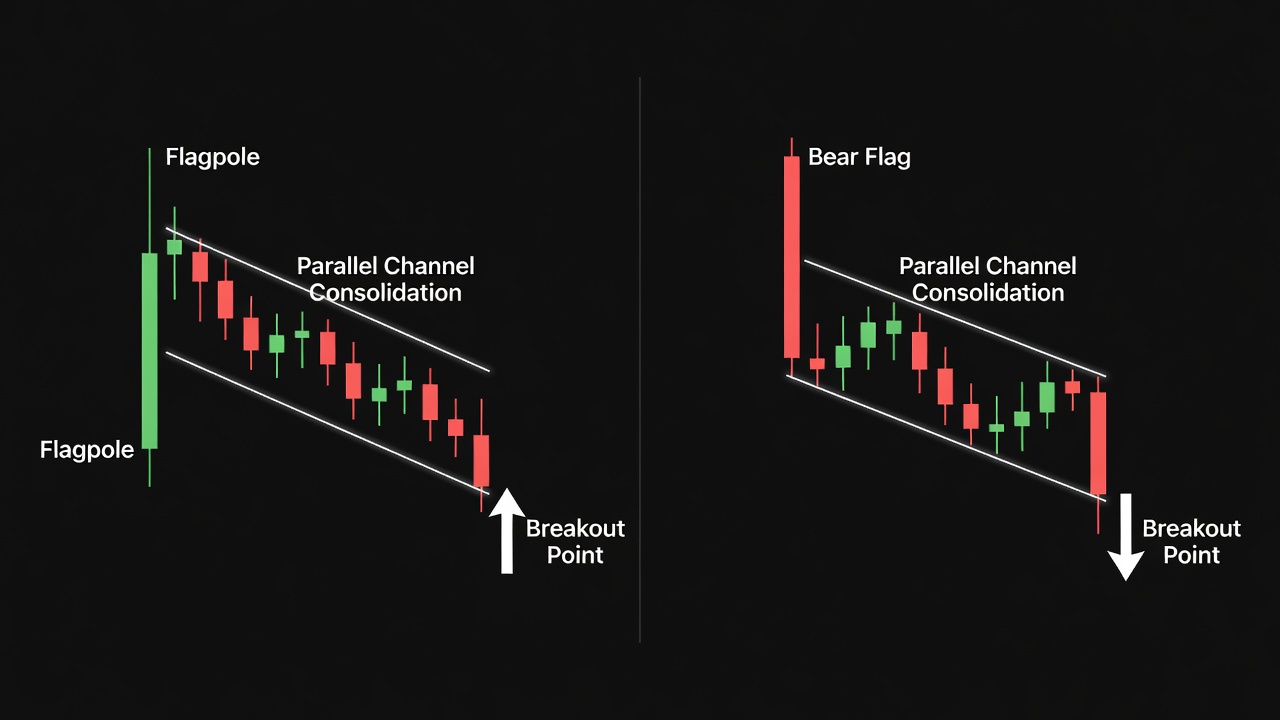
- A bull flag slopes downward against the primary uptrend, while a bear flag slopes upward against the primary downtrend.
- Trade entry is triggered immediately when price breaks and closes outside of the channel boundaries on high volume.
- Stop losses are mathematically anchored just beyond the extreme swing point of the flag consolidation zone.
What Is the Bull Flag and Bear Flag Pattern?
The bull flag and bear flag pattern is a technical analysis structure that resembles a flag on a pole, indicating that a strong market trend is taking a brief breather before resuming its primary direction. Historically rooted in classical charting techniques popularized in the early 20th century, this pattern reflects the natural ebb and flow of market supply and demand. It appears across all asset classes, from equities to forex and futures, during periods of highly directional institutional participation. Traders watch for this pattern because it solves the classic dilemma of chasing a fast-moving market by offering a defined, low-risk entry point during a temporary pullback.
The Market Psychology Behind the Flag Pattern
The visual structure of the flag pattern represents a brief transfer of ownership and profit-taking within a dominant market trend. In a bull flag, the flagpole is created by a sudden, aggressive burst of buying pressure where institutional demand completely overwhelms supply. Once the initial buying surge exhausts itself, early buyers begin taking profits, and short-sellers attempt to pick a top. This creates a shallow, downward-sloping consolidation channel. However, the lack of aggressive selling prevents the price from retracing deeply. This shallow pullback proves that sellers are weak, and as soon as the price breaks above the upper boundary of the consolidation channel, sidelined buyers rush in, forcing short-sellers to buy back their positions and driving a rapid breakout leg.
How to Identify the Flag Pattern on a Chart
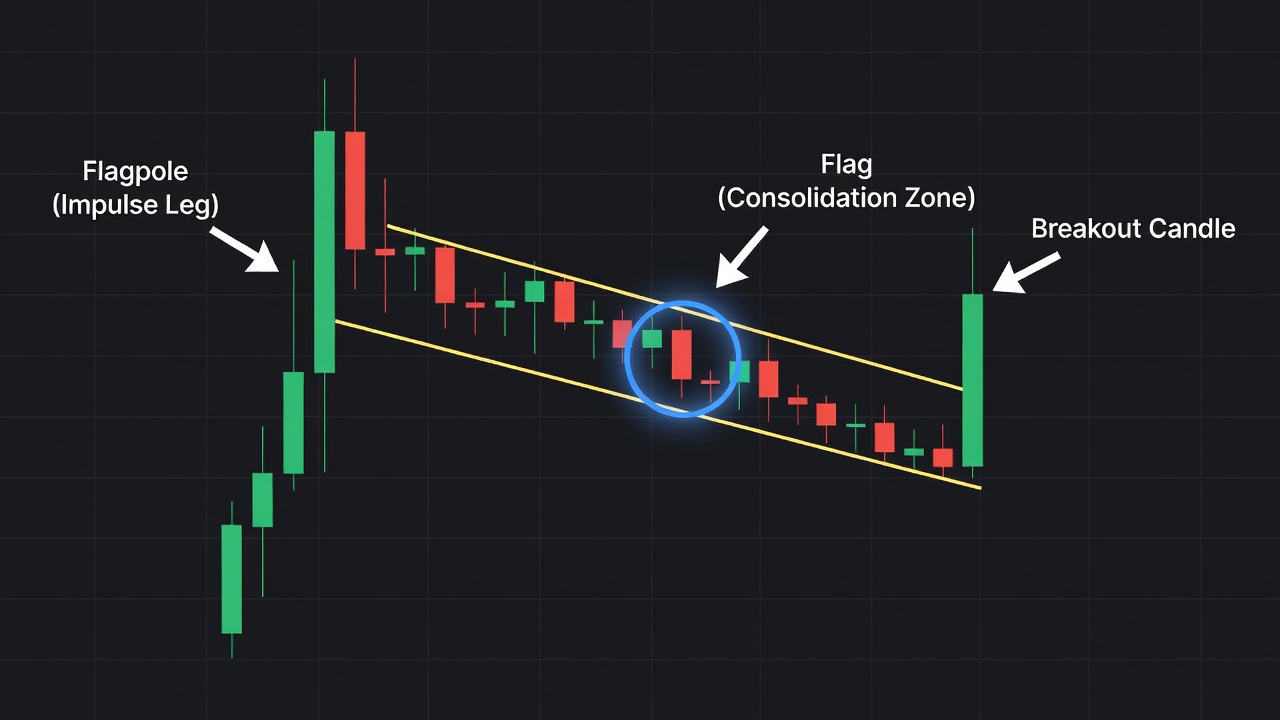
Accurately identifying a flag pattern requires recognizing two distinct phases: a strong directional impulse leg and a tight, orderly consolidation channel. You must look for clear structural geometry rather than messy, overlapping price action that indicates a trendless range.
The Flagpole
The flagpole must be a nearly vertical, rapid price thrust consisting of large-bodied candles. These candles should have minimal wicks, demonstrating absolute control by one side of the market. This phase must be accompanied by above-average volume, confirming institutional commitment to the move.
The Flag Consolidation
The flag itself must be a tight, orderly channel that slopes in the opposite direction of the flagpole. The candles within the flag should be significantly smaller than those in the flagpole, reflecting declining volatility and volume. If the consolidation retraces more than 50% of the flagpole’s height, the pattern’s momentum is compromised, and the setup is invalid.
The Breakout Candle
The pattern is completed by a strong breakout candle that closes outside the parallel channel. This candle must exhibit an expansion in body size and range compared to the consolidation candles. A volume spike on the breakout candle provides definitive confirmation that the next impulsive leg has commenced.
The Exact Flag Pattern Setup Criteria
For a trade setup to be valid, the price action must satisfy a strict sequence of structural rules. If any of these conditions are missing, the probability of failure increases dramatically.
- Timeframe Context: The pattern is most reliable on the 1-hour, 4-hour, and Daily timeframes, though it can be traded on intraday charts down to the 5-minute interval during high-liquidity sessions.
- Trend Requirement: A clear, pre-existing uptrend (for a bull flag) or downtrend (for a bear flag) must be established prior to the formation of the flagpole.
- Flagpole Anatomy: The flagpole must consist of at least 3 to 5 consecutive, large-bodied candles moving rapidly in the trend direction.
- Retracement Limit: The consolidation channel must not retrace deeper than the 38.2% to 50% Fibonacci retracement level of the flagpole’s entire length.
- Boundary Parallelism: The upper and lower boundaries of the flag must be roughly parallel; widening boundaries indicate a broadening formation, which invalidates the setup.
How Do You Trade the Flag Pattern?
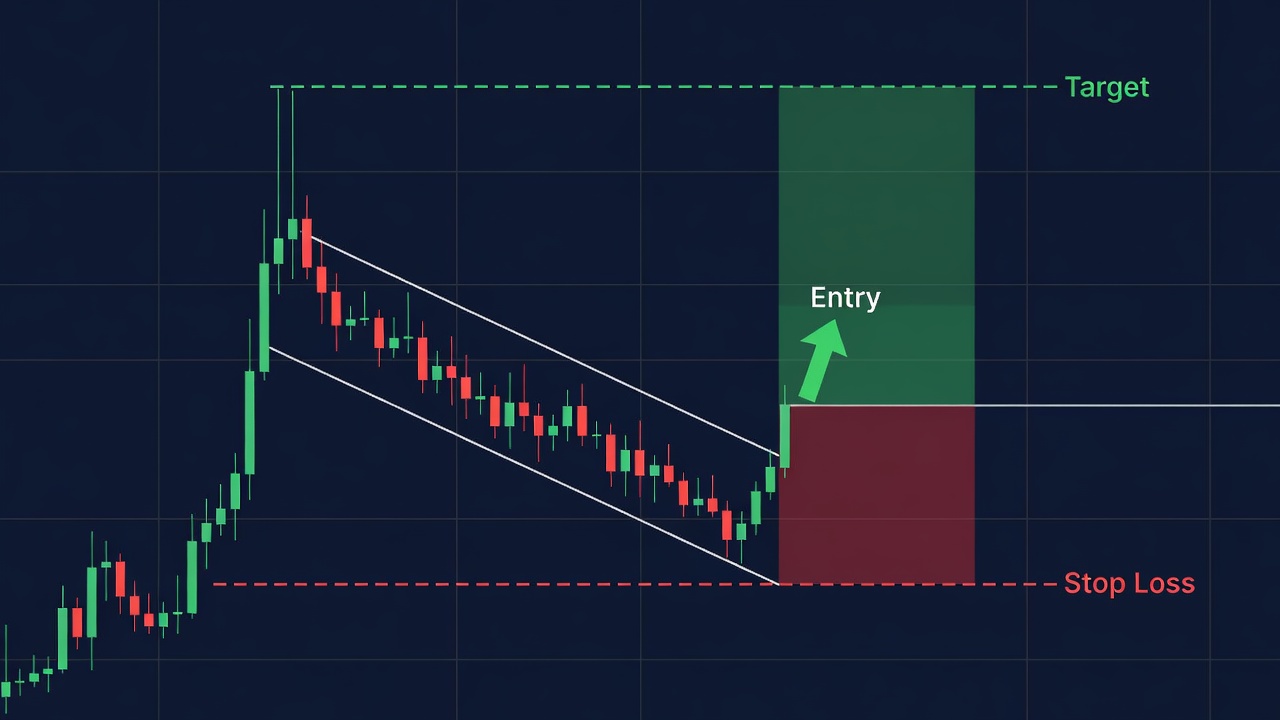
Trading the flag pattern successfully requires a structured execution plan with a pre-defined entry trigger, an objective stop loss, and a mathematically projected target. This disciplined approach removes emotion and ensures a highly positive risk-to-reward ratio.
To execute a bull flag trade, place a buy stop order slightly above the descending channel’s upper resistance line, or wait for a candle to close outside of the channel and enter at the market. For a bear flag, execute a short entry when price closes below the ascending support channel line.
The stop loss must be placed immediately beyond the structure’s invalidation point. Position your stop loss 1 Average True Range (ATR) below the lowest swing low of the consolidation channel for a bull flag, or 1 ATR above the highest swing high of the channel for a bear flag. This buffer prevents premature stop-outs caused by ordinary market noise.
The profit target is calculated using the measured move technique. Measure the vertical height of the preceding flagpole from its swing low origin to its swing high peak. Project this exact distance upward from the lowest point of the consolidation flag (for a bull flag) or downward from the highest point of the flag (for a bear flag). This setup routinely produces a highly favorable risk-to-reward ratio of 2:1 or greater.
Flag Pattern Trade Example: Step-by-Step
To illustrate the execution of this strategy, let us analyze a textbook trade setup using the instructions detailed above. Imagine trading a highly liquid asset on the 4-hour timeframe. The market has been steadily climbing, and suddenly, a surge of buying volume enters, producing four consecutive, massive green candles. This vertical move forms a 100-pip flagpole, rising from a base of $100.00 up to a peak of $110.00.
Following this peak, the asset begins to pull back slowly. The price drifts downward over the next twelve candles, forming a neat, parallel descending channel. This consolidation stops exactly at $106.00, which represents a shallow 40% retracement of the flagpole. The volume dries up significantly during this phase, indicating that sellers are not in control.
Suddenly, a massive bullish candle breaks out of the upper parallel channel line and closes at $107.50 on high volume. This is your entry trigger. You enter a long position at the close of this breakout candle ($107.50). You immediately place your stop loss 1 ATR below the flag’s lowest swing low ($106.00), which lands your stop at $105.20. Your risk on the trade is $2.30 per share. You calculate the target by taking the 10-pip/dollar height of the flagpole and adding it to the low of the flag ($106.00), establishing a take-profit target at $116.00. The trade eventually rallies straight to the target, yielding a clean $8.50 gain against a $2.30 risk, resulting in a stellar 3.7:1 risk-to-reward outcome.
Flag Patterns Across Different Timeframes
While the geometric structure of the flag pattern remains identical, its reliability and execution style vary significantly depending on the timeframe you trade. Higher timeframes, such as the Daily and Weekly charts, produce the most robust and clean flag setups. This is because these intervals filter out intraday market noise and represent significant capital commitments from institutional players. However, flag patterns on daily charts develop over weeks, requiring extreme patience.
Conversely, trading flag patterns on lower timeframes, such as the 5-minute or 15-minute charts, offers far more trading opportunities but comes with a higher rate of false breakouts. Intraday flags are highly sensitive to scheduled macroeconomic news releases and algorithmic spikes. When trading intraday flags, it is essential to restrict your trading to the high-volume hours of the major market sessions when institutional order flow is peak.
Bull/Bear Flags vs. Pennants: Key Differences
Traders frequently confuse flags with pennants, but understanding their distinct visual structures and implications is crucial for accurate execution. While both are short-term continuation patterns that occur after rapid price movements, they diverge in how consolidation is managed.
The Flag Pattern
The flag pattern features a consolidation zone defined by two strictly parallel trendlines that slope against the primary trend. It represents an orderly channel where buyers and sellers maintain a balanced but declining pace of trading until a breakout occurs. Flags typically lead to highly explosive breakouts because the parallel boundaries keep pressure contained within a strict range.
The Pennant Pattern
The pennant pattern features a consolidation zone bounded by converging trendlines, forming a small, symmetrical triangle. It represents a rapid compression of volatility, where both the swing highs and swing lows are aggressively pinched. Pennants usually consolidate faster than flags and resolve in a sharp, explosive burst of momentum as the apex of the triangle is reached.
Best Confluences to Stack With Flag Patterns
You can significantly increase the win rate of flag patterns by trading them only when they align with other key technical indicators. Stacking these factors ensures you are trading with the path of least resistance.
- The 50-Period Exponential Moving Average (EMA): Look for the flag consolidation to find dynamic support or resistance exactly at a rising or falling 50 EMA, validating the trend’s strength.
- Prior Support and Resistance Levels: A flag pattern is highly reliable when the consolidation zone retests a major broken horizontal level from a larger timeframe.
- Volume Profile POC (Point of Control): When the flag consolidates directly on top of a high-volume node, it confirms institutional interest in defending that price area.
- VWAP (Volume Weighted Average Price): For intraday traders, a bull flag pullback that bounces cleanly off the VWAP line signals that institutional buyers are aggressively supporting the average price.
Common Flag Pattern Mistakes to Avoid
Even highly reliable patterns fail when traders misinterpret the market context or execute with poor discipline. Avoid these specific errors to protect your trading capital:
- Chasing the Flagpole: Entering a trade during the vertical flagpole phase due to FOMO (Fear Of Missing Out) rather than waiting for the flag consolidation to develop.
- Trading Loose, Wide Consolidations: Attempting to trade flags where the price action within the consolidation channel is erratic, wide, and lacks parallel boundaries.
- Ignoring a Deep Retracement: Executing a breakout when the flag has retraced more than 50% of the flagpole, which signals structural weakness rather than healthy consolidation.
- Entering Prematurely: Buying or selling inside the flag channel before a candle has officially broken and closed outside the boundaries.
- Neglecting Volume Confirmation: Entering breakouts that occur on low, flat volume, which frequently result in bull traps and bear traps.
The Flag Pattern Trading Checklist
Run through this binary checklist before executing any flag pattern trade. If any answer is “No,” pass on the trade.
- Is there a clear, high-volume, near-vertical flagpole preceding the consolidation? (Yes/No)
- Is the consolidation channel sloping in the opposite direction of the flagpole? (Yes/No)
- Has the consolidation retraced 50% or less of the entire flagpole height? (Yes/No)
- Are the upper and lower boundaries of the consolidation parallel or nearly parallel? (Yes/No)
- Has a candle closed completely outside of the flag boundary to trigger the setup? (Yes/No)
- Is the breakout confirmed by a noticeable increase in trading volume? (Yes/No)
Frequently Asked Questions About Flag Patterns
How reliable is the bull flag pattern?
The bull flag pattern is widely considered one of the most reliable continuation structures in technical analysis when traded in strong trending markets. Its high success rate stems from its requirement for strong institutional momentum (the flagpole) combined with a shallow, orderly profit-taking phase. However, its reliability drops significantly when traded during low-volume, sideways, or highly volatile range-bound markets.
What is the target for a bear flag pattern?
The target for a bear flag is calculated using the classical measured move method. You measure the vertical distance of the preceding bearish flagpole from its initial swing high to its swing low. You then project this exact distance downward starting from the highest swing high point of the bear flag’s consolidation channel.
Can a bull flag pattern fail?
Yes, like all technical structures, a bull flag pattern can fail if market conditions shift. Typical failures occur when a breakout lacks volume, resulting in a bull trap that reverses quickly, or when the consolidation phase retraces too deeply, indicating that sellers have taken control of the market momentum.
What timeframe is best for trading flags?
The daily and 4-hour timeframes are the best intervals for trading flag patterns because they offer the cleanest structural geometry and are highly respected by institutional traders. While flags do occur on intraday charts like the 5-minute timeframe, they are far more susceptible to noise and false breakouts caused by high-frequency trading algorithms.
🎯 Get High-Probability Trade Setups — Free
The Big Dipper Dashboard delivers curated trade ideas straight to your screen every morning. Know what to watch before the opening bell.

📈 Want More? Join Our Free Trading Community
- Trading Strategy Guides Telegram — daily strategy tips and market insights
- Find Better Trades Telegram — free trade signals delivered to your phone
- Find Better Trades on YouTube — live trade breakdowns and tutorials