Ultimate Guide to the Bull Flag and Bear Flag Pattern Trading Guide

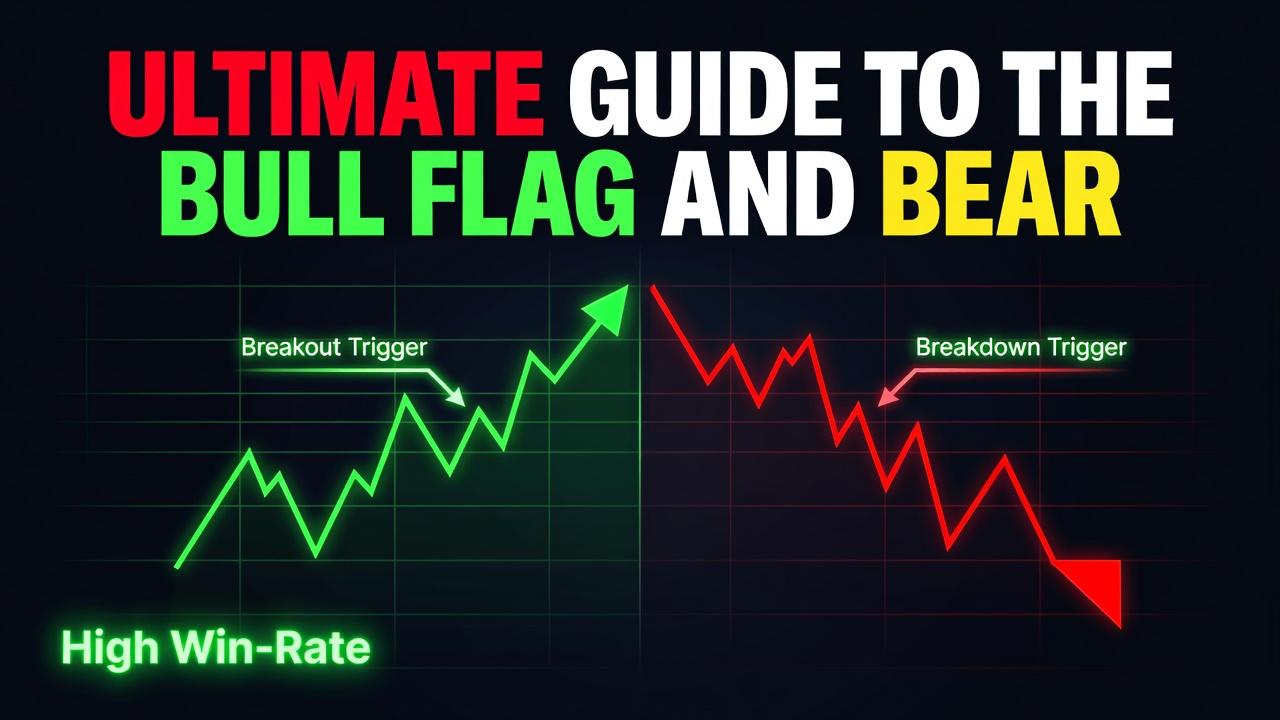
The bull flag and bear flag pattern is a highly reliable trend-continuation setup that signals a brief pause in a powerful market move before price resumes its primary direction. This pattern represents a temporary transfer of inventory from impatient traders to institutional buyers or sellers, making it one of the most profitable setups for breakout and trend-following traders. Whether you trade forex, equities, crypto, or futures, mastering this structural price action pattern is essential for identifying high-probability entry points with tightly defined risk.
- Trend Continuation: Flags are consolidation structures that signal the market is catching its breath before continuing the dominant trend.
- Two Core Components: Every valid pattern requires a near-vertical flagpole followed by a tight, parallel consolidation channel.
- Asymmetric Risk-to-Reward: Stop losses are placed tightly within the flag, while profit targets are projected based on the full height of the flagpole.
- Volume Confirmation: Volume should spike during the flagpole creation, dry up during the flag formation, and surge again on the breakout.
What Is the Bull Flag and Bear Flag Pattern?
The bull flag and bear flag pattern is a technical chart formation that resembles a flag on a pole, signaling that a prevailing trend is poised to resume. First popularized by classical technical analysts in the early 20th century, this pattern reflects a healthy market breathing cycle. It appears across all liquid financial markets when a sudden, aggressive influx of buying or selling pressure catches the market by surprise. Instead of reversing immediately, the market holds its gains or losses, consolidating in a narrow, opposing channel before breaking out. Traders watch for this pattern because it offers a clear visual map of institutional participation and provides an incredibly clean entry trigger with a high historical win rate.
The Market Psychology Behind the Flag Pattern
The visual structure of a flag pattern represents a temporary equilibrium between buyers and sellers where the dominant force is simply absorbing counter-trend orders. In a bull flag, the flagpole is created by institutional buyers aggressively driving the price up, catching late shorts off guard and forcing them to cover. The resulting flag consolidation is not a sign of weakness; rather, it represents profit-taking by early buyers and a lack of aggressive selling pressure. Sellers are unable to push the price down significantly, resulting in a tight, downward-sloping or horizontal channel. When the supply within this channel is completely absorbed, the remaining buyers step back in, shorts are forced to cover their positions, and a massive surge of buying pressure triggers a rapid breakout above the channel resistance.
How to Identify Flag Patterns on a Chart
To accurately identify a valid flag pattern, you must look for a specific geometric relationship between the initial trend thrust and the subsequent consolidation phase. Many novice traders mistake weak, random market drift for flag patterns, leading to frequent losses on false breakouts. To avoid this, you must train your eyes to look for explosive momentum followed by orderly, tight range contraction.
The Flagpole
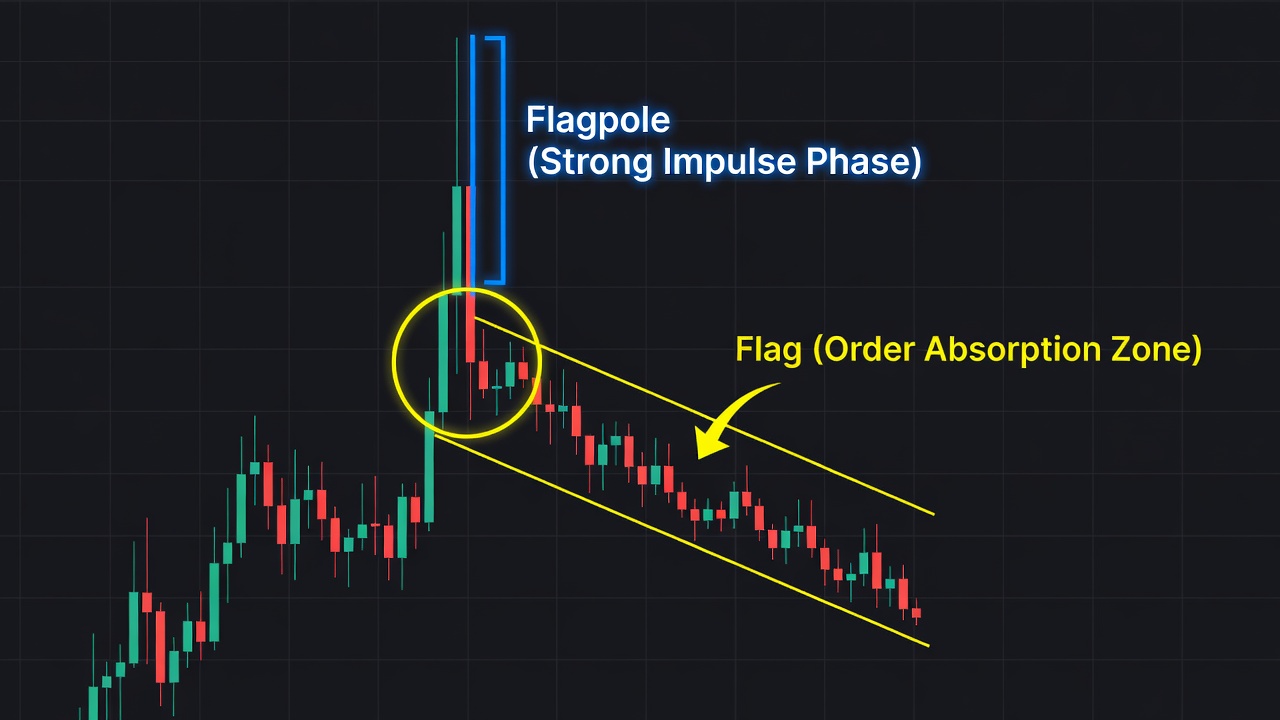
The flagpole is the foundation of the pattern and must represent a clear, near-vertical price thrust. This phase should consist of large, healthy trend candles with minimal wicks, showing that one side of the market is in complete control. If the initial move is sluggish, overlapping, or filled with indecisive doji candles, it is not a valid flagpole.
The Flag Consolidation
The flag itself is a corrective channel that slopes against the direction of the flagpole. For a bull flag, the channel must slope downward; for a bear flag, it must slope upward. The price action within the flag must be overlapping and contained within two parallel trendlines. If the consolidation retraces more than 50% of the flagpole’s length, the pattern is compromised and should be discarded.
The Breakout Candle
The pattern is only confirmed when a candle closes completely outside of the flag’s parallel channel. This breakout candle must be strong, ideally closing near its absolute high (for bull flags) or low (for bear flags). It serves as the ultimate signal that the corrective phase has ended and the dominant trend has officially resumed.
The Exact Flag Pattern Setup Criteria
Every high-probability flag trade must satisfy a strict set of structural rules before you risk a single dollar of capital. Do not bend these rules; consistency in identification is the key to consistency in performance.
- Trend Alignment: The overall market trend on your trading timeframe and the next higher timeframe must align with the direction of the flag (bullish for bull flags, bearish for bear flags).
- Impulsive Flagpole: The flagpole must consist of consecutive, strong candles with high volume, representing a swift, decisive price move.
- Tight Consolidation: The flag body must retrace no more than 38.2% to 50% of the flagpole’s height. Deep retracements indicate weak structural support.
- Parallel Channel: The flag boundaries must be defined by parallel or near-parallel support and resistance lines, not widening boundaries.
- Volume Signature: Volume must contract significantly during the formation of the flag, showing a lack of participation on the counter-trend move.
- Clear Breakout Close: A candle must close decisively outside the flag channel on high volume to trigger the trade.
How Do You Trade the Flag Pattern? (Entry, Stop Loss, Target)
Trading flag patterns successfully requires executing a precise entry trigger, placing an objective stop loss, and setting a mathematically sound target. You should never guess when a flag is finished; wait for the market to confirm its next move.
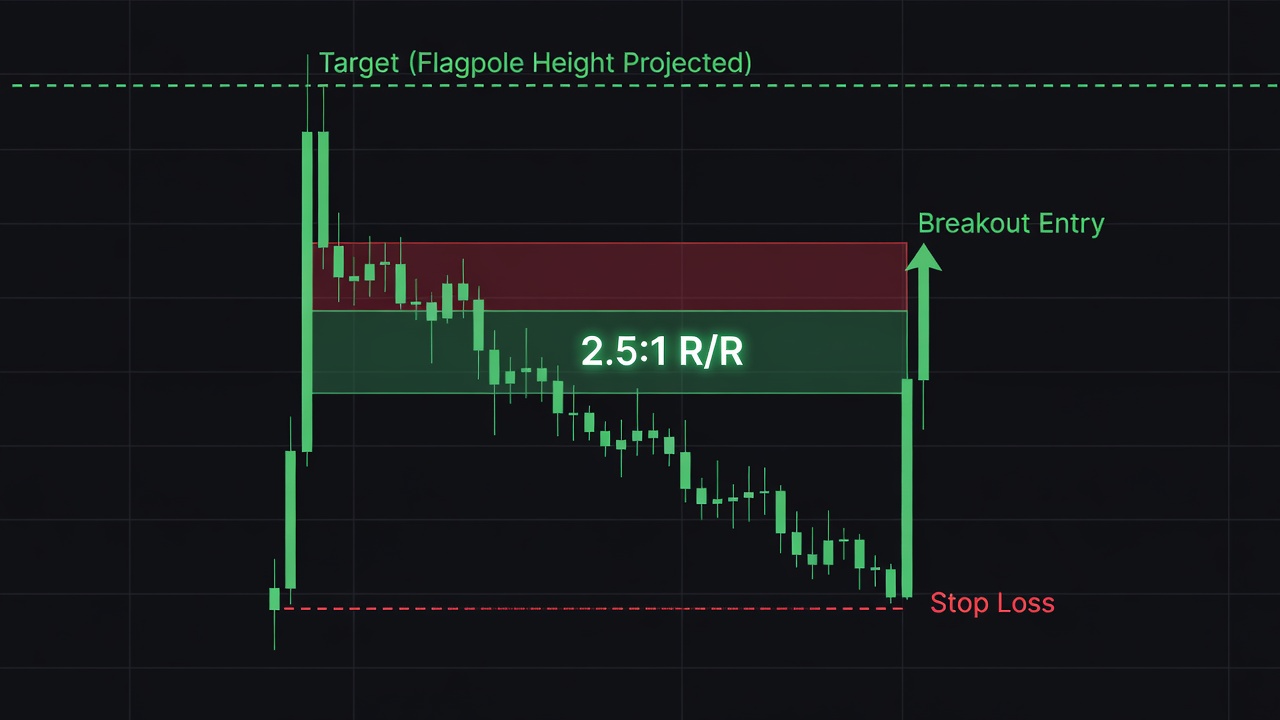
To execute a bull flag trade, wait for a candle to close above the upper resistance trendline of the flag. This is your breakout entry signal. Enter the market immediately at the close of that breakout candle. Alternatively, aggressive traders may place a buy-stop order just above the highest swing high of the flag structure.
Your stop loss must be anchored to a structural level where the pattern is mathematically invalidated. Place your stop loss 1 ATR (Average True Range) below the lowest point of the flag consolidation channel. If the price drops back below this level, the flag structure has failed, and you must exit the trade immediately without hesitation.
To calculate your profit target, use the measured move method. Measure the height of the preceding flagpole from its swing low to its swing high. Project that exact distance upward, starting from the lowest swing low of the flag consolidation phase. This provides an objective, highly achievable target. This setup routinely yields a risk-to-reward ratio of 2:1 or better, making it an incredibly lucrative addition to your playbook.
Flag Pattern Trade Example: Step-by-Step
Let us walk through a highly detailed, realistic trade scenario to demonstrate exactly how to manage this pattern in real-time. Imagine you are monitoring the 4-Hour chart of an asset. The asset has been in a sustained, orderly uptrend for several weeks. Suddenly, a massive influx of buying volume enters the market, driving the price from a swing low of $100 up to a swing high of $120 in just four candles. This rapid $20 surge represents a textbook, high-momentum flagpole.
Over the next twelve candles, the aggressive buying stops. The price begins to drift slowly lower, forming a tight, orderly, downward-sloping channel. This channel is bound by two parallel trendlines, with the price bouncing cleanly between them. The lowest point reached during this consolidation phase is $112, which represents an incredibly healthy 40% retracement of the original $20 flagpole move. During this consolidation, trading volume drops to less than half of what was seen during the upward surge, indicating that sellers are not aggressively pushing the price down.
On the thirteenth candle, a massive surge of buying volume enters the market. A strong bullish candle breaks out of the upper parallel trendline of the flag and closes decisively at $115. This is your official entry signal. You enter a long position at the close of this candle at $115. You immediately place your stop loss at $110, which is just below the consolidation low of $112. To calculate your profit target, you take the $20 height of the flagpole ($120 minus $100) and project it upward from the consolidation low of $112, giving you an exact profit target of $132. Your potential risk is $5 per share, while your potential reward is $17 per share, representing an exceptional 3.4:1 risk-to-reward ratio. Over the next several sessions, the upward momentum carries the price directly to your target of $132 for a highly profitable exit.
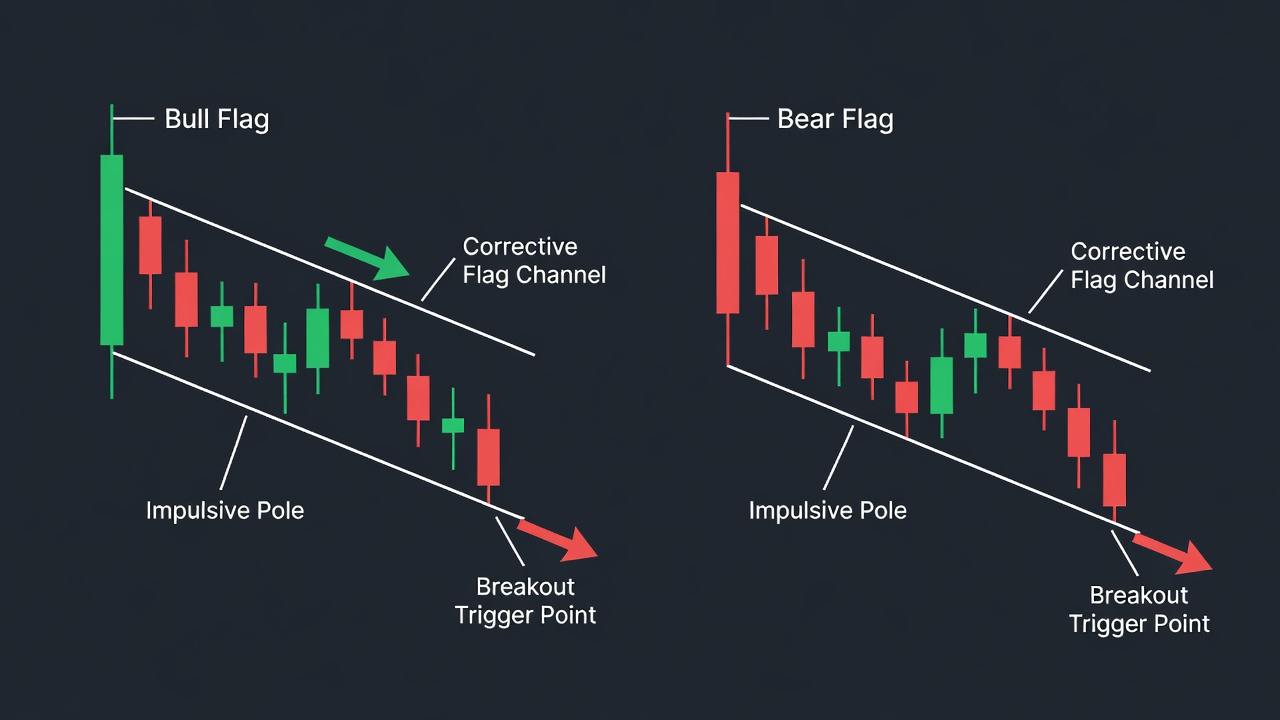
Flag Patterns Across Different Timeframes
While flag patterns are structurally identical across all charts, their reliability, duration, and noise levels vary dramatically between different timeframes. Understanding these structural nuances is critical for selecting the right timeframe for your personal trading style.
On lower timeframes, such as the 1-minute or 5-minute charts, flags occur constantly throughout the day. However, these intraday flags are highly susceptible to market noise, spread costs, and sudden algorithmic spikes, leading to frequent false breakouts. On the 1-hour and 4-hour charts, flags are incredibly clean, balancing reliable structural data with a healthy frequency of trade setups. On the daily and weekly charts, flag patterns are incredibly powerful and rarely fail, as they represent major institutional accumulation or distribution phases. However, these higher-timeframe setups require massive patience, wider stop losses, and can take weeks or months to fully materialize.
Flag vs. Pennant: Key Differences
Traders frequently confuse flags with pennants because both are short-term continuation patterns that occur after a strong, impulsive price move. However, their structural geometry and psychological implications are completely distinct.
The Flag Pattern
The flag is defined by a consolidation phase that forms a clear, parallel channel sloping against the dominant trend. It represents a systematic absorption of counter-trend orders over a sustained period, keeping the trading range relatively wide and constant throughout the consolidation.
The Pennant Pattern
The pennant is defined by a consolidation phase that forms a small, symmetrical triangle with converging trendlines. It represents a rapid compression of volatility, where both buyers and sellers are squeezed into a tight apex before an explosive breakout occurs, usually over a shorter duration than a typical flag.
Best Confluences to Stack With Flag Patterns
To maximize your win rate, you should never trade flag patterns in isolation; instead, stack them with high-quality technical confluence factors. Stacking these factors significantly filters out false breakouts.
- Support and Resistance Levels: A bull flag consolidation that bottoms out exactly at a major horizontal support level or prior resistance-turned-support zone is highly likely to hold and break out successfully.
- Moving Averages (50/200 EMA): When a flag consolidates directly into a rising 50-period or 200-period Exponential Moving Average, the moving average acts as a dynamic springboard for the breakout.
- Fibonacci Retracement Levels: A flag consolidation that finds support precisely at the 38.2% or 50% Fibonacci retracement level of the flagpole has perfect mathematical backing for a trend continuation.
- Volume Spikes: A massive breakout volume signature that is at least 1.5 times the average volume of the preceding ten candles strongly confirms institutional backing.
Common Flag Pattern Mistakes to Avoid
Many traders lose money with flag patterns because they execute them incorrectly. Avoid these common pitfalls to protect your capital:
- Trading inside the flag: Entering positions before a daily or hourly candle has closed completely outside of the flag boundaries is gambling on a breakout before it actually happens.
- Ignoring deep retracements: Trading flags where the consolidation phase retraces more than 50% of the flagpole’s height, as this shows a lack of aggressive trend control.
- Chasing parabolic moves: Entering a flag trade when the flagpole is massive, exhausted, and the market is already severely overextended, leaving no room for a healthy breakout.
- Neglecting volume: Trading breakouts that occur on low, flat, or declining volume, which frequently result in highly painful bull or bear traps.
- Placing stops too tight: Placing your stop loss directly at the boundary of the flag instead of allowing breathing room below the structural swing low.
Flag Pattern Checklist
Before executing any flag trade, run through this quick checklist. If any answer is “No,” do not take the trade.
- Is there a clear, near-vertical, high-volume flagpole preceding the consolidation? (Yes/No)
- Is the consolidation channel neat, orderly, and bound by parallel trendlines? (Yes/No)
- Has the consolidation retraced less than 50% of the flagpole’s total length? (Yes/No)
- Has a candle closed completely outside of the flag boundaries to confirm the breakout? (Yes/No)
- Does the trade setup offer a minimum of a 2:1 projected risk-to-reward ratio? (Yes/No)
Frequently Asked Questions About Flag Patterns
What is a bull flag pattern?
A bull flag pattern is a bullish continuation chart pattern that consists of an initial sharp, upward price move (the flagpole) followed by a downward-sloping, parallel consolidation channel (the flag). The pattern is confirmed when the price breaks out and closes above the upper boundary of the consolidation channel, signaling that buyers have resumed control and are driving the price higher.
How do you trade a bear flag pattern?
To trade a bear flag pattern, you must wait for a candle to close decisively below the lower support line of the upward-sloping consolidation channel. Enter a short position at the close of this breakout candle, place your stop loss 1 ATR above the highest point of the flag consolidation, and project your profit target downward by measuring the exact height of the preceding flagpole.
Why do flag patterns fail?
Flag patterns typically fail when they are traded in the wrong market context, such as during low-liquidity conditions or against the dominant higher-timeframe trend. Additionally, flags fail when the consolidation retraces too deeply into the flagpole, indicating a lack of institutional interest, or when traders enter prematurely without waiting for a confirmed breakout close on high volume.
What is the target for a flag pattern?
The target for a flag pattern is calculated using the measured move technique. You measure the absolute distance from the start of the trend impulse to the peak of the flagpole, then project that same distance in the direction of the breakout, starting from the lowest or highest point of the flag consolidation channel.
🎯 Get High-Probability Trade Setups — Free
The Big Dipper Dashboard delivers curated trade ideas straight to your screen every morning. Know what to watch before the opening bell.

📈 Want More? Join Our Free Trading Community
- Trading Strategy Guides Telegram — daily strategy tips and market insights
- Find Better Trades Telegram — free trade signals delivered to your phone
- Find Better Trades on YouTube — live trade breakdowns and tutorials