Ultimate Guide to the Bull Flag and Bear Flag Pattern Trading Guide

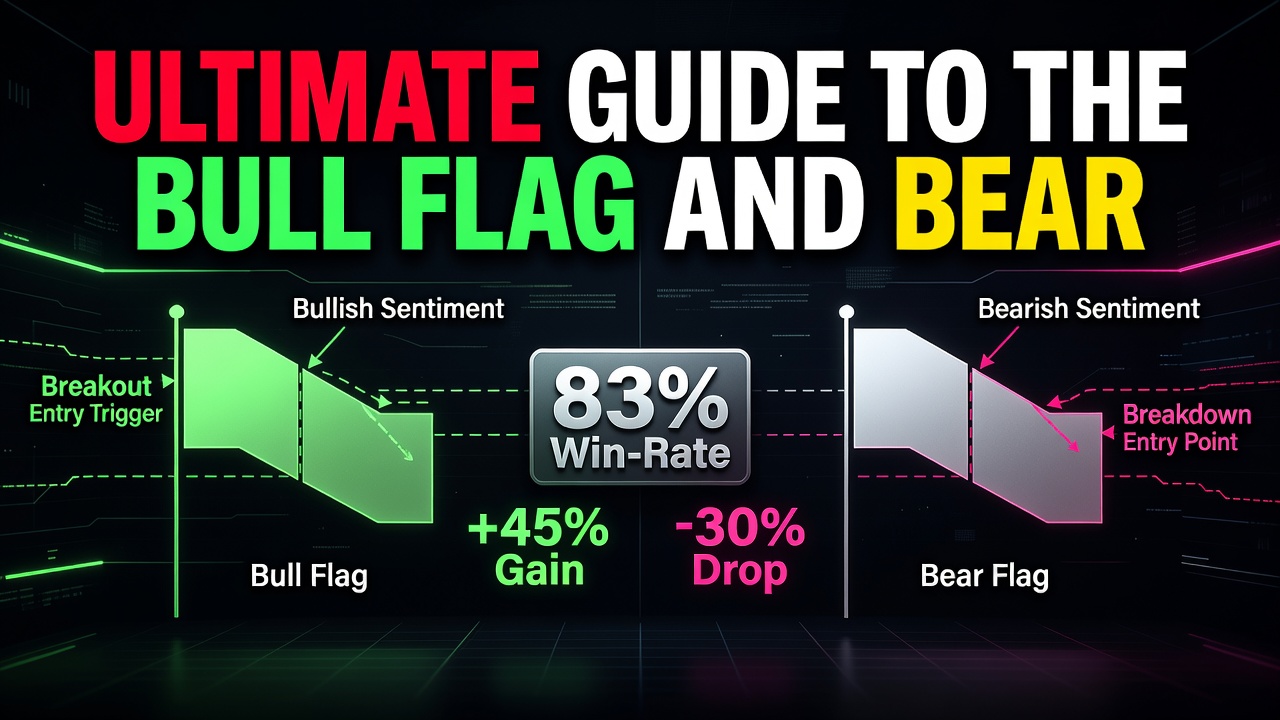
The bull flag and bear flag pattern is a high-probability continuation setup that signals a brief pause in a powerful market trend before the prevailing momentum resumes. This reliable price action formation represents a temporary transfer of assets from impatient sellers to aggressive buyers during an uptrend, or vice versa during a markdown phase. Professional traders utilize this structural geometry across all liquid asset classes to identify low-risk entry points with exceptionally high asymmetry.
- Trend Continuation: The pattern acts as a temporary pit stop within an established, high-velocity trend.
- Asymmetric Risk-to-Reward: Traders can define exceptionally tight stop-loss placements just outside the flag structure.
- Two Distinct Phases: Every valid pattern requires a high-volume flagpole followed by a low-volume, orderly consolidation channel.
- Universal Application: The setup forms reliably across any liquid timeframe, including equities, forex, crypto, and futures.
What Is the Bull Flag and Bear Flag Pattern?
The bull flag and bear flag pattern is a classic chart formation discovered and documented during the early days of technical market analysis. It visually resembles a flag on a pole, where the flagpole represents a near-vertical price shock and the flag represents a tight, sloping consolidation channel. Traders watch for this pattern because it highlights a market that is temporarily storing energy before unleashing another leg in the direction of the dominant trend. It appears when institutional momentum dominates the order book, creating a imbalance that retail traders can exploit by entering on the subsequent breakout.
The Market Psychology Behind the Flag Patterns
The internal mechanics of a flag pattern reflect a fierce battle of order flow where the dominant side temporarily steps back to let latecomers exhaust themselves. In a bull flag, the flagpole is formed when institutional buying sweeps the offer book, leaving no time for pullbacks. Once this initial buying surge exhausts itself, early buyers begin taking profits, and counter-trend short-sellers attempt to pick a top. This profit-taking and speculative shorting creates the downward-sloping flag channel. However, because the underlying order flow remains heavily bullish, the selling pressure is weak, resulting in shallow, low-volume downward candles. When the sellers run out of inventory, buyers aggressively step back in to drive price above the channel resistance, trapping the short-sellers and triggering a massive cascade of buy-stop orders that fuels the next leg up.
How to Identify the Flag Patterns on a Chart
Identifying a valid flag pattern requires strict adherence to visual geometry to avoid entering false consolidations or weak trading ranges. You must look for a highly specific relationship between the momentum phase and the consolidation phase.
The Flagpole
The flagpole must be a rapid, near-vertical price expansion. This phase should consist of large, healthy trend candles with minimal wicks, indicating that one side has complete control of the market. Avoid setups where the initial move is choppy, overlapping, or sluggish.
The Flag Body
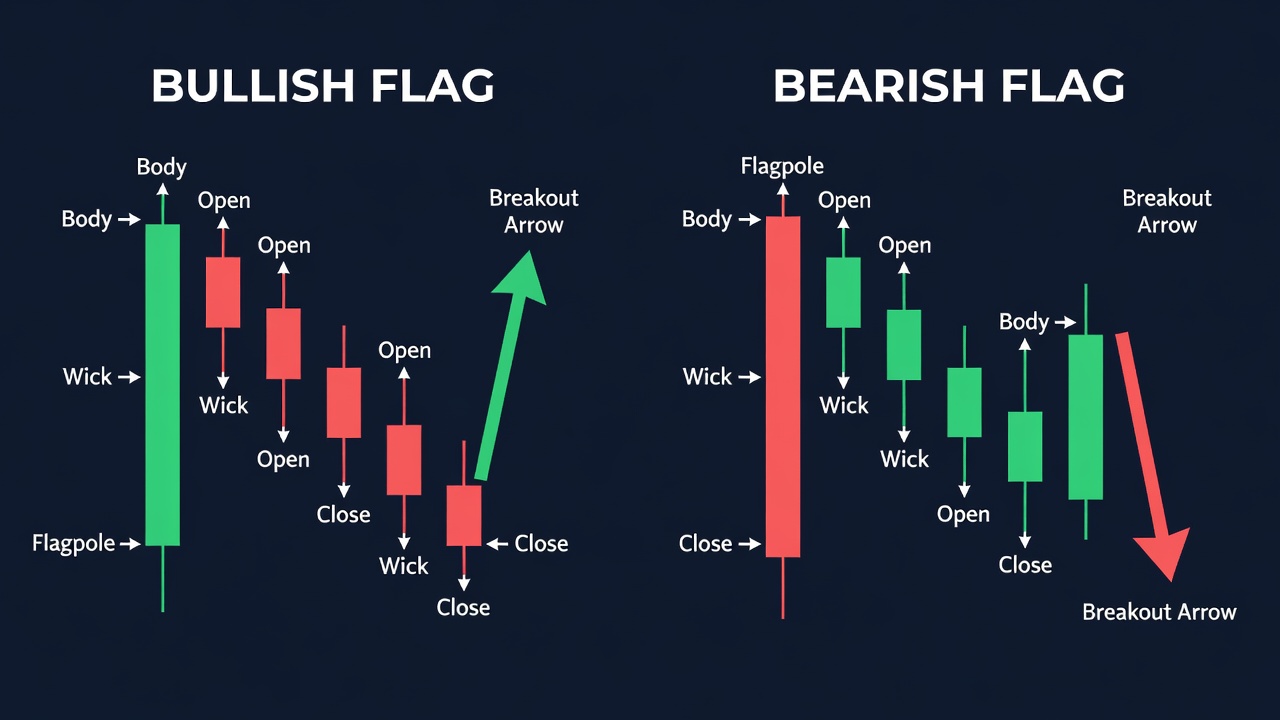
The consolidation channel must slope against the direction of the flagpole. For a bull flag, the channel must slope downward; for a bear flag, the channel must slope upward. If the consolidation slopes in the direction of the trend, it is a weak continuation pattern that is highly prone to failure.
The Boundary Lines
The upper and lower boundaries of the flag body must run parallel, or nearly parallel, to each other. This shows orderly profit-taking rather than highly volatile, unpredictable price action. The price action within the flag should remain relatively tight and contained.
The Exact Flag Pattern Setup Criteria
To ensure a high win rate, a pattern must satisfy several strict structural rules before you risk capital. If any of these conditions are missing, the setup must be discarded immediately.
- Timeframe selection: The setup is highly reliable on the 15-minute, 1-hour, 4-hour, and Daily charts; lower timeframes are prone to excessive noise and false breakouts.
- Trend alignment: The pattern must align with the higher-timeframe trend; do not trade a bull flag if the daily chart is in a structural downtrend.
- Flagpole magnitude: The flagpole must represent a significant, high-volume expansion move that stands out clearly from the surrounding average true range (ATR).
- Consolidation depth: The flag retracement must not exceed 50% of the flagpole height; a retracement deeper than 50% indicates structural weakness rather than healthy consolidation.
- Volume profile: Volume must dry up noticeably during the formation of the flag channel, followed by a dramatic volume spike on the breakout candle.
How Do You Trade the Flag Patterns? (Entry, Stop Loss, Target)
Executing a flag trade requires precision entry triggers and an absolute defense point to protect your trading capital from sudden reversals. There are two professional methods for executing these setups depending on your risk tolerance.
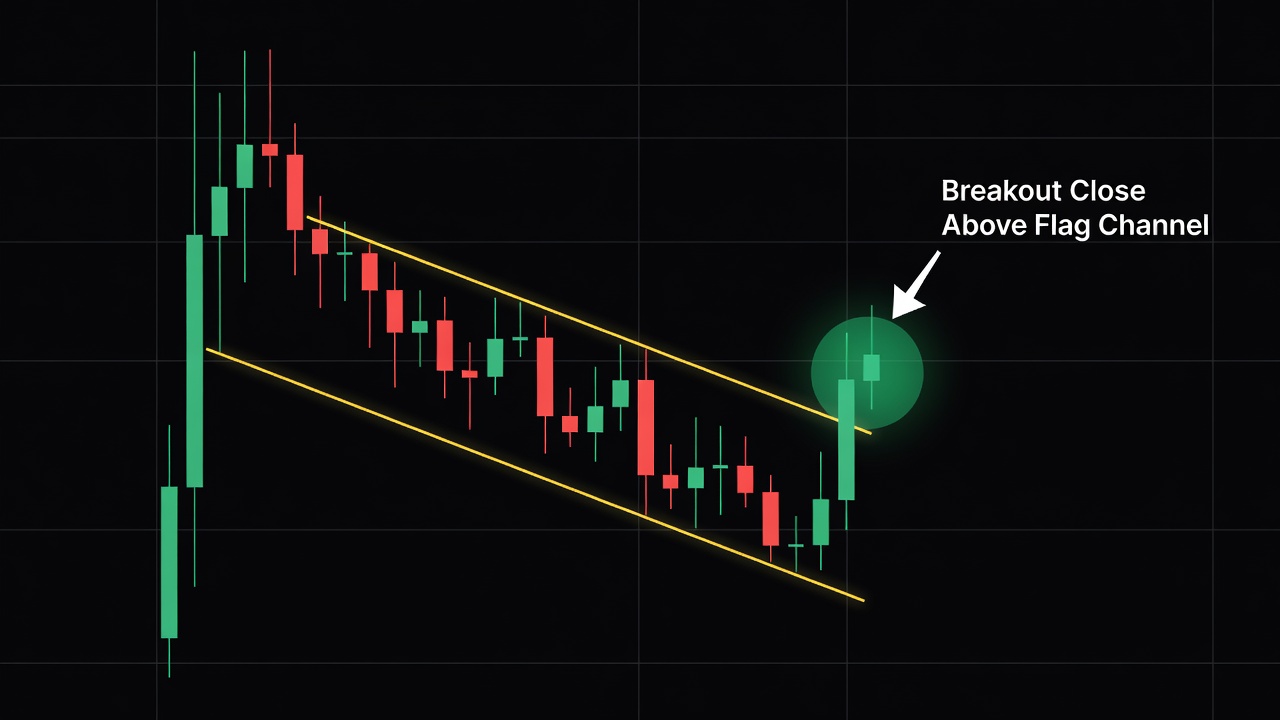
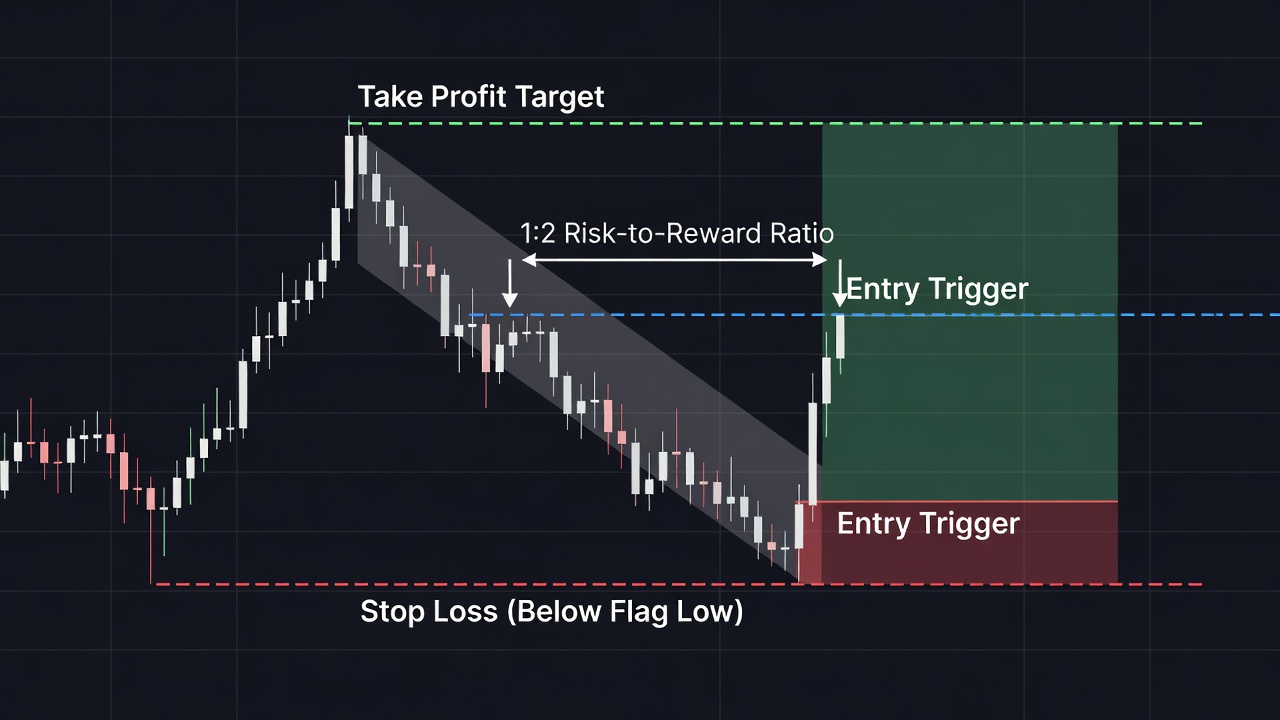
The aggressive entry method requires placing a buy-stop order just above the upper boundary of the bull flag (or a sell-stop below the lower boundary of a bear flag). The conservative, highly recommended method is to wait for a candle to close outside of the flag channel on your execution timeframe. Enter immediately at the close of that breakout candle, provided it is accompanied by expanding volume.
Your stop loss must be anchored structurally to prevent being shaken out by minor volatility. Place your stop loss 1 ATR below the lowest point of the flag consolidation channel for a bull flag, or 1 ATR above the highest point of the consolidation channel for a bear flag. This ensures that your trade is only invalidated if the pattern truly fails.
To determine your profit target, use the measured move method. Measure the height of the initial flagpole from its swing low to its swing high. Project that exact distance upward from the lowest point of the flag consolidation channel. This projection provides a highly reliable target that frequently offers a minimum of a 1:2 risk-to-reward ratio.
Flag Pattern Trade Example: Step-by-Step
Let us analyze a highly successful trade execution on a liquid asset using the 1-hour chart to demonstrate how these mechanics function in real-time. As you can see in the annotated chart above, the asset entered a powerful markup phase, driven by aggressive institutional demand. The price rallied sharply from a swing low of $100 to a swing high of $120 over the course of just three trading sessions, forming a clean, high-volume $20 flagpole.
Immediately after hitting the $120 high, early buyers began booking profits, and the price entered an orderly, downward-sloping consolidation channel. Over the next twelve hours, the price printed smaller candles that pulled back gently to a low of $112, representing a shallow 40% retracement of the flagpole. During this consolidation, trading volume dried up to less than half of the volume seen during the vertical rally, signaling that sellers lacked any real conviction.
An entry was triggered when a strong 1-hour candle broke above the upper parallel trendline of the flag and closed at $115.50 on a significant surge in volume. The stop loss was placed at $110.50, which was exactly 1 ATR below the lowest point of the flag consolidation ($112). The target was calculated by projecting the $20 flagpole height from the consolidation low of $112, resulting in a take-profit target of $132. The trade progressed steadily upward, hitting the $132 target within 24 hours, yielding a clean 3.3:1 risk-to-reward ratio.
Flag Patterns Across Different Timeframes
While flag patterns are structurally identical across all timeframes, their reliability and the speed of their execution vary dramatically. Understanding these timeframe differences is crucial for aligning the pattern with your personal trading style.
On intraday charts like the 5-minute or 15-minute, flags form rapidly and offer frequent opportunities. However, they are highly susceptible to market noise, algorithmic stop-hunts, and false breakouts. On the 1-hour and 4-hour charts, flags are highly reliable because they represent true multi-hour order flow shifts rather than temporary liquidity imbalances. On the daily and weekly charts, flag patterns are incredibly powerful and rarely fail, as they reflect macroeconomic trends and major institutional accumulation phases. However, they require patience and much wider stop-loss placements to accommodate normal daily volatility.
Bull Flag vs. High Tight Flag: Key Differences
Traders frequently confuse the standard bull flag with the rare and explosive high tight flag pattern, leading to improper risk management. It is vital to distinguish between these two structures.
The Standard Bull Flag
The standard bull flag occurs within an established, steady trend. The flagpole is strong but not excessive, typically representing a 10% to 20% move. The consolidation phase can retrace up to 50% of the flagpole and can last from a few days to several weeks. This pattern is reliable, common, and suitable for conservative swing traders.
The High Tight Flag
The high tight flag is an extremely aggressive momentum pattern. The flagpole must represent a massive price surge of 100% or more, occurring in a very short period. The subsequent consolidation is incredibly tight, retracing no more than 10% to 20% of the massive pole. Because the asset refuses to sell off despite a doubling in price, this pattern is highly explosive and frequently leads to massive breakout extensions, though it carries a much higher risk of failure.
Best Confluences to Stack With Flag Patterns
Stacking multiple technical filters alongside your flag pattern dramatically increases your win rate and filters out low-quality setups. Never trade a flag in a vacuum.
- 50-period Exponential Moving Average (EMA): Look for the flag consolidation to find support directly at a rising 50 EMA on your chart, indicating dynamic trend support.
- Prior Resistance Turned Support: The flag channel should ideally form right on top of a major broken horizontal resistance level, utilizing old supply as new demand.
- Volume Divergence: Ensure that volume steadily decreases as the flag channel forms, showing that market participants are refusing to sell the asset at lower prices.
- Fibonacci Retracement Levels: A high-quality flag will terminate its consolidation exactly at the 38.2% or 50% Fibonacci retracement levels of the flagpole.
Common Flag Pattern Mistakes to Avoid
Most retail traders lose money with flag patterns because they execute them incorrectly or trade poor variations of the structure. Avoid these costly pitfalls to protect your account balance:
- Trading a flag where the consolidation retraces more than 50% of the flagpole.
- Entering a flag that slopes in the same direction as the initial flagpole.
- Chasing a breakout after the breakout candle has already extended far past the entry trigger.
- Ignoring declining volume during the consolidation phase.
- Trading flags during major high-impact news releases when liquidity is thin.
- Placing the stop loss too close to the entry without accounting for market ATR.
Flag Pattern Checklist
Run through this binary checklist before executing any flag pattern trade to ensure total alignment with professional standards.
- Is the flagpole a sharp, high-volume, near-vertical move? (Yes/No)
- Does the flag consolidation slope counter to the direction of the flagpole? (Yes/No)
- Has the flag retraced less than 50% of the total flagpole height? (Yes/No)
- Did volume visibly dry up during the formation of the flag channel? (Yes/No)
- Has a candle closed completely outside the flag boundary line on high volume? (Yes/No)
- Is your stop loss anchored structuraly below the flag’s swing low? (Yes/No)
- Does the calculated target offer at least a 1:2 risk-to-reward ratio? (Yes/No)
Frequently Asked Questions About Flag Patterns
What is the success rate of a bull flag pattern?
The success rate of a bull flag pattern typically ranges between 60% and 70% when traded in a strong, aligned higher-timeframe trend. This rate decreases significantly if the consolidation retraces too deeply or if the pattern is traded during low-volume market conditions.
How long should a flag consolidation last?
A valid flag consolidation should be relatively brief compared to the overall trend. On daily charts, the consolidation typically lasts between one to three weeks; on intraday charts, it should consist of approximately 8 to 20 candles before breaking out.
Can you trade flag patterns on crypto and forex?
Yes, flag patterns are highly effective in both forex and crypto markets because these assets are highly driven by momentum and institutional order flow. The same visual rules, volume profiles, and risk management criteria apply across these asset classes.
What is the difference between a flag and a pennant?
The main difference lies in the shape of the consolidation. A flag pattern features parallel upper and lower trendlines, while a pennant features converging trendlines that form a small symmetrical triangle. Both are continuation patterns with identical targets.
🎯 Get High-Probability Trade Setups — Free
The Big Dipper Dashboard delivers curated trade ideas straight to your screen every morning. Know what to watch before the opening bell.

📈 Want More? Join Our Free Trading Community
- Trading Strategy Guides Telegram — daily strategy tips and market insights
- Find Better Trades Telegram — free trade signals delivered to your phone
- Find Better Trades on YouTube — live trade breakdowns and tutorials