Day Trading Price Action: Simple Price Action Strategy

Have you been looking for a strong, simple, and successful price action trading strategy? This day trading price action strategy will teach you how to spot dead zones, red zones, and end zones. Also, be ready to hear some Football terminology!
This may sound a bit complex but, trust me, you are going to want to pay special attention to this trading strategy. It might be all you need to become a full-time trader.

Thanks for visiting Trading Strategy Guides (TSG)!
You have discovered the most extensive library of trading content on the internet. Our aim is to provide the best educational content to traders of all stages.
Learn Our Trading Best Strategy By our Founder Casey Stubbs
In other words, we want to make YOU a consistent and profitable trader.
If you’re a brand new trader, we recommend hopping over to our ultimate beginner’s guide to trading to learn more.
Price action trading is very straightforward. Instead of relying on fundamental indicators (qualitative stories or information in the news) or indicators that are typically lagging, price action traders focus on the actual price movements.
The relationship between ongoing price movements and current price levels is strong. Day trading price action strategies are ideal for day traders due to the fact they use information that accumulates in real-time. Here at Trading Strategy Guides, we will help you discover how to make quick trading decisions and how to become an effective price action trader.
In fact, we could run an entire day trading price action course on this single approach to trading. We think we have uncovered the best price action trading strategy. Therefore, make sure you read, study, and take notes on this approach to trading. Also, please leave a comment below to give us some feedback. We will do our best to answer your questions.
Check out this article on Forex trading for beginners as well!
This is a stock price action strategy, a forex price action strategy, and an options trading strategy. The pure price action trading system needs no price action indicator to help you trade.
Table of Contents
Introduction: What Is Price Action Trading?
Price action is simply how the price will react at certain levels of resistance or support. It is the action of the price of a currency pair (or other instruments). This technical analysis approach will help you learn things from price history. You’ll learn how to identify the swing high/swing low, trend lines, and past support or resistance areas.
Now, this could be the price of testing a support or resistance level. It could even be when the price movement creates a swing high or swing low.
Price action trading requires no lagging indicators or moving averages to distract you from the price. The chart will have a clean look to it. It’s refreshing sometimes to see a clean chart with no indicators. In fact, some traders make a living without ever looking at an indicator.
Make sure to read our guide to day trading Forex as well!
Price action is displayed in the form of the candles on a chart and the interaction of those candles with each other. People who are strict “Price Action” traders have also been humorously called “Naked Traders.” They trade with charts that are naked of any other indicators other than the price candles.
Moreover, price action (or PA) traders use only historical price levels and candle patterns to determine trade entry and exit levels. Some more progressive PA traders may also use trend lines and Fibonacci measurements, but these are still based on the price action.
Price action trading also involves taking trades when the price shows reactions at critical price levels.
You can start by looking left on your chart for significant levels (usually “violent” price rejection in the form of “pin bars”) where you can expect the price to react.
The higher the time frame you find these levels, the more significant they will be. You are likely to get bigger reactions from higher time frame price levels.
I don’t plan on showing you each and every price action pattern, just the ones that are my personal favorites. Simple descriptions of price action patterns can be found in any number of places on the internet.
My plan is to show you actual patterns and levels that I found on the charts today (or yesterday.) They’re not pretty or perfect, but they demonstrate the concepts of price action trading.
What Are the Best Price Action Indicators?
You can apply moving averages, MACD, stochastic, RSI, Fibonacci retracement, Bollinger bands, and more to your charts. Keep in mind, when you are searching for the red zones based on this strategy, these indicators could distract you and cause you to make bad trading decisions. So, with that being said, we don’t recommend using a specific indicator for this strategy.
If you do decide to use them, some common technical indicators used by today’s traders include:
- Moving average indicators allow you to easily identify the “average” price of an asset over a specific period of time. Simple moving averages focus solely on the mean price within a time period. Exponential and weighted moving averages adjust for the fact that recent information is more relevant.
- Moving Average Convergence Divergence (MACD) is a momentum indicator that compares moving averages to an easy-to-read “buy line.” Once the moving average has moved above this line, you may want to consider opening a new position.
- The Stochastic oscillator is another momentum indicator that allows you to see if current price trends deviate from the expected norm. It was developed by George Lane in the 1950s and is characterized by its clear buy and sell signals.
- Relative Strength Index (RSI) is an index that measures whether an asset is overbought or oversold, using a scale ranging from 1 to 100. As the RSI approaches the more extreme ends of the scale, the risk of trading decreases.
- Fibonacci retracement is another method for gauging support and resistance. Using time-tested Fibonacci patterns, traders can get a more nuanced view of the market.
- Bollinger bands are bands that make it easier to identify the price channel an asset typically trades within. When prices move toward the edges of this channel, they will either break out (requiring further analysis) or return to the expected norm.
While these indicators can be very useful in certain circumstances, you should also be cautious when using them as a price action trader. Our price action trading strategies will be much more focused on finding “red zones” rather than focusing on the raw application of technical indicators.
The main risk of using indicators (explained below) is that they tend to “lag” behind—each of these indicators is derived using historical data. This is something that can be distracting to you as a price-action trader. Be careful of trading solely off of these signals. Use your indicators as a second data point in tandem with the price action strategy for best results.
What Are Leading & Lagging Indicators?
You’ve probably heard about leading and lagging indicators. Calling something a “leading” indicator seems to say that the indicator “leads” the market, and market direction can easily be predicted by a “leading” indicator.
A “lagging” indicator suggests that the indicator doesn’t really indicate anything current but shows only historical direction.
I believe both of these terms are bogus and misleading.
I suggest that all technical indicators are lagging. They express what has happened in the past. For a forex technical indicator to be leading, it would have to use either a crystal ball or time travel technology.
It could be argued that some fundamental indicators can be considered leading where traders take trades in a certain direction based upon those “fundies.” Even still, fundamental indicators (news, data releases, etc) still represent historical information.
Now that I’ve said all that, all we have to use to predict future market movement is historical market movement. What’s the best way to summarize historical market movement? Indicators, more precisely, lagging indicators.
So, don’t be fooled by rhetoric about “leading” and “lagging” indicators. These indicators serve the purpose of showing us how current price action relates to prior price action.
However, always remember that “Price Action Is King.” Use indicators to show you levels where historically significant price action has occurred and anticipate that similar price action could occur at these same locations. Current price action is the most important thing.
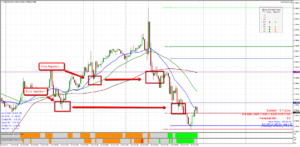
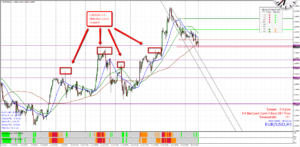
Daily and weekly levels are particularly important. That’s why I mark those levels on my charts.
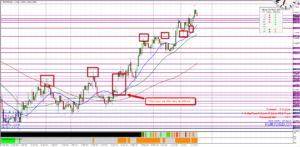
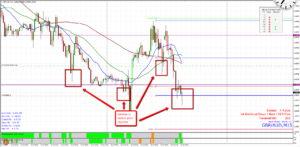
If you can identify a trading range early on (defined by 4 points, 2 up and 2 down), you can play reversals at the up and lower levels of the range. You can continue to do so until there is a confirmed break of the range.
Then, you can trade in the direction of the break. You can watch the price action as it approaches the edges of the range and see how the price exhaustion (RSI) affects and is affected at these levels.
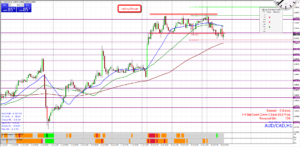
I had a mentor who taught me how to scalp. He used to say that you should always be prepared to trade when the price is extremely out of place and when the price is where it shouldn’t be. Those times happen when unexpected news occurs.
Sometimes they just happen. Remember that these are usually just quick in-and-out opportunities. Especially if they are identified in shorter time frames, just remember that each long candle “wants” a 50% retracement.
The market must breathe, so make sure to be ready when it takes a breath. Many of these trade opportunities can be confirmed with the Strike 3.0 Reversal signals (see the next example.)
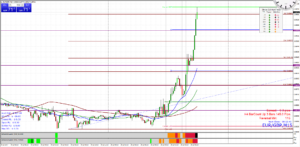
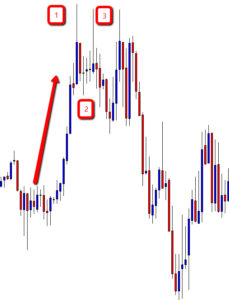
If you’ve been in our trading room for a very long time, you’ve probably heard me mention the 123 Reversal setup. I’ve traded these regularly for many years with quite a bit of success. They are based upon trader emotion and can be relied upon to provide a great statistical edge from which to glean a few pips of profit.
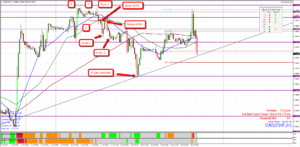
The bull-bear flag occurs when the market is taking a breath from a hard-up or downtrend. Moreover, the flag appears as a channel in the opposite direction of the preceding trend but signals a trend continuation.
Don’t hesitate to use price action signals in addition to the Strike 3.0 tools for picking trades.
What Is the Best Time Frame To day Trade Price Action?
We recommend this strategy for swing traders and day traders. For anything under an hour time period, you will not see us using this strategy. We have to develop day trading strategies using price action patterns where the price action signals behave more consistently on larger time frames.
That doesn’t mean this method won’t work on lower time-frames or with a scalping strategy. However, with our testing, we revealed this day trade price action strategy works best on a one-hour time chart and above.
Benefits of Day Trading Price Action Trading Strategies
Price action trading is ideal for day traders for several reasons. Because these strategies require very limited use of technical indicators, they are simple and can be applied in all markets. Some traders, especially day traders, believe these indicators are incredibly “noisy.” Minimizing the amount of noise you are taking in will make it much easier to make quick, educated decisions.
Additionally, price action strategies are ideal for day traders because they are clear and actionable. Once you can effectively distinguish the dead zones from the red zones (explained below), the lines for trading will be clearly drawn, and you can trade automatically. The purpose of these strategies is to eliminate the need for speculation while also protecting you from trading risks.
Price Action Strategy for Day Trading
In this price action trading strategy, we’ll cover dead zones, red zones, and end zones. These zones will help you determine how to time your trades and take calculated risks. Let’s dive into how to spot these different zones.
Day Trade Price Action Setups: The Dead Zone

Nobody likes the dead zone in trading. This “dead zone” indicates that the price action is going nowhere. It’s not making higher highs or lower lows. The buyers and sellers are at a standoff, and no one is winning the fight. It’s almost like a soccer match when the two teams play an entire game only to end up in a tie or draw.
They fought the whole game only to end up with a mediocre result. This could be interpreted to us traders like this. We entered a trade in the dead zone only to come up with a 3-pip winning trade or a 0-pip trade that you held onto for six or so hours. We do not want mediocre results; we want to WIN. Winning is our main objective, so we want to avoid this “dead zone” at all costs.
In many ways, your stop-loss orders function as a sort of the “back of the end zone.” These orders help create a range where acceptable losses can be risked, and acceptable gains can be achieved.
By carefully timing the market so you are in the red zone, you will be in a position to take advantage of channel breakouts. Spotting these channel breakouts will allow you to achieve low-risk, short-term gains. This is the entire objective of price-action trading.
Here is what a “dead zone” in trading looks like in trading:
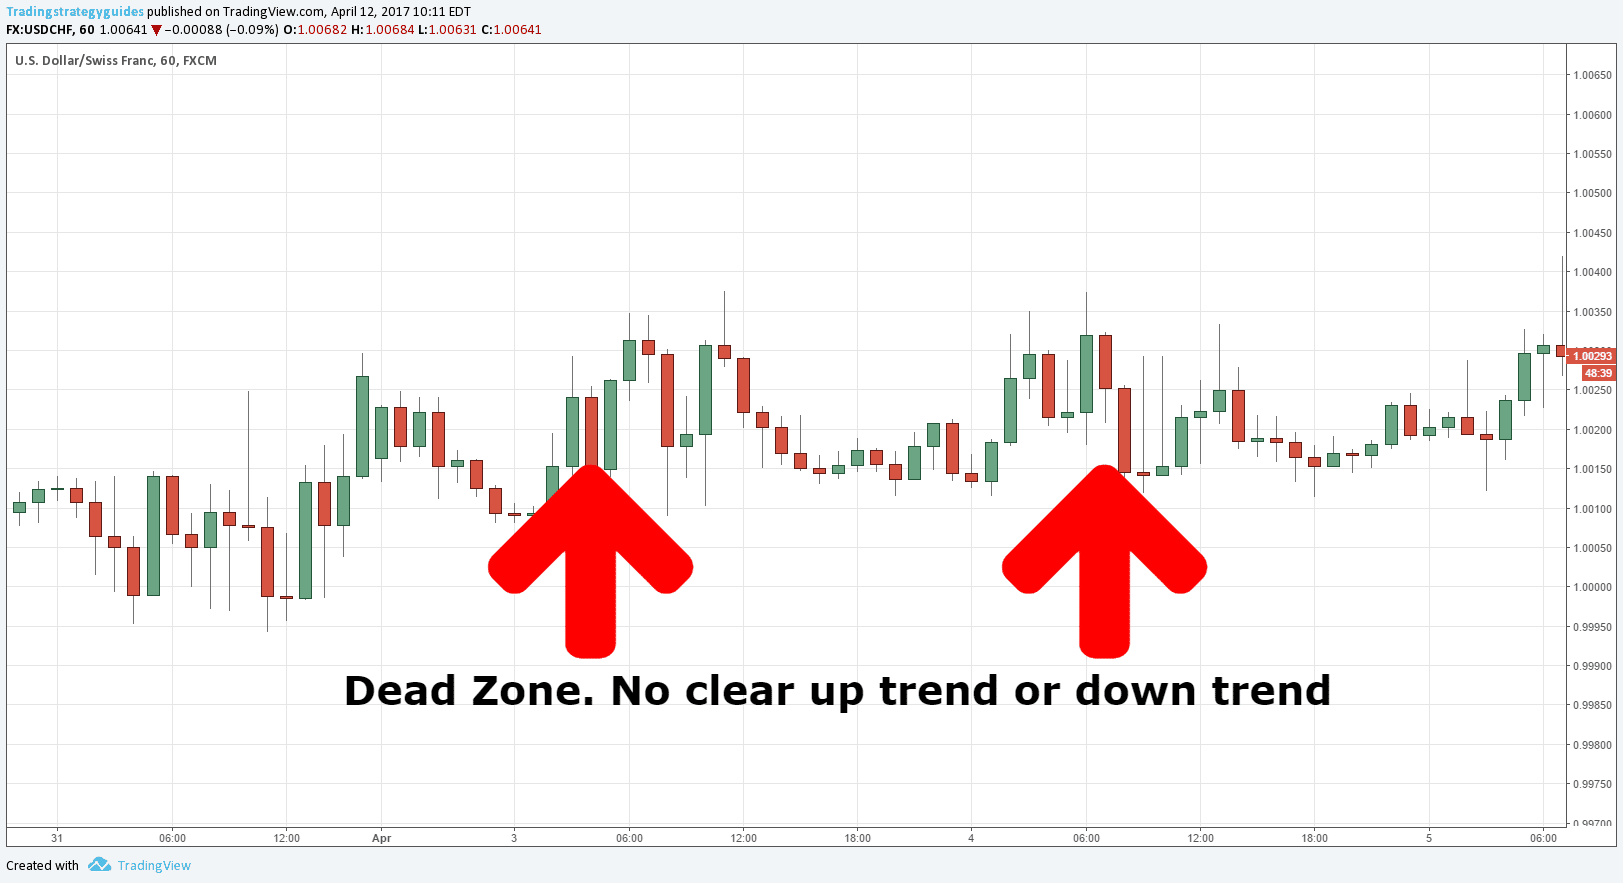
So, if you see this occurring, you know that no indicator on earth will make you 1,000’s of pips here. Scalpers will enjoy those small retracements, but for this price action strategy, we are not interested in this small channel or consolidation.
Let’s dig a little deeper as to what is really happening here.
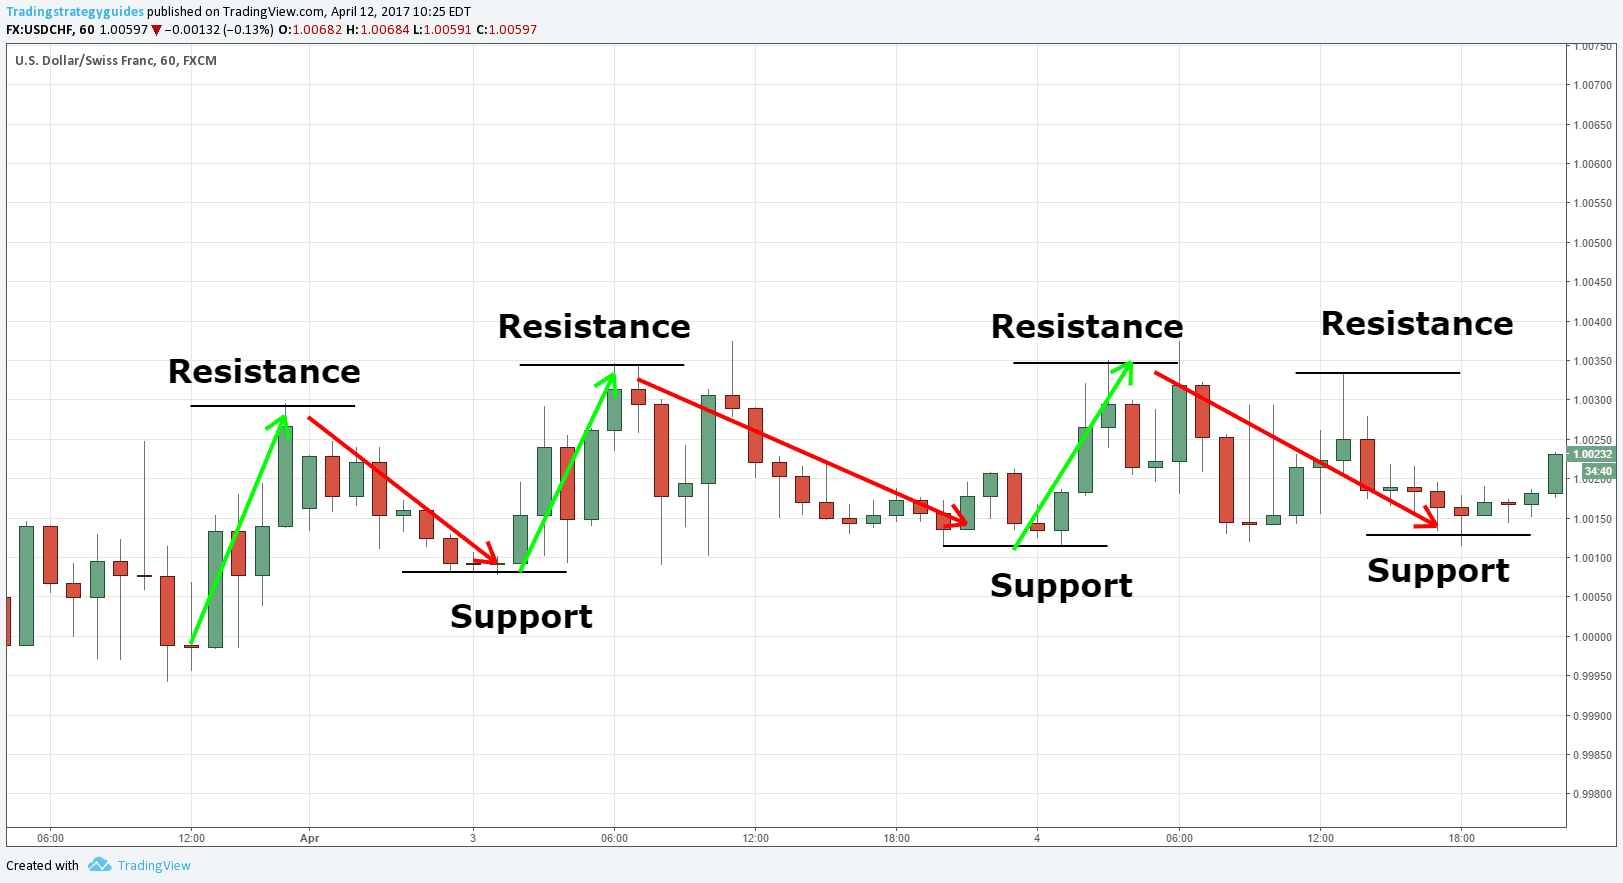
As you can see, buyers get on a short run only to get taken over by sellers. Then, sellers get on a run and then hit a floor and get taken over by buyers. There are no higher highs or lower lows being taken out. This process will go on and on until a district winner is validated. It’s simply traders making trading decisions!
So, since we now know what the dead zone looks like, we can go to step #2 in this price action analysis process and determine where the “RedZone” is.
Price Action Setups: The Red Zone
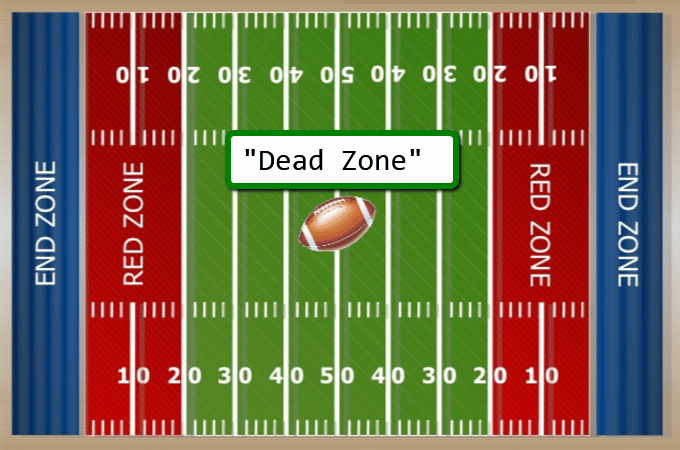
If you know anything about American football, you know that the red zone is the area between the 20-yard line and the goal line. As you can imagine, this is where all the action happens. At this spot on the field, the offensive team is mostly focused because they can see the finish line.
They only need a few more yards until they reach their goal of a touchdown. The same can be applied to this price action approach. We saw that the dead zone was stagnant and boring. Hardly any movement and not many pips to come by. However, once we get in a red zone, traders get razor-sharp in their approach to get to their end goal of a 20, 60, or maybe even a 100 pip winner!
Let’s take a look at what a red zone will look like:
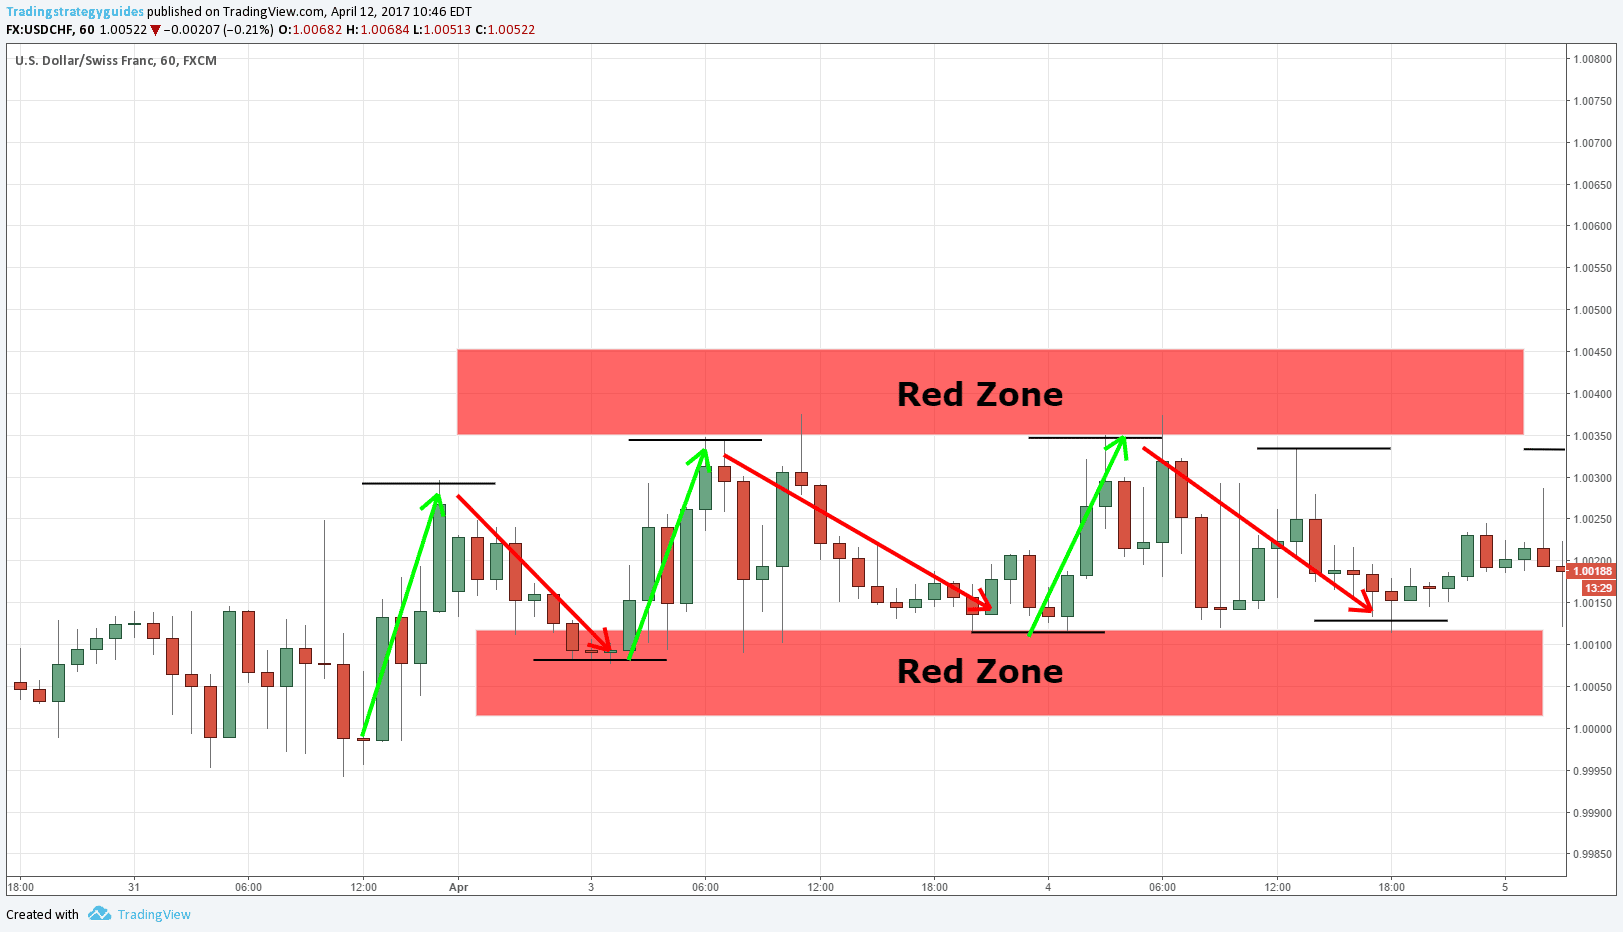
Using our example, if the price had hit our red zone and continued to the upside, we would have been interested in a buy trade. This is because the price reached a new higher high and gave us an indication that this will become an uptrend.
Same when the sellers took over. If the price had hit this red zone and continued to the downside, we would have been interested in a sell trade because there were new lower lows, and it gave us an indication that this would become a downtrend.
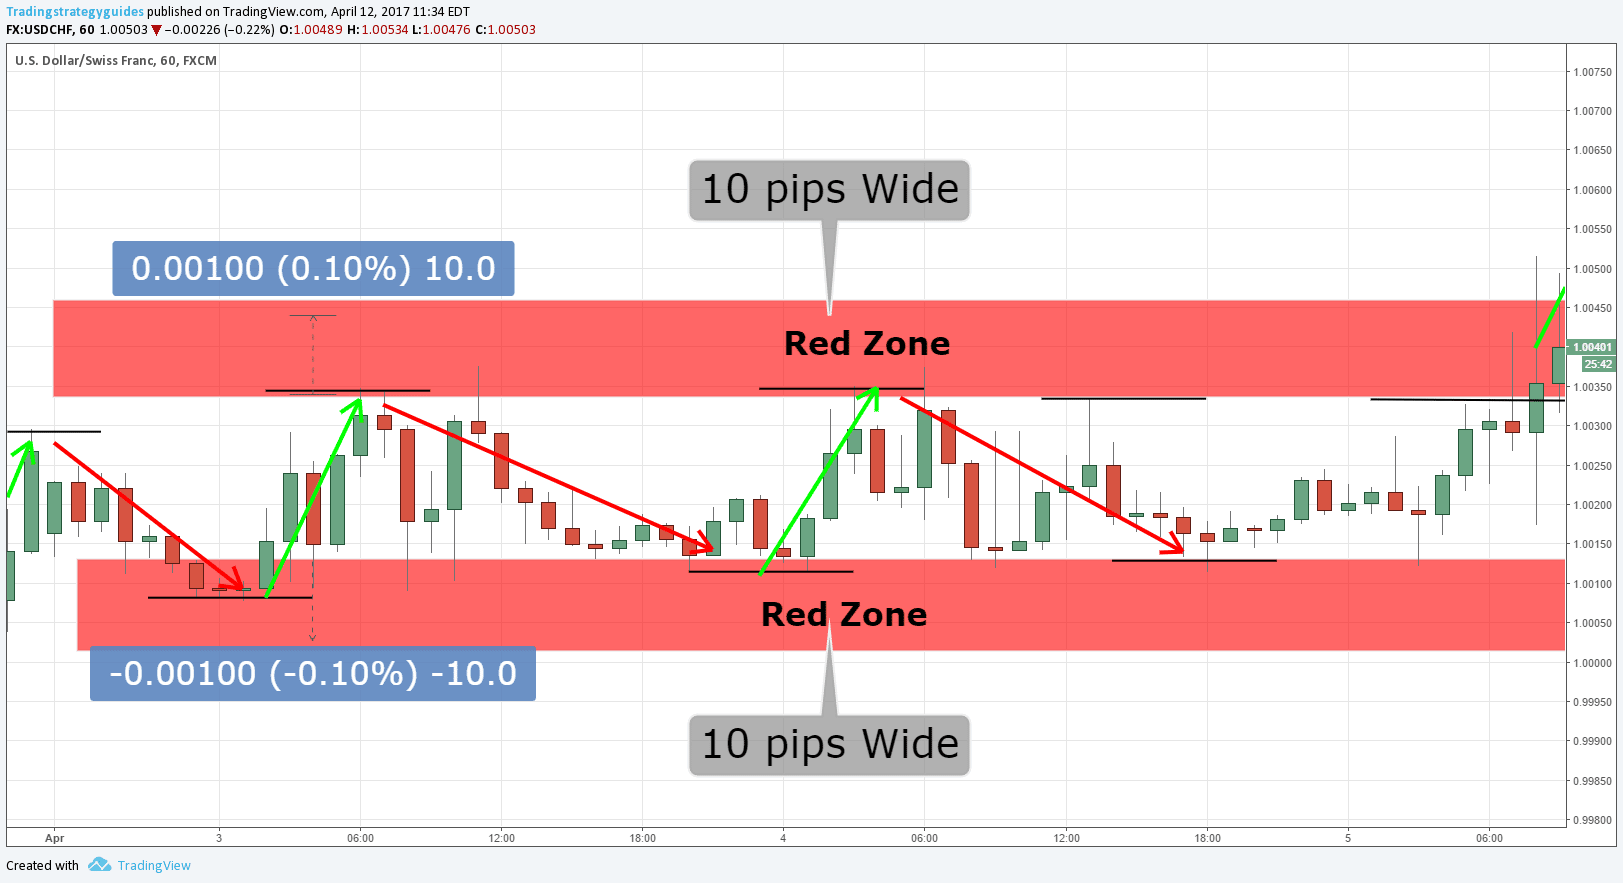
To explain how you draw a red zone, you simply find a “dead zone” currency pair, stock, etc… Then, you draw a red zone rectangle above the resistance and below the support. I highlighted these zones in one of the images above for reference. This could be anywhere between 10-20 pips wide. Here is an example of this:
Let’s go a little further in time and see what happened when it hit the red zone:
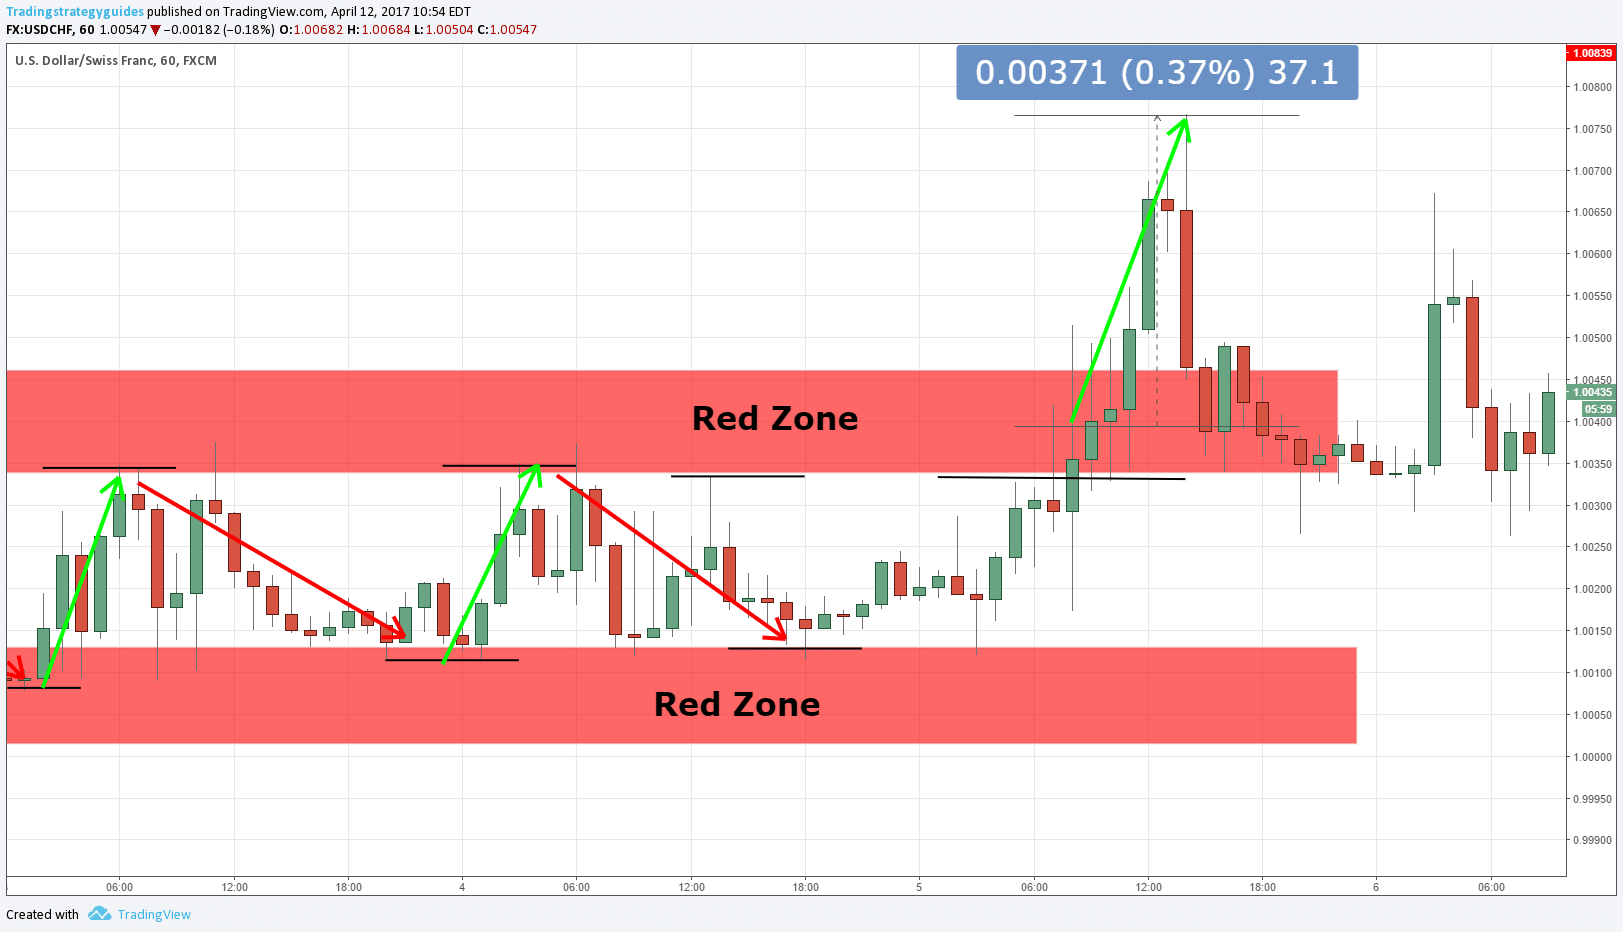
As you can see, when the price action broke the dead zone, if you had placed a buy entry order, you would have grabbed about 35 quick pips if you had closed the trade right away.
Have you ever heard the saying, “A picture is worth 1000 words?” That statement is true in the chart image above. You can see on this hour-time chart that many traders got in the red zone and pushed the price up only about 40 pips. Then they got out immediately.
As a result, the price continued to draw down to our red zone again and now is hitting a new support level. Remember, resistance in the past means support in the future.
Now that we know what the red zone looks like and how to identify it, let’s get into the last step, which is the “Endzone.”
Day Price Action Setups: The End Zone

This is our end goal. We want to go from the red zone to the end zone consistently with this price action strategy. To do this, simply draw a rectangle on your price charts similar to our drawings.
You only trade these zones with this price action red zone trading strategy. I like to draw the red zones anywhere from 10-20 pips wide, but you can adjust these accordingly. This gives a little room for the price action to do its normal “retracement” before heading to the upside or downside.
So, looking back at our price action trading example, here is what you would have done:
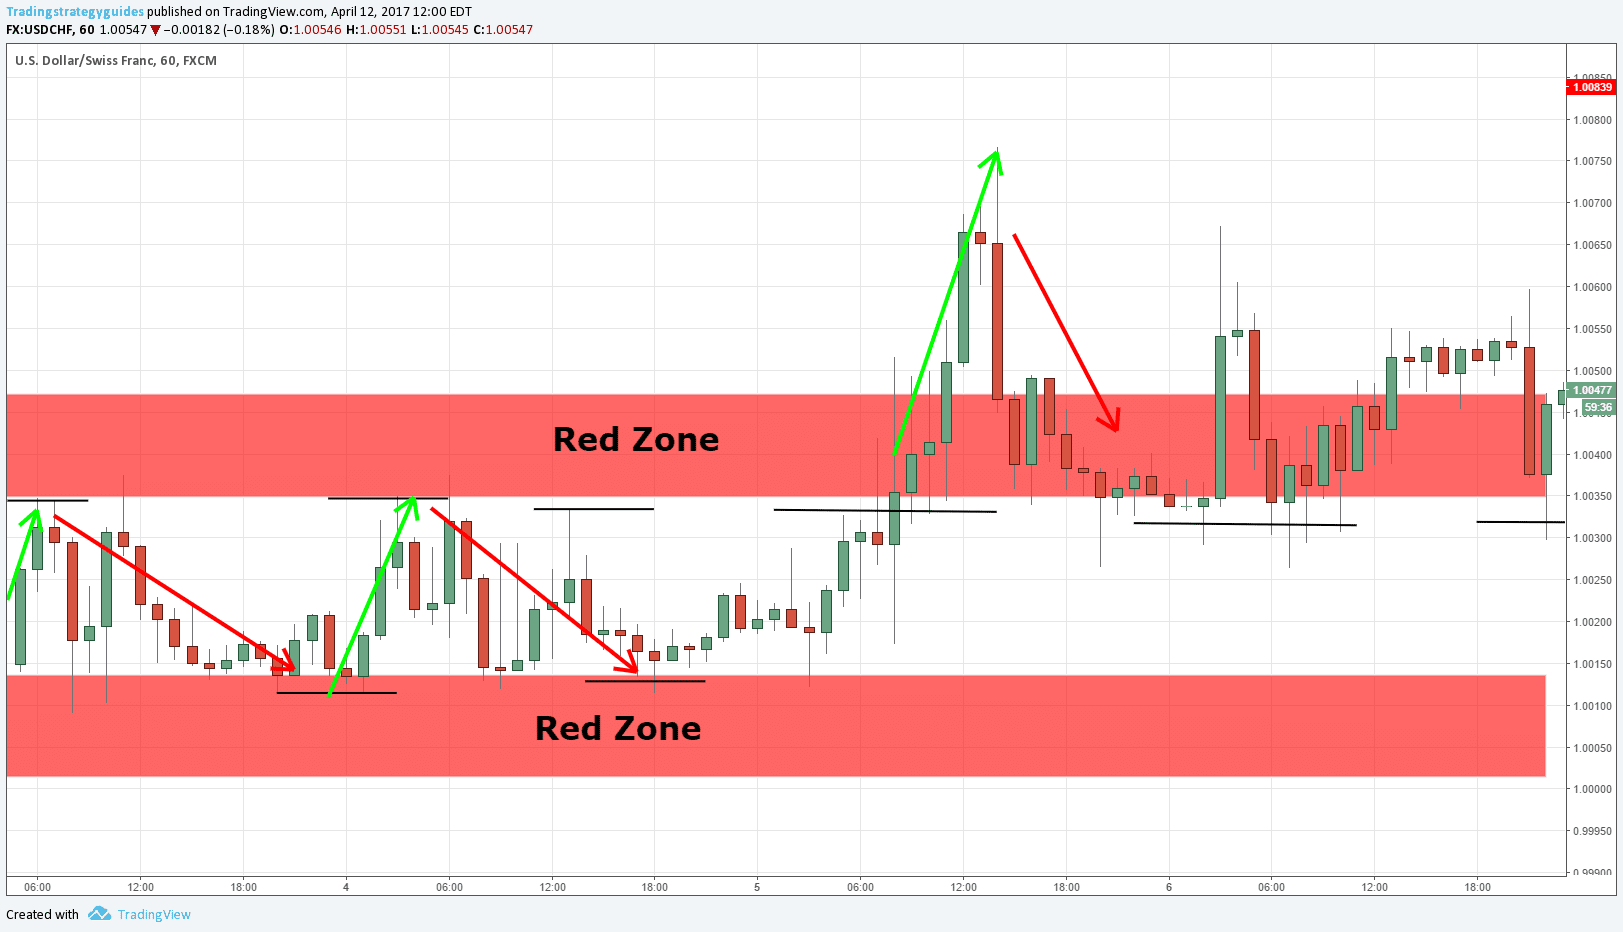
This red zone is where many traders are making buying or selling decisions. Once you determine that the price action will not return to the dead zone, you can go ahead and make the buy trade here. Read more about rectangle patterns here.
**Note: If the price action was in the lower red zone, then we would be looking for a sell trade.
Using our example, we saw a breakout candle occur from the red zone, so this is where you would have entered the trade.
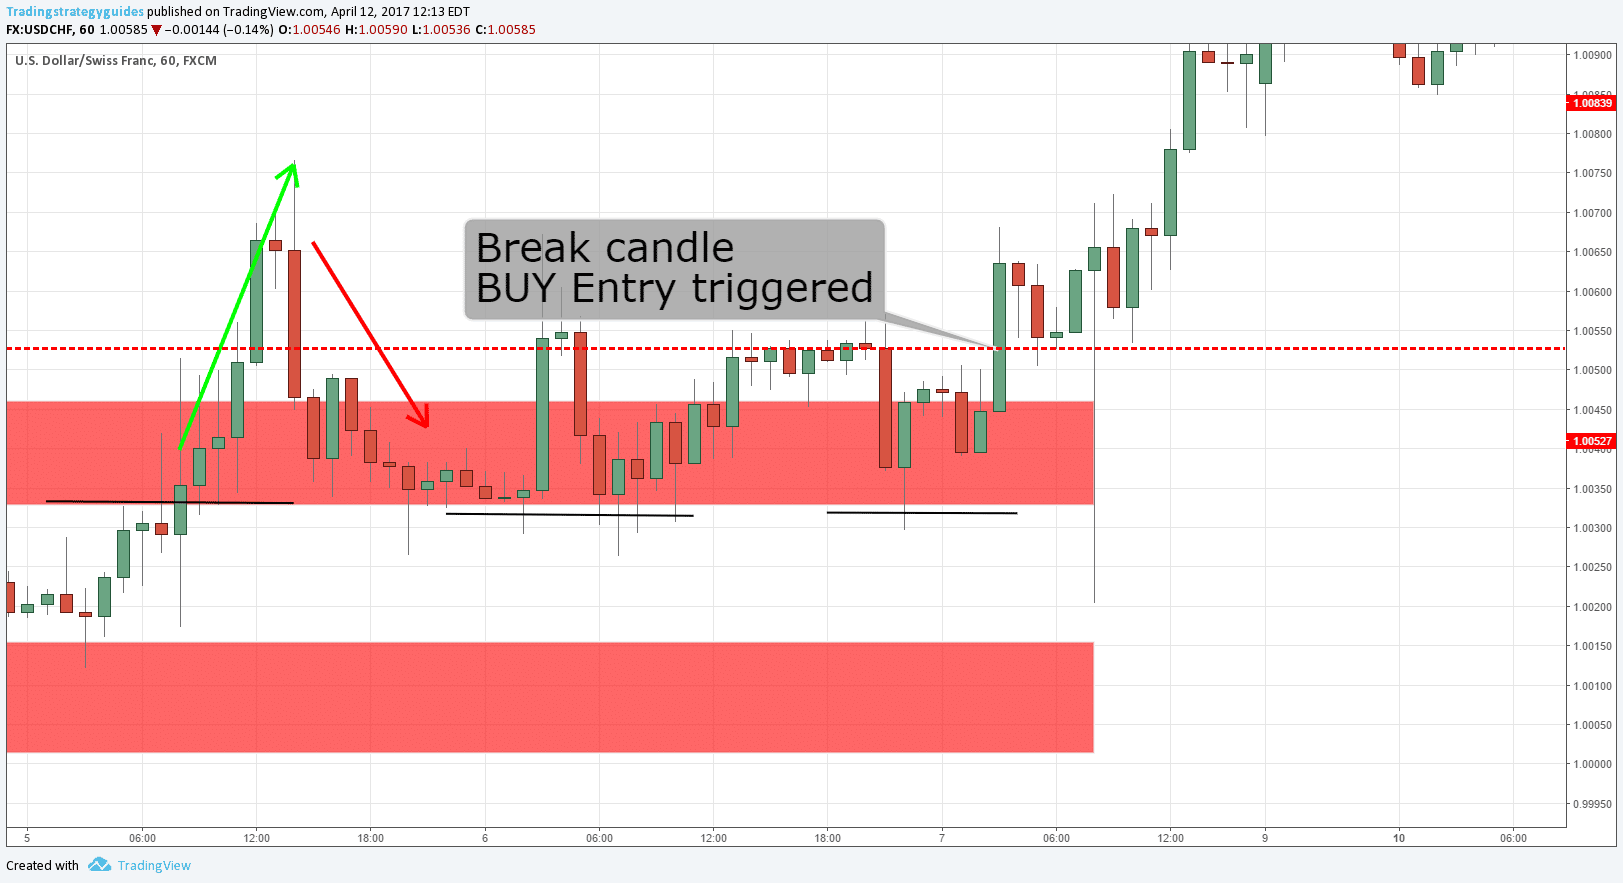
Place your stop loss in the lower red zone. If the price action makes its way down to the lower red zone, then the trend is obviously not going up anymore, and you want to get out of this trade immediately.
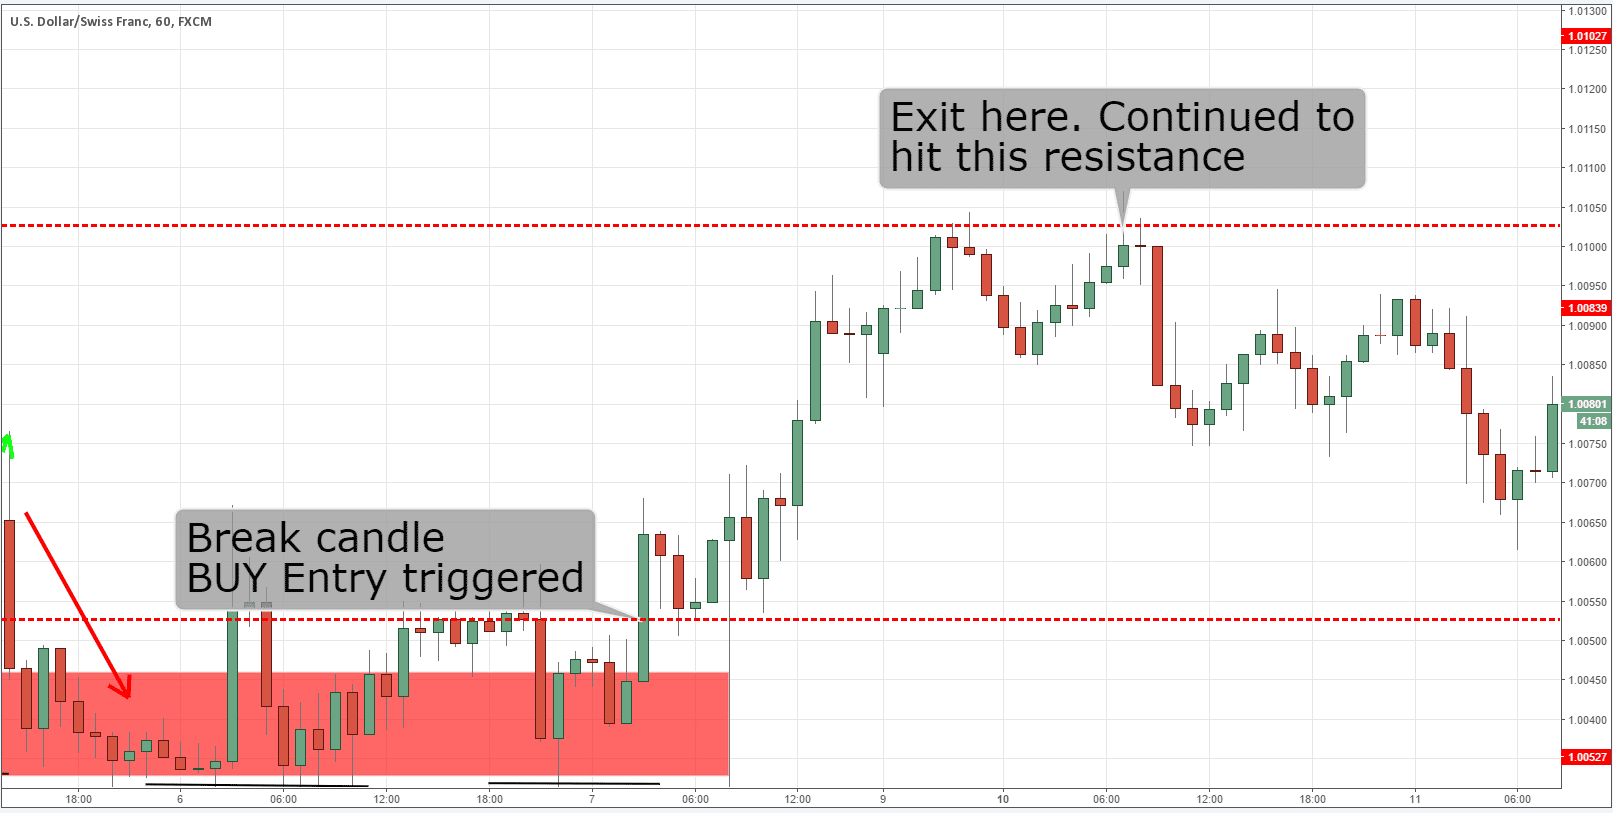
You can exit the trade when you see that the trend is most likely over (due to consolidation in price action.) We saw that the price bounced off of this resistance, so that is why you would have exited this trade in profit.
Day Trading Price Action Video
Final Thoughts: Day Trading Price Action
This is a great price action strategy for day trading. There may not be hundreds of price action setups a day, but when you find a trade that follows the Day Trading Price Action Strategy, you should see great results. Here are 5 key things to remember about price action:
- Useful alongside technical indicators (RSI, MACD, Fibonacci, etc.)
- Ideal for short-term decision-making.
- Helps avoid the “noisy” behaviors of securities.
- Entry and exit points are easier to identify.
- It’s a perfect blend of speculative and quantitative analysis.
Another reason why this strategy is so popular is that it can be easily adjusted according to each trader’s personal preferences.
Make sure to leave us a comment below and tell us what you think of this strategy and how you trade using price action analysis. Also, feel free to check out one of the most popular strategies, which we call the 80-20 RSI strategy.
If you want a price action e-book, go ahead and tap here, and we will give you one of our price action pin bar strategies.
Thanks for reading!
Please leave a comment below if you have any questions about this Price Action Strategy!
Also, please give this strategy a 5 star if you enjoyed it!

Day Trading Price Action PDF Download
Like this Strategy? Grab the Free PDF Strategy Report that includes other helpful information like more details, more chart images, and many other examples of this strategy in action!
Day Trading Price Action Info-graphic Download
Please share this trading strategy below and keep it for your own personal use! Thanks, traders!





What do you think of this Price action approach to trading? Have you had success in the past using price action techniques?
Have been seeing these kind of stuff but I never know how it could be traded……Thanks a lot for the insight am going to start doing back testing with this strategy thanks again am so happy
No problem! Test away and please share your results! Thanks
This is nice simple, direct, clear. I’m struggling at this whole trading thing. I’ll read this strategy about 10 times, as it is easy to understand, yet I do not seem to get ahead with my trading, but good presentations like this keep me motivated. Thank you VERY MUCH for this article, MUCH appreciated.
Not a problem! We come up with 4 new strategies a month and post them on our blog. Glad we can help you out with our trading strategies. Keep it up and you will find success. Staying focused is the key to trading.
This is a very profitable strategy. I started implementing something close to this strategy and my account is exploding! It can be seen on many timeframes on a daily basis. However, for best results as to what direction to focus on, check the trend on the higher time frames.
Thank you for posting this great strat. It really does work great
So helpful
Glad it was helpful!
Accurate
Would you be interested in exchanging links?
I have been exploring for a little for any high-quality articles or blog posts on this kind of area . Exploring in Yahoo I eventually stumbled upon this website. Studying this information So i am satisfied to convey that I have a very just right uncanny feeling I found out exactly what I needed. I so much indisputably will make sure to do not omit this website and give it a look regularly.
xkhyspixhfjwfiqgbznphuwrkwyibp