Ascending Scallop Pattern: Ride The Wave To Profit (5 Steps)

Imagine the market (stock, Forex, crypto, futures, any market you can think of) as a vast ocean, and within it swims the quirky and fascinating ascending scallop chart pattern, affectionately known as the “scallopy J.”
As traders navigate the choppy waters of an upward trend, they stumble upon a peculiar sight—a pattern that resembles a scallop shell! But this isn’t your ordinary seashell; oh no, this scallop starts wide, like it’s boasting about its size, then gradually tapers off as if it’s on a diet plan.
It’s like the scallop is saying, “Hey, I’m here to party, but I’m getting slimmer as I go!” This narrowing is a sign of the market taking a breather, a little timeout in its bullish journey. It’s like the market’s way of saying, “Hold up, folks, let’s catch our breath before we surge ahead!”
So, when traders spot this delightful scallop formation, they know they might be in for a shell of a good time—a sign that the bullish momentum could be gearing up for another wave.

Thanks for visiting Trading Strategy Guides (TSG)!
You have discovered the most extensive library of trading content on the internet. Our aim is to provide the best educational content to traders of all stages.
Learn Our Trading Best Strategy By our Founder Casey Stubbs
In other words, we want to make YOU a consistent and profitable trader.
If you’re a brand new trader, we recommend hopping over to our ultimate beginner’s guide to trading to learn more.
Ready? Let’s start learning the Ascending Scallop Pattern.
Table of Contents
Introduction: What is The Ascending Scallop?
The ascending scallop chart pattern is used by traders in technical analysis. Scallop patterns indicate potential bullish continuation opportunities within an upward trend. Its name comes from a resemblance to a scallop shell, characterized by a distinct “J” shape formation.
Unlike other patterns like the Quasimodo pattern, the ascending scallop starts with a wider base and gradually narrows as it progresses upwards, reflecting a gradual decrease in price volatility.
Narrowing suggests a consolidation phase within the uptrend, wherein buyers are gradually gaining control over the market.
Is there a descending Scallop?
While the ascending scallop indicates bullish sentiment, its counterpart, the descending scallop, mirrors a bearish trend. It features an inverted “j” shape, starting wide and narrowing downwards.
Best markets and time-frames to trade Ascending scallop patterns
Whether you’re navigating the bustling streets of the stock market, surfing the Forex waves, or exploring the vast seas of commodities trading, you’re bound to stumble upon our scallopy friend making its presence known.
Yes, that’s right, the ascending scallop pattern isn’t picky about where it shows up—it’s a versatile creature, lurking in various market depths.
Now, when it comes to choosing the right time frame to spot these delightful patterns, think of it like choosing the perfect wave to ride. Higher time frames, such as daily or weekly charts, act as a magnifying glass, offering a clearer view of the scallop’s intricate details. It’s like zooming in on a seashell to admire its unique patterns and colors—you wouldn’t want to miss any of the action!
In these longer time frames, the ascending scallop pattern tends to reveal itself more prominently, providing traders with reliable signals to base their decisions on. It’s like finding a treasure map with clear markings leading to hidden riches.
So, whether you’re a seasoned trader or just dipping your toes into the market waters, keep an eye out for our friendly scallop—it might just lead you to a pearl of a trade!
Steps For Ascending Scallop Trading Strategy
We’re going to show you step-by-step how to find the ascending scallop pattern. We found a great Bitcoin Strategy Scallop example. If you would have been watching for this chart pattern in September of 2023, you would have discovered an amazing entry opportunity and greatly profited from it.
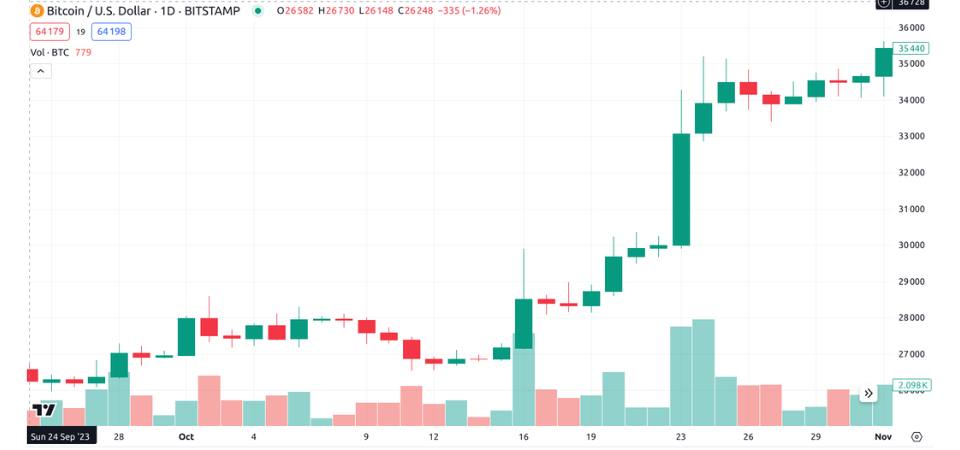
Step 1 – Identify an Ascending Scallop pattern
Are you ready? It’s time to start looking for that famous “J”.
- Watch for price consolidation. This looks like price moving sideways for a period of time.
- Look for the formation of a “j” shape on the chart, this can vary case-by-case, but most of the time it looks like sideways movement, followed by sudden price decline, then a sudden price increase, indicating the ascending scallop pattern is beginning to form.
- Look for an initial breakout above the consolidation level.
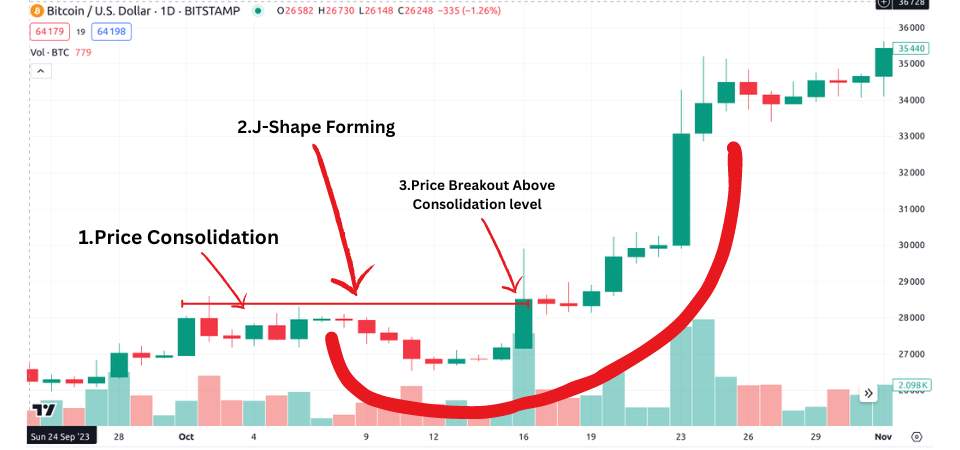
Once all the above criteria has been met, congratulations you have just spotted your friendly neighborhood scallop popping out to meet you. Next we’ll talk about waiting for the retracement.
Step 2 – Pullback/retracement
After the initial breakout, anticipate a pullback or retracement to the pattern’s support level, providing an opportunity for entry at a favorable price.
Confirm price retracement within the pattern. After the initial breakout, we don’t want to enter the trade just yet, wait for price to pull back, and get in on the second breakout.
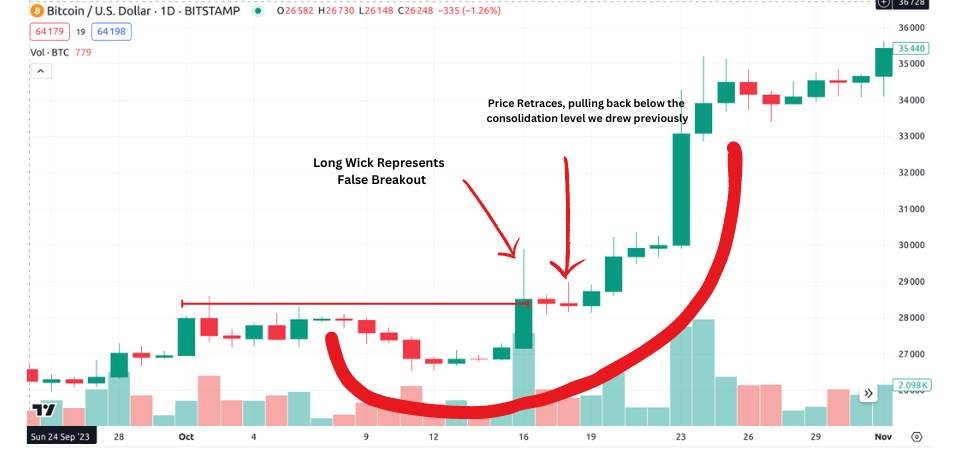
*NOTE* Sometimes it will be a significant pull back, i.e. a few candles of price decline, or it can be very brief, i.e. just be a single candle with a long wick formation.
Step 3 – Trade Entry
Enter the trade once the pullback is complete, price breaks the false breakout candle, resuming its upward trajectory.
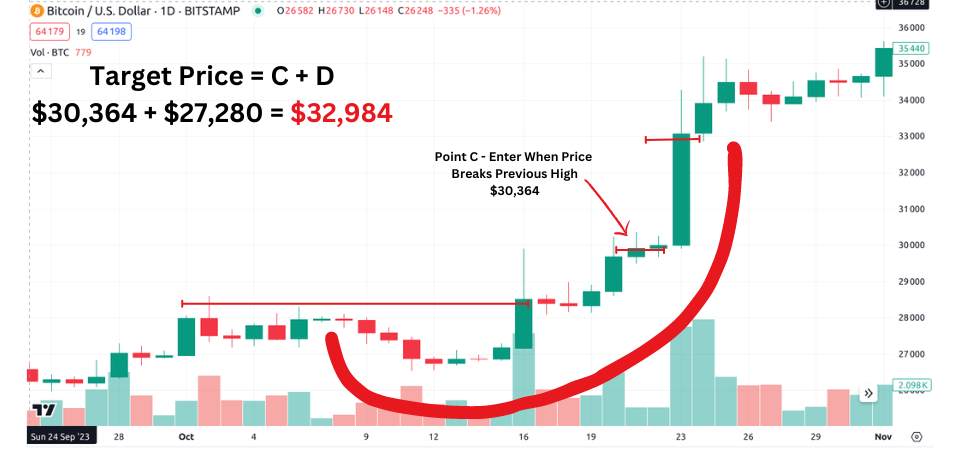
Step 4 – Take Profit
First, calculate the target price by measuring the distance from point A (start of pattern) to point B (highest point). Then subtract the high from the low.
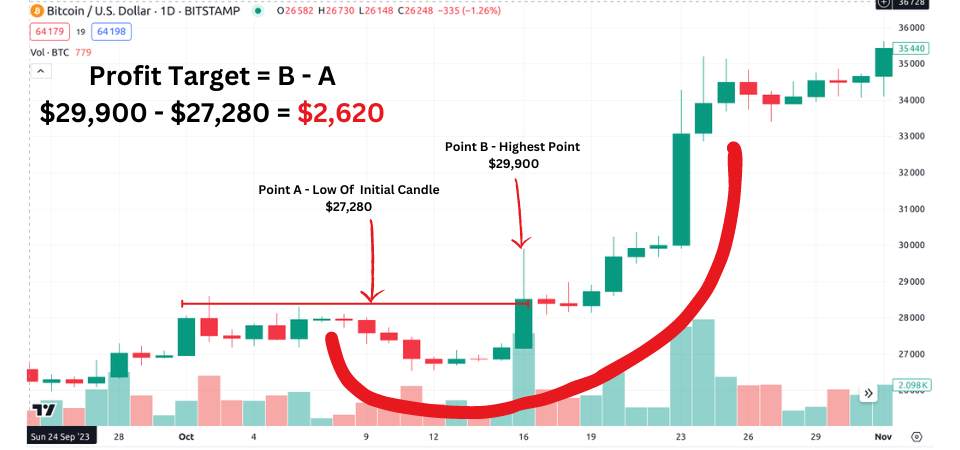
Second, set profit targets based on the measured move of the pattern, aiming to secure gains as price reaches the projected target.
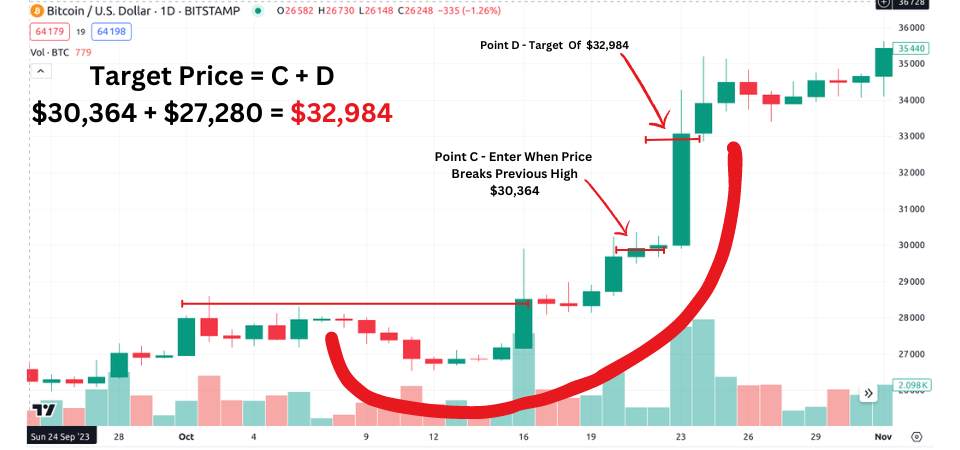
**Note: Feel free to play around with your take profit target. We just like to start with a 1:1 Risk To Reward Ratio for simplicity. You could easily attempt a 1.5:1 or 2:1 ratio if you wanted to.
Step 5 – Stop Loss
Place a stop-loss order just below the low after the initial breakout to protect against potential losses if the trade goes against expectations.
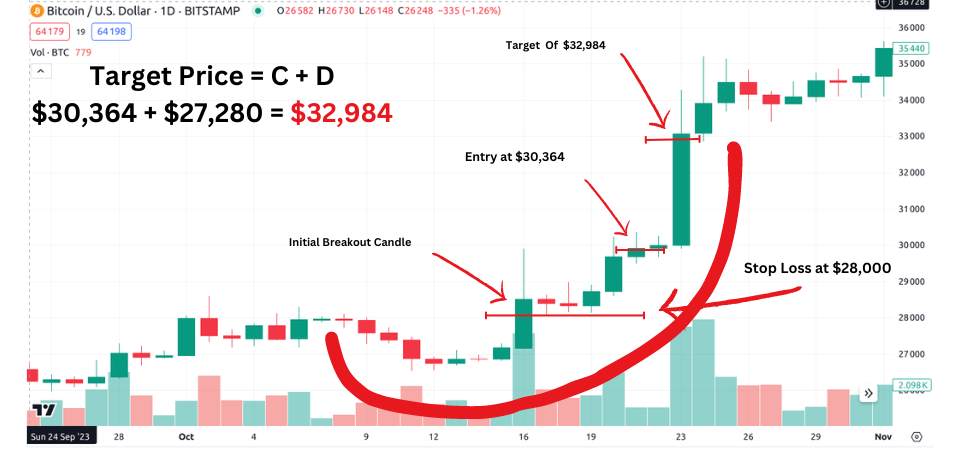
** Note: Feel free to adjust the stop loss at the low of the pattern if you feel you need a little extra room for the trade to take-off.
Conclusion: Ascending Scallop Pattern
The ascending scallop pattern offers traders a valuable tool for identifying potential bullish opportunities in the market. By understanding its formation and following a systematic trading approach, investors can enhance their chances of success and capitalize on profitable trades.
What is a scallop pattern in trading?
A scallop pattern in trading refers to a distinctive “U” or “J” shape seen on price charts. It typically occurs within trends, signaling a temporary pause or consolidation before the trend reverses, or resumes. Named for its resemblance to the shellfish, the pattern starts wide and gradually narrows, offering traders potential entry or exit points in the market.
How do you trade ascending scallops?
Trading ascending scallops involves identifying the distinctive “J” shape pattern on price charts, typically within upward trends. Traders look for specific characteristics such as a widening base followed by a narrowing price range as the pattern progresses upwards.
Entry points are often sought after the pattern’s breakout, while stop-loss orders are typically placed just below key support levels. Profit targets are calculated based on the height of the pattern. Implementing a disciplined approach, traders aim to capitalize on potential upward momentum indicated by the ascending scallop pattern.

