Order Flow Trading Strategy 3 Tips To Create Abundance
The order flow trading strategy will teach you how to acquire the mindset of a professional trader. If you’re interested to learn how to trade using one of the oldest trading techniques used especially by day traders, you have landed in the right place. We’ll teach you how to trade market imbalances with one of the best order flow trading setups.
Order flow trading is not the Holy Grail of stock trading strategy, but many professional traders that work at a prop trading firm or a big hedge fund swear by it. Trading using order flow can help you have a better read of what is going on behind the trading candlestick price chart.
Price moves when there is an imbalance in supply and demand. As a trader, it remains up to you to recognize these imbalances.
Throughout this order flow trading guide, we’re going to teach you how to identify price imbalances between the bid and ask prices.
We’ll be going to start things off by outlining what is order flow trading and understanding how you can benefit from order flow chart trading.
Side note: anyone who is making money trading should realize that making additional revenue apart from trading can be a great way to help reduce some of the pressure of success.
I have a great discussion with Mark Savant from After Hours Entrepreneur: Build Your 6-Figure Side Hustle.
Let’s begin to learn the Order Flow Trading Strategy!
Table of Contents
What is Order Flow Trading
Order flow trading is a type of technical analysis that involves watching the flow of trading orders and their subsequent impact on the price to anticipate future price movement. In other words, the order flow analysis allows you to see how other market participants are trading (buying or selling).
Order flow trading is also referred to as tape reading or order flow analysis.
Order flow analysis helps you recognize the final details of the buying and selling volume. It’s a microscopic look into candlestick studies. Inside each candlestick, there is a lot of information that can be analyzed through order flow.
Basically, you can view order flow trading like a volume-based trading system.
An order flow chart will show you exactly how many buy and sell market orders were executed at each price level.
See the order flow chart below:
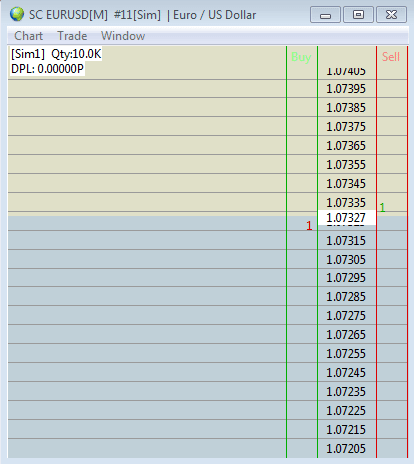
The Depth of Market (DOM) will show you the intent of the buyers and sellers. However, when those buy and sell orders transform into market orders and are filled that will transcribe onto the price chart (or footprint chart).
Moving forward, we’re going to outline two concepts, namely:
- How to trade order flow.
- And, how to read the order flow.
How to Trade Order Flow Trading Strategy
In technical analysis, we look for areas or price levels where to trade. However, in the order flow analysis, we look for clues when to trade and what price to trade.
Trading using order flow can give us information about:
- Big buy and sell orders (it can drive the market price).
- Momentum buying and selling.
- Liquidity flow (how big are the buy and sell orders: small, medium, or big).
- Momentum exhaustion (when the order flow is drying off it may signal a price reversal).
- Stop hunting.
- Trapped buyers and trapped sellers.
Next, we are going to outline the order flow trading tools we use as part of our simple day trading strategy.
What Order Flow Trading Tools We Use
As far as the order flow trading tools go, we use footprint charts.
Note* The best order flow trading platform to draw the footprint charts is Siera Charts.
See Siera Chart footprint chart below:
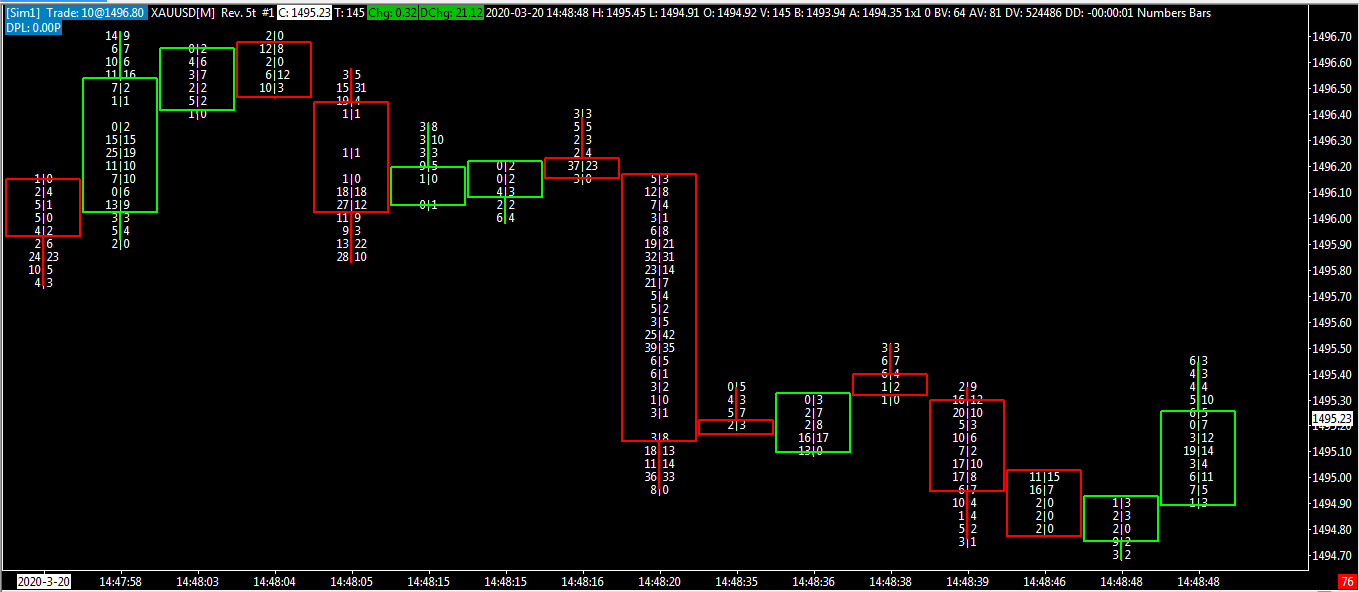
The footprint chart shows us how aggressive are the buyers and sellers. We can use this information to see where the big inventory of orders is sitting and compare it with what the market is doing.
The current state of the market is demonstrated by the trail of transactions that have actually happened, not those transactions that are advertised (aka the limit orders) as potentially happening if we reach a certain price.
The essence of order flow trading is to react based on the action of the markets which is displayed by the daily volume traded.
Basically what you see on the footprint chart is the market orders (all filled orders). This can help us compare the bid volume to the ask volume and gauge which one is in control of the market.
Next, we’ll discuss how to interpret the footprint chart with our order flow trading strategy.
Order Flow Trading Strategy
Before we go into full depth on how to use the order flow trading strategy, we’re going to stop and show you how the footprint chart works.
By now, you are likely wondering how to use the Footprint Charts. Using these charts can help you develop a more comprehensive view of the market.
The footprint charts contain all the data relating to price and order flow (volume).
For each bar and price level, the footprint chart displays the volume traded at each price.
Let’s get into the footprint charts and cover some of the key concepts of how to trade order flow.
Each footprint chart has three pieces of data:
- Each row on the footprint chart develops at a specific price.
- The bid-ask volume indicator displayed in the cell.
- Order flow (green numbers show aggressive buying and red numbers show aggressive selling).
See the footprint chart below:
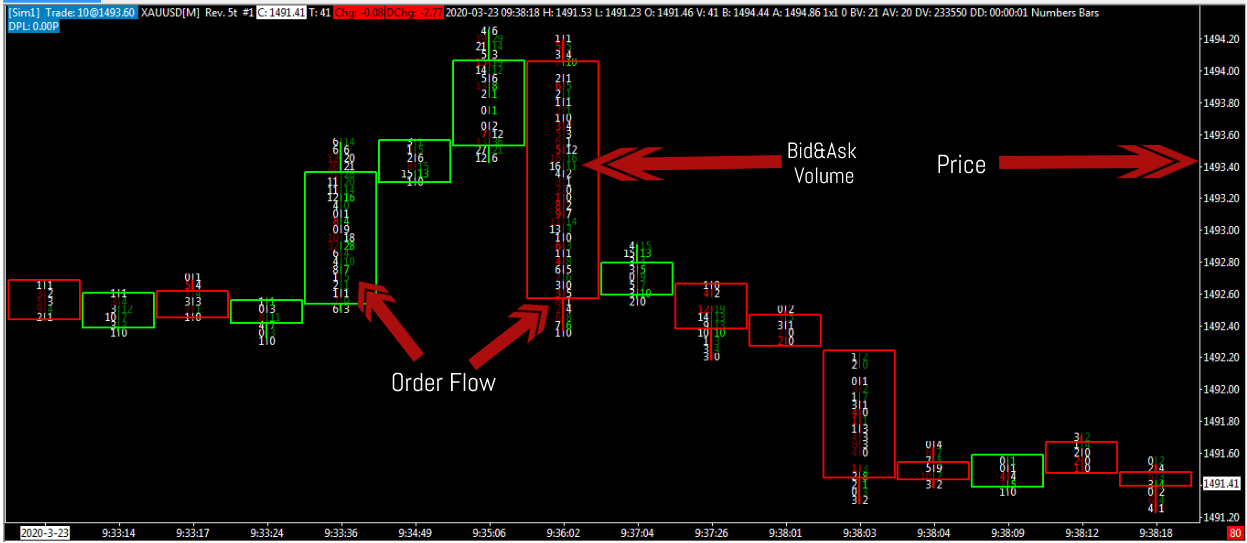
Note* the point of control is the price at which was the most traded volume on each footprint occurred.
If we break down the footprint chart, we have two things:
- Bids on the left side
- Offers on the right side
You can start to build a picture of the relationship between the bid and the ask volume.
If you’re an aggressive seller and you want to enter the market you’re going to have to hit a bid. Alternatively, if you’re an aggressive buyer and you don’t want to wait for a limit order to be filled you’re going to hit the market order and you’re going to lift the offer. This whole process will be reflected in the footprint chart.
Let’s look at how footprints compare the relationship between the bids and the ask prices.
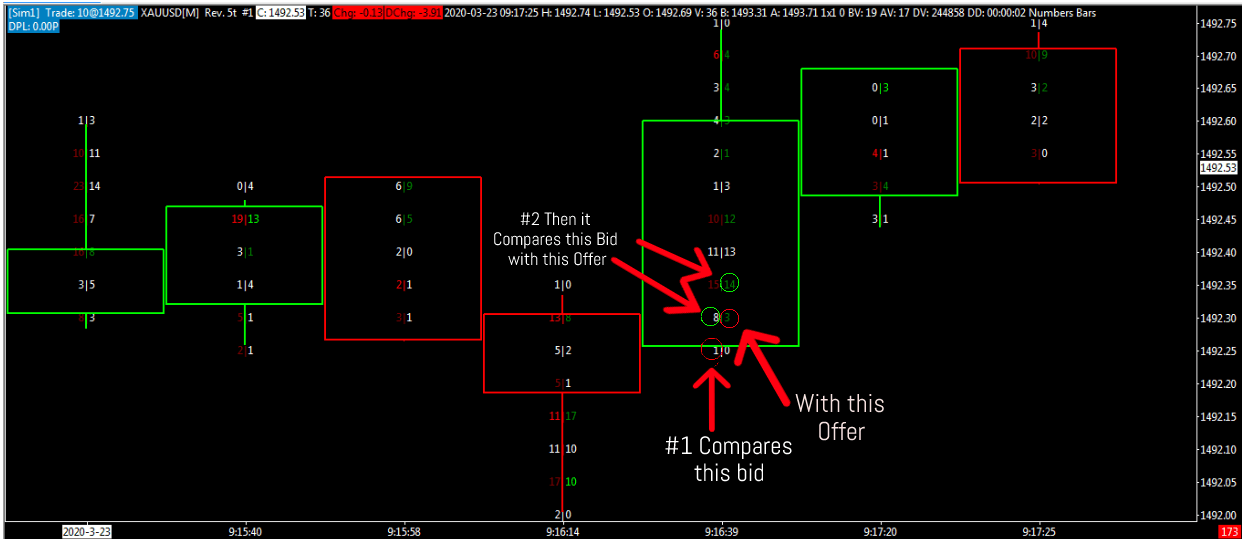
When the buyers turn more aggressively the number will turn green. This means that there are more buyers than sellers. Conversely, when sellers turn more aggressively the number on the footprint will turn red. Check out this forex buyers and sellers indicator.
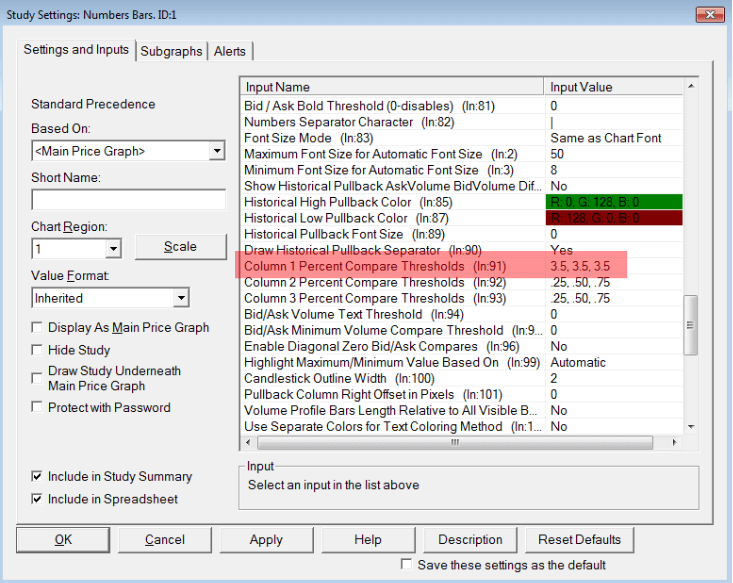
Note* the level of aggressiveness can be edited with your preferred settings in the Sierra chart settings. Go to Study Settings for Number Bars and change the “Column 1 Percent Compare Thresholds” (see figure below).
When you see stacks of these imbalances one after another, that’s a good indication that buyers (sellers) are getting more aggressive. Depending on the location of where these imbalances occur, we can look to qualify trades based on them.
For example, if the footprint shows an imbalance of buying activity in the lower end of the range that usually represents a potential level of support.
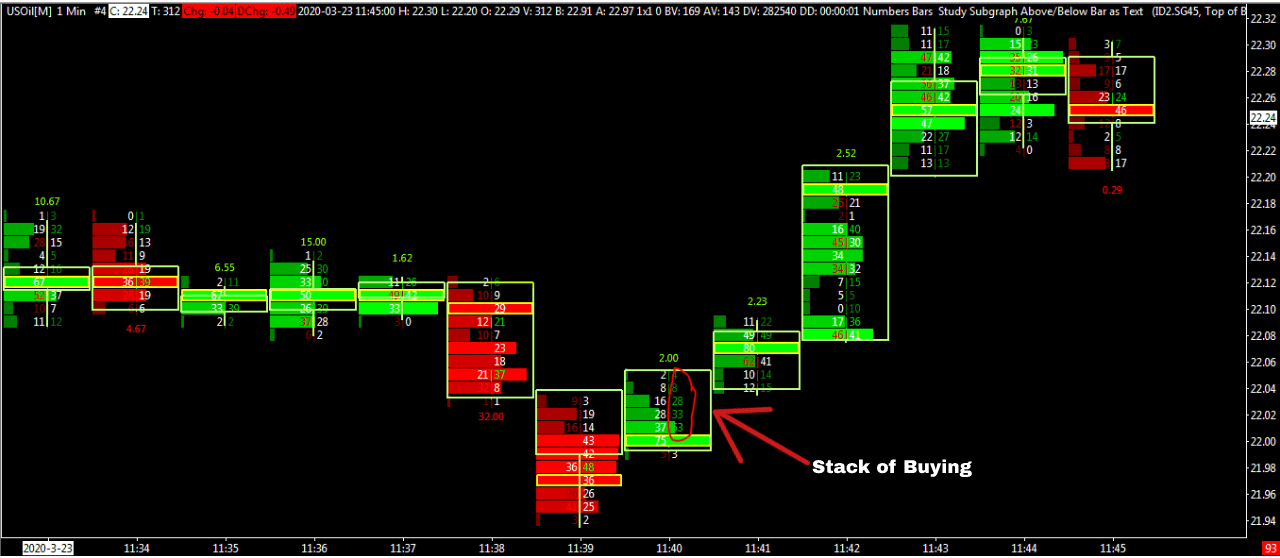
However, if you see a whole stack of buying imbalances print at the top of the candle that can indicate trapped longs and a possible reversal.
Note* the same is true in reverse of selling imbalances.
Moving forward, we’re going to outline how to trade order flow using chart patterns.
See below:
Order Flow Trading Strategy – Footprint Patterns
Additionally, to the aggregated orders, we’re going to add the horizontal volume profile that will give us a visual representation of the total number of buy and sell orders traded at a given price.
The volume profile will be displayed in the form of rectangles of different lengths.
See below:
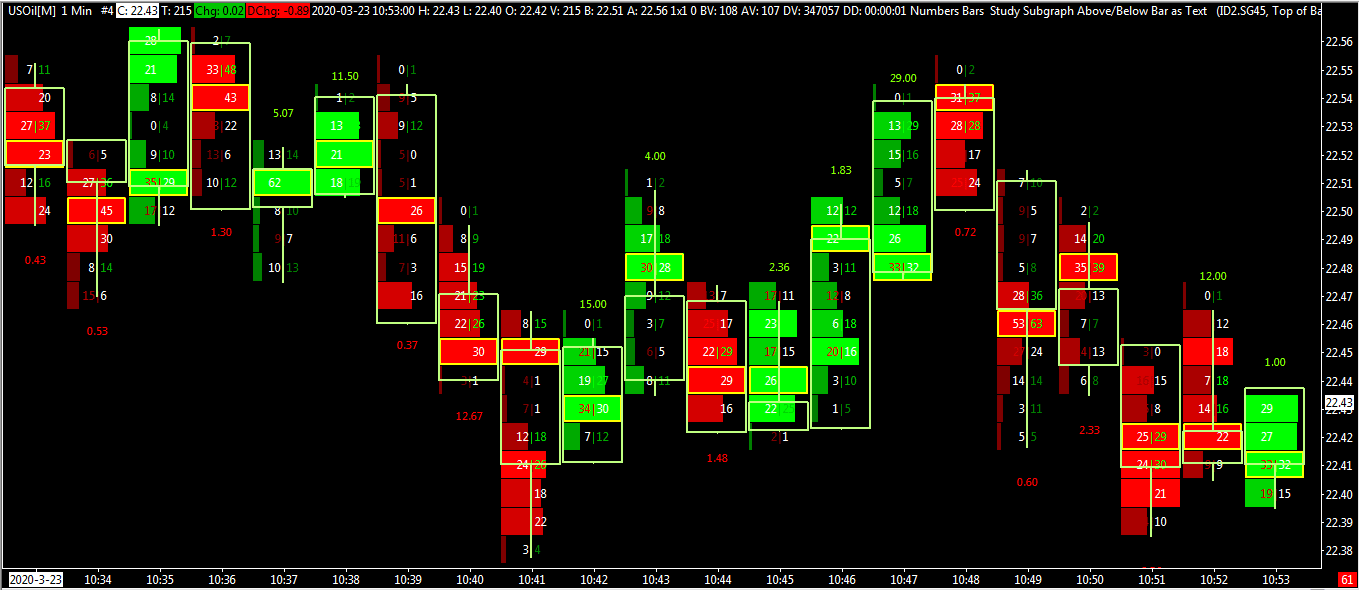
Now, the footprint chart shows us a 3D map of the buyers and sellers in the market. This way we can track what is going on behind the cryptocurrency candlestick charts and see where the buyers and sellers are in control.
The first footprint pattern that you can trade using order flow trading is the P pattern.
You might be wondering:
What is an order flow P pattern?
Simply put, the P pattern can be described by a narrow volume profile in the lower half and a wide volume profile in the upper half of the candlestick.
Note* ideally, the P pattern has small shadows and the candlestick is bullish.
See the order flow chart below:
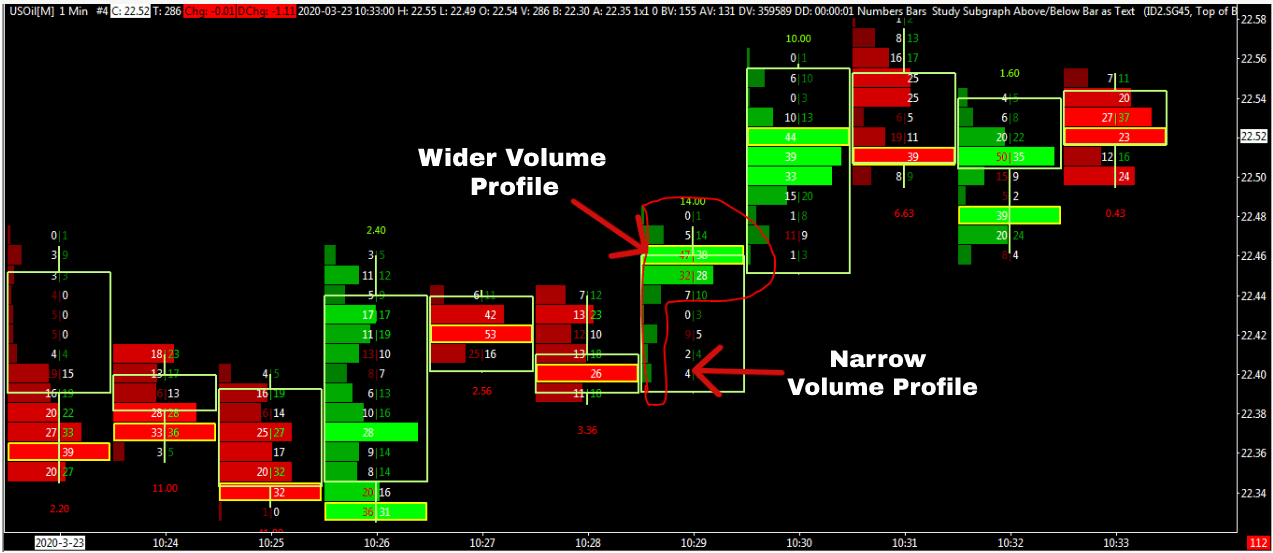
The meaning behind this order flow trading setups is that sellers are liquidating their positions. This type of footprint pattern works best if the prevailing trend is bearish.
Note* It’s not indicated to trade this order flow trading pattern if it develops in a bullish trend or ranging market.
The second types of order flow trading setups we want you to learn are the B pattern. This is the inverse shape of the P pattern.
The B pattern has a narrow volume profile in the upper half and a wider volume profile in the lower half of the candlestick. The meaning behind this order flow pattern is that buyers are exiting their positions. This type of footprint pattern works best if the prevailing trend is bearish.
See the order flow chart below:
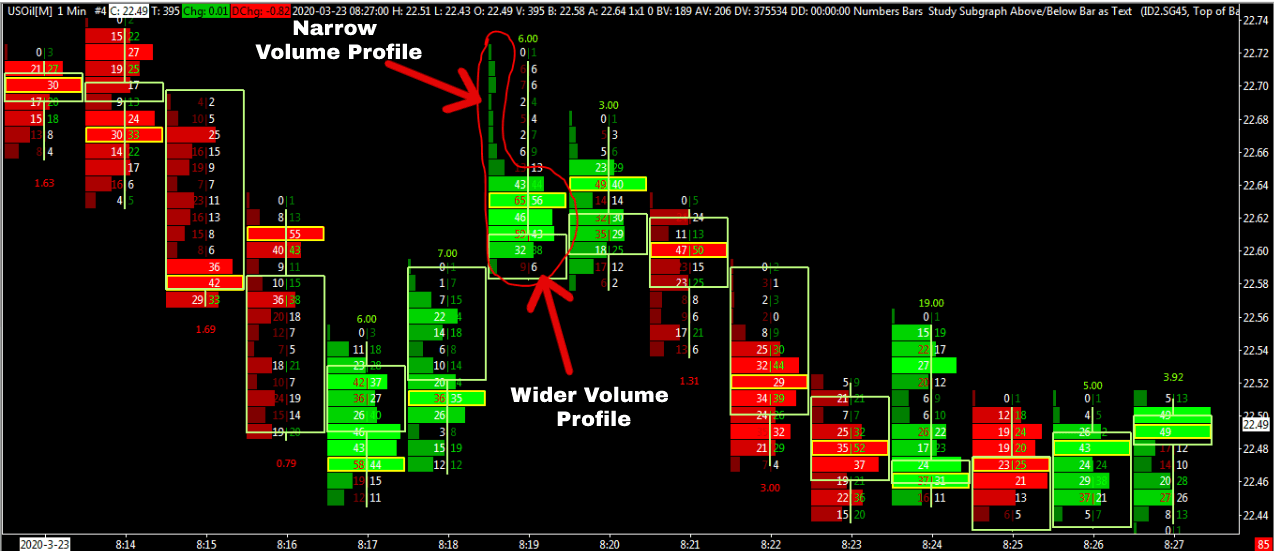
Both the B pattern and the P pattern are reversal trading setups using order flow analysis.
Next, let’s examine how to trade order flow imbalances using footprint chart trading.
Order Flow Trading Imbalances
Order flow imbalances happen when the market shows a very aggressive initiative.
The aggressive initiative is when we see too much buy-side aggressiveness or too much sell-side aggressiveness. When this happens, after an aggressive move the market will often top out (bottom).
The real key to an order flow imbalance is to have a big surge in volume.
There are three trading rules you need to follow:
- We use the order flow imbalance to trade in the direction of the imbalance looking for continuation patterns.
- If it fails to go with the trend, then we look for fill out of the imbalance.
- If we can then move through the imbalance we then look for a reversal.
See the order flow trading setup below:
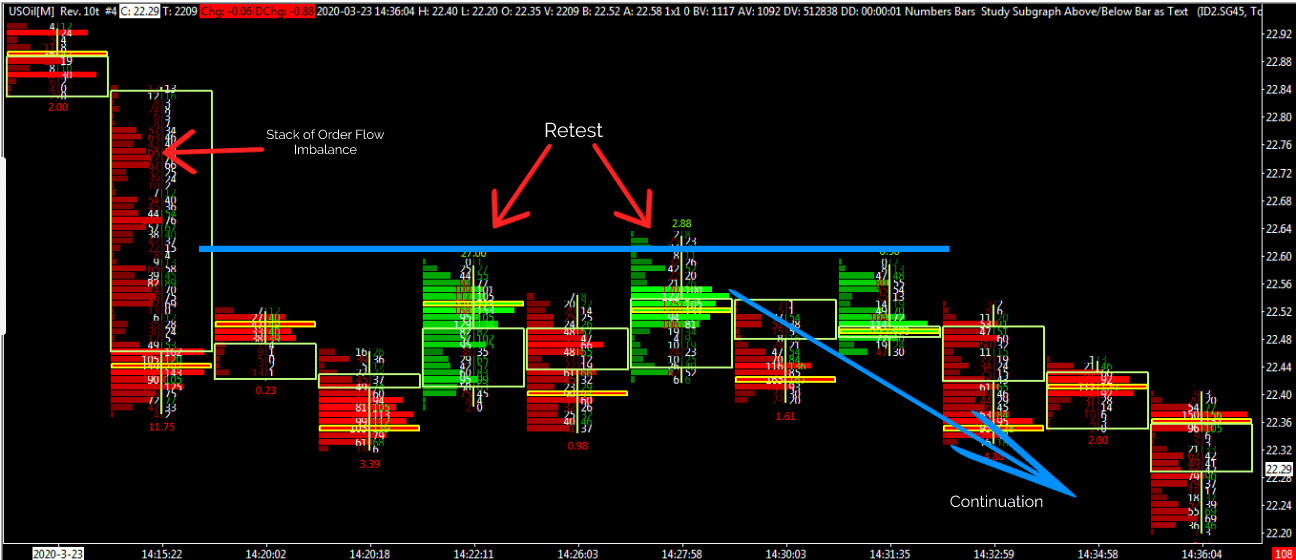
Note* If we throw into the mix the context of the market, we can then add more confluence and can better position ourselves.
Remember, you only have a trade signal when you can effectively access that trade at the right location and in the right time frame. And, that’s where the footprint is so useful.
Final Words – Order Flow Trading Strategy
The essence of order flow trading is to trade based on the actions of the markets, which are displayed by the bid and ask volume that has traded. The order flow trading tools not only show us the buy and sells imbalances, but equally, it shows us the timing of the execution.
The order flow trading strategy has stood the test of time going back to the early 1900s. Although smart money always tries to hide their tracks in the market, we hope we proved that following the big money can be done through order flow analysis. Check out this big money index for more information.
Here is a short recap of what you have learned through this order flow trading guide:
- Trading using order flow is a short-term trading strategy.
- Order flow gives you an open window beyond the candlestick chart.
- How to use the footprint chart to gauge smart money.
- Identify the order flow imbalance.
- Simple order flow trading setups.
Thank you for reading!
Feel free to leave any comments below, we do read them all and will respond.
Order Flow Trading Strategy: Frequently Asked Questions
What is the Order Flow Trading Strategy?
The Order Flow Trading Strategy is a trading method that focuses on analyzing the trading activity of buyers and sellers in the market. It involves using order flow indicators to gain insights into the behavior of market participants and identify potential trade setups.
What are the key components of the Order Flow Trading Strategy?
The key components of the Order Flow Trading Strategy include order flow indicators, price action analysis, and market depth analysis. These tools are used to identify potential trade setups based on the behavior of buyers and sellers in the market.
What are some of the most commonly used order flow indicators?
Some of the most commonly used order flow indicators include the volume profile, order book imbalance, delta, and cumulative delta. These indicators are used to analyze the buying and selling activity of market participants and identify potential areas of support and resistance.
How is price action analysis used in the Order Flow Trading Strategy?
Price action analysis is used in the Order Flow Trading Strategy to identify key levels of support and resistance based on previous market movements. This information is combined with order flow analysis to identify potential trade setups and determine entry and exit points.
What is market depth analysis and how is it used in the Order Flow Trading Strategy?
Market depth analysis involves analyzing the level 2 data for a given market to gain insights into the buying and selling activity of market participants. This information can be used to identify potential areas of support and resistance and determine the strength of a particular trend.
What are some of the benefits of using the Order Flow Trading Strategy?
Some of the benefits of using the Order Flow Trading Strategy include the ability to gain insights into the behavior of market participants, identify potential trade setups with a high degree of accuracy, and determine optimal entry and exit points based on the analysis of order flow data.
What are some potential drawbacks of using the Order Flow Trading Strategy?
One potential drawback of using the Order Flow Trading Strategy is that it can be more complex and time-consuming than other trading methods. Additionally, order flow data can be subject to manipulation by large market players, which can make it difficult to accurately analyze and interpret.
How can I get started using the Order Flow Trading Strategy?
To get started using the Order Flow Trading Strategy, you will need to have access to order flow data and order flow indicators. You can then begin analyzing this data using price action and market depth analysis to identify potential trade setups. It is important to test your strategy thoroughly through back-testing and forward testing to ensure its effectiveness before trading with real money.




What’s up, the whole thing is going sound here and ofcourse every one is sharing facts, that’s actually excellent,keep up writing.
Do you mind if I quote a couple of your articles as long as I provide credit and sources back to your weblog? My blog site is in the exact same niche as yours and my users would truly benefit from some of the information you present here. Please let me know if this okay with you. Regards!
Yes, Of Course, we love the publicity! Thanks