Best Candlestick PDF Guide – 3 Simple Steps
The best candlestick PDF guide will teach you how to read a candlestick chart and what each candle is telling you. Candlestick trading is the most common and easiest form of trading to understand. The candlestick pattern strategies outlined in this guide will reveal to you the secrets of how bankers trade the FX market.
If this is your first time on our website, our team at Trading Strategy Guides welcomes you. Make sure you hit the subscribe button, so you get your Free Trading Strategy every week directly into your email box.
When you first start out on your trading journey, you will be bombarded left and right with new concepts. It can be daunting and confusing to assimilate everything. This trading tutorial will show you how to read candlestick charts for beginners.
We’re going to explain candlesticks in a way that you will remember. If you’re a more advanced trader, this candlestick PDF guide is for you as well. We’re going to share with you a powerful candlestick pattern strategy.
Stay tuned, because we’re going to show you some of the best candlestick patterns that only institutional traders know about.

Thanks for visiting Trading Strategy Guides (TSG)!
You have discovered the most extensive library of trading content on the internet. Our aim is to provide the best educational content to traders of all stages.
Learn Our Trading Best Strategy By our Founder Casey Stubbs
In other words, we want to make YOU a consistent and profitable trader.
If you’re a brand new trader, we recommend hopping over to our ultimate beginner’s guide to trading to learn more.
Ready? Let’s get you familiar with The Best Candlestick Guide!
Table of Contents
Let’s first start with the basics of candlestick trading and how to properly read candlestick charts.
See below:
Understanding Candlestick PDF Guide Charts for Beginners
If you strip away everything you have on your charts, you’re left with a simple candlestick chart. What you’re seeing on the chart below is the raw price data that in Forex jargon is also referred to as the naked price action chart.
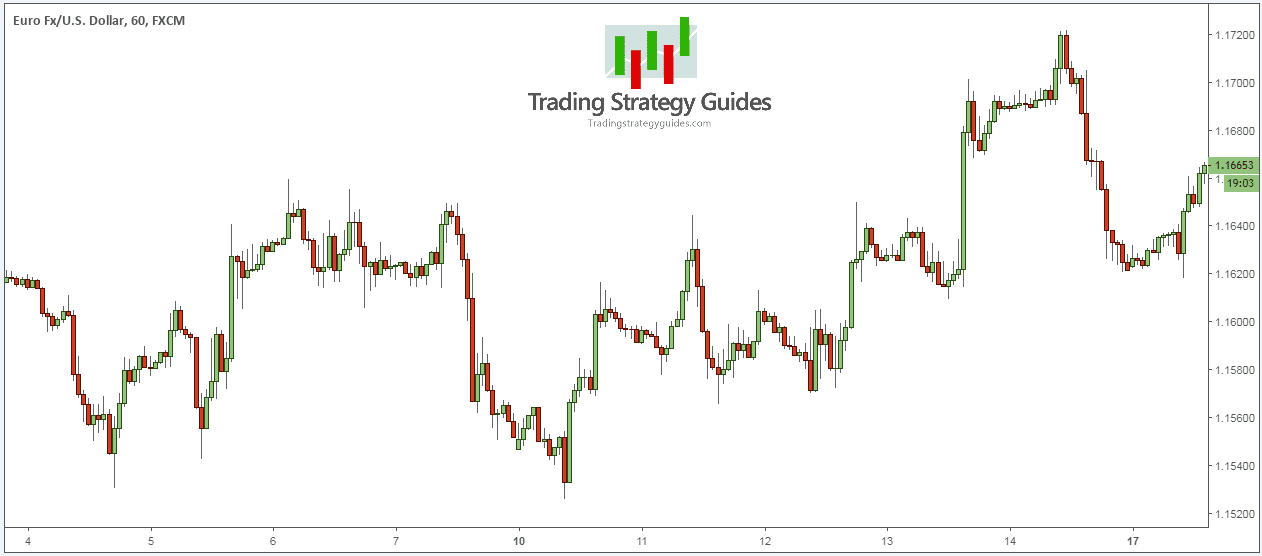
Note #1: Unlike Renko charts, which we have covered in our previous chart trading guide, candlestick charts incorporate the time element.
The most important pieces of information you need as a trader are current and historical prices. The candlestick price will tell you exactly what the price is doing at any given time. The candlestick price chart also gives you a unique insight into the market sentiment.
A candlestick price chart is made up of lots of individual candles that have different shapes, which form different candlestick patterns.
There are three types of candlestick candles:
- Bullish candlestick – These are green candles and it shows that the price has increased over the selected time period. In other words, the closing price is higher than the opening price.
- Bearish candlestick – These are red candles and it shows that the price has decreased over the selected time period. In other words, the closing price is lower than the opening price.
- Neutral candlesticks – These are candles without a body and the opening price is equal to the closing price.
Besides the opening and the closing price, the candlestick chart also gives us information about the highest and lowest price during the time period selected.
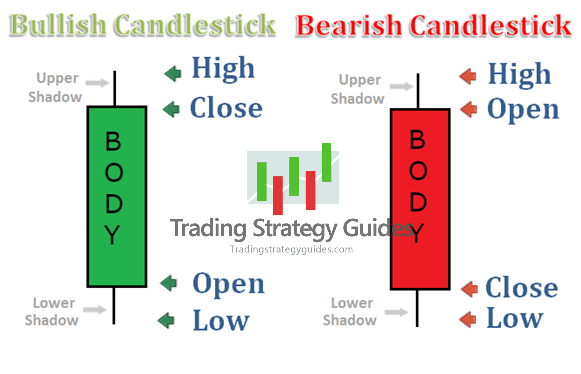
The bars above and below the body are called shadows. In Forex jargon, they are also called ‘wicks’ or ‘tails’.
Get Our Free Swing Trading Report Today!
- Entry Points
- Exit Points
- Risk Managament
- Time Saving Tips
In technical analysis, the Japanese candlesticks can display different types of price formation that are at the base of many candlestick pattern strategies. If you want to explore the most popular chart patterns, please check out our step-by-step trading guide here: Chart Pattern Trading Strategy Step-by-Step Guide.
Now, do you want to learn:
How to read a candlestick chart for day trading?
See below:
Best candlestick patterns for day trading?
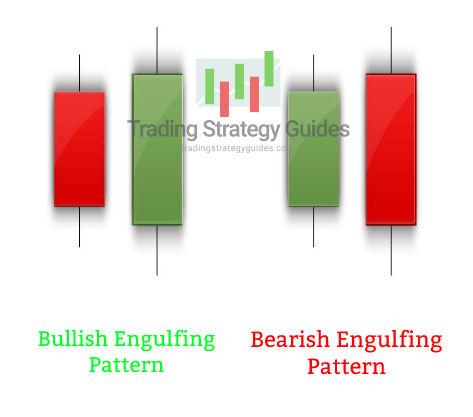
Bullish engulfing and bearish engulfing are the best candlestick patterns for day trading. You need to learn to recognize these patterns if you really want to have a good day trading experience.
In simple terms, when the body of a candlestick engulfs the entire body of the previous candlestick, it’s what we called the engulfing candlestick pattern.
See the forex chart below:
If you want to learn how to trade the engulfing pattern check our strategy here: Engulfing Trading Strategy – The Fade.
Other simple and effective day trading patterns are:
- The 80-20 candlestick patterns
- Three little Indians candlestick patterns
- Hammer candlestick
Next…
Let’s look at some Japanese candlestick patterns for swing trading.
See below:
Best candlestick patterns for swing trading?
The pump and run are the best candlestick patterns for swing trading. The nice thing about this pattern is that it’s a very aggressive trading strategy to capture tops and bottoms.
If you want to learn more about the pump and dump candlestick patterns check our full trading guide HERE.
In this case, the candlestick chart analysis is done by studying how fast the price changes in relation to something that we call a lead-in trendline.
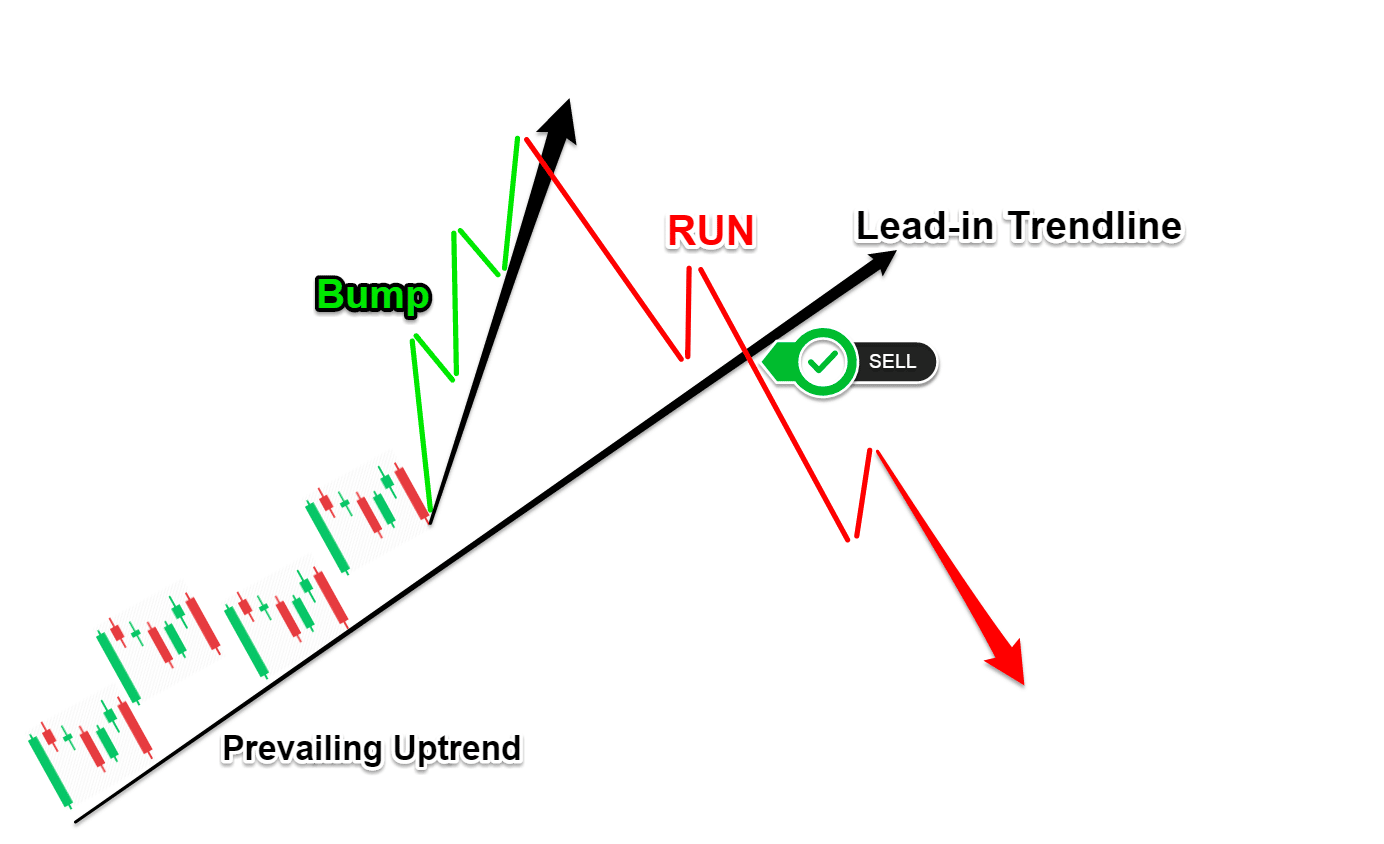
The top 3 candlesticks patterns for swing trading are:
- Head and Shoulder pattern along with the advanced version the Quasimodo pattern
- Double tops and double bottoms
- The Doji sandwich the best H4 forex strategy
Moving on…
Let’s see what the best candlestick patterns strategy is to level up your intraday game.
Checkout Casey’ Stubbs Book which has a complete trading system.
Click Here to Get this book which teaches everything you need to know about how to trade successfully.
Best candlestick patterns for scalping?
The shooting star is the best candlestick pattern for scalping. This candlestick pattern will help you to stop losing money scalping the market. The shooting stars are bearish candlestick patterns while hammers are bullish candlestick patterns.
A simple forex scalping strategy based on the shooting star can be helpful in building up your trading strategy arsenal.
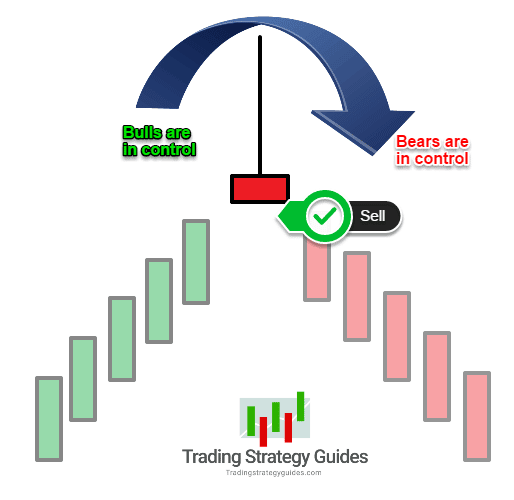
For now, we’re going to focus on the best candlestick patterns that many banks use against retail traders.
You can also checkout the ascending scallop pattern
Candlestick Patterns Trading Strategy
If you want to get the most out of what the candlesticks are showing, let’s explore the best candlestick patterns you can ever use. We’re going to show you some candlestick patterns explained with examples. If you understand the psychology behind what the candlesticks are showing, it can make your life as a trader a lot easier.
Not only that, you get a possible insight into the battle between the buyers and sellers. Chart patterns can also be used to trigger your trades.
In this best candlestick PDF guide, we’re going to reveal a secret candlestick pattern used among bank traders. This forex candlestick pattern we’re talking about is the ORB Nr4 pattern developed by hedge fund manager Toby Crabel.
Toby Crable is probably one of the less known profitable traders. Even though in 2005, Toby Crabel was described by Financial Time as “the most well-known trader on the counter-trend side,” he still remains an unknown name in the retail industry.
The reason why we mention Toby Crabel’s work is because he is the father of the ORB pattern, aka the Opening Range Breakout pattern. The ORB pattern is regarded as being the most powerful trading tools in the last 25 years.
This powerful trading technique has helped legendary guru trader Larry Williams to turn $10,000 into $1 million in less than a year.
Step #1 How to Identify the ORB Nr4
The ORB pattern is defined as a trade taken at a fixed value of the opening range.
The Opening Range Breakout trade is more effective if taken after an inside day that has its daily range smaller than the previous 3 days. This is what the Nr4 stands for. You have three candles followed by another candle, with a daily range that’s narrower than the previous three days.
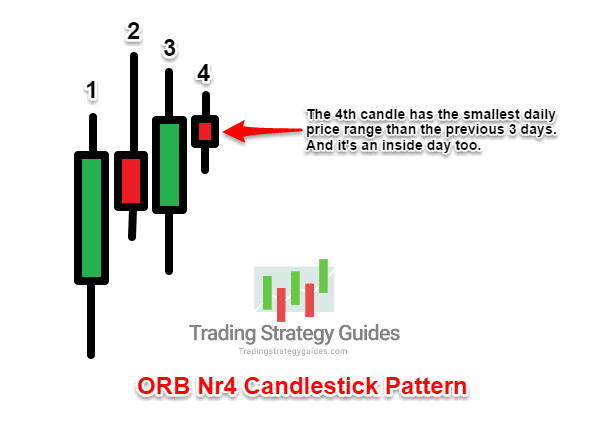
Note #2: The 4th day doesn’t necessarily need to be an inside day, it only needs to have its daily range smaller than the previous 3 days. However, inside days tend to produce higher success rates.
Here is how an actual ORB Nr4 pattern looks like on a Forex candlestick chart:
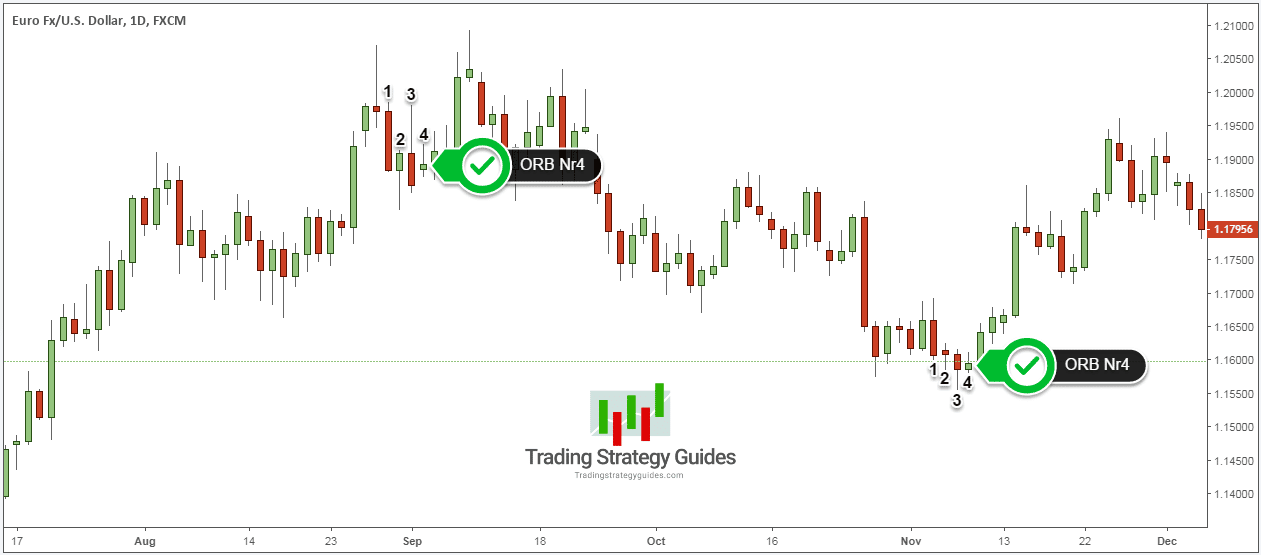
The ORB Nr4 pattern can be one of the best candlestick patterns for intraday trading too. You simply have to apply the same rules outlined in this guide on your favorite intraday chart
What if we told you that 40% of the time, the first trading hour can tell you the high and low of the day. Our candlestick patterns strategy incorporates this price behavior so you can better manage your risk and set your targets.
Basically, you can become a proficient trader.
Like with all our trading strategies, we’re going to give you first the trading rules by going through an actual live trade example that uses the best candlestick patterns mentioned in this PDF guide.
Get Our Free Swing Trading Report Today!
- Entry Points
- Exit Points
- Risk Managament
- Time Saving Tips
Step #2: Identify the best candlestick patterns and mark the high and the low of the 4th candle
When you search for the ORB Nr4 candlestick chart pattern keep in mind two things:
- The Daily range of the 4th candle needs to be narrow and smaller than the previous 3 candles.
- The 4th candle price range also needs to be inside candle number 3.
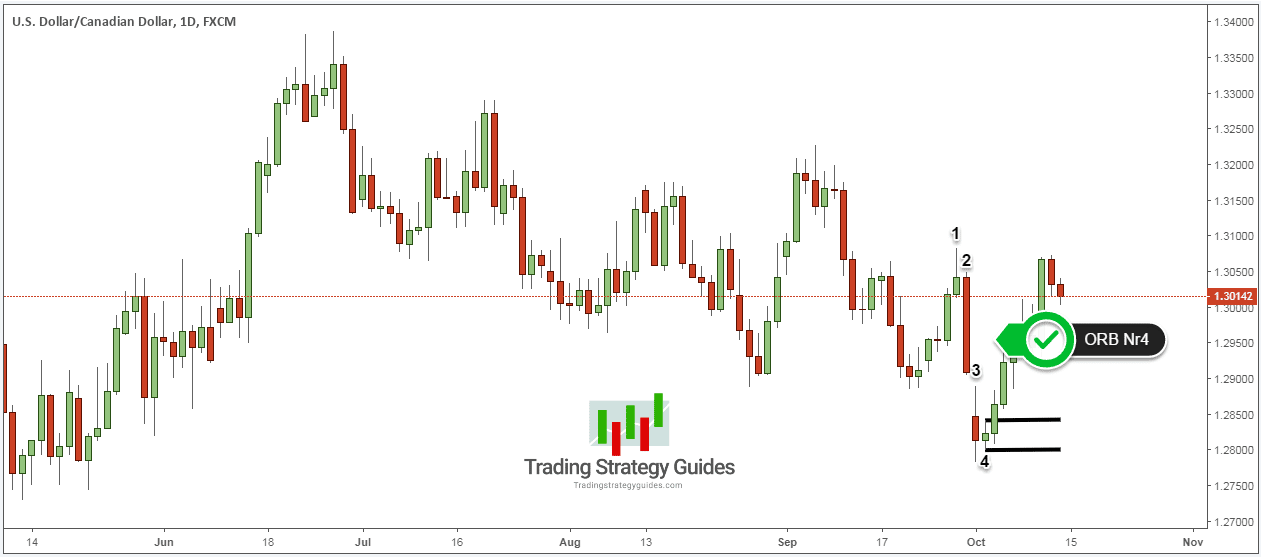
The ORB Nr4 pattern in the chart above is a bullish candlestick pattern because it leads to a bullish move.
Narrow daily trading ranges suggest contraction. And contraction always leads to expansion. This is kind of a general rule because the markets do move from periods of contractions to periods of expansion.
This is the reason why this ORB Nr4 candlestick pattern is so powerful.
Step #3: Switch to 1h TF and Buy if we break the high, Sell if we break the low of the Nr4 candle.
Our trade was taken the next day after the Nr4 pattern showed up. In order to have a clear view of the short-term price action, we need to switch our focus to the one-hour time frame.
Note #3: Only Buy or Sell if the breakout happens during the first 5 hours of the new trading day.
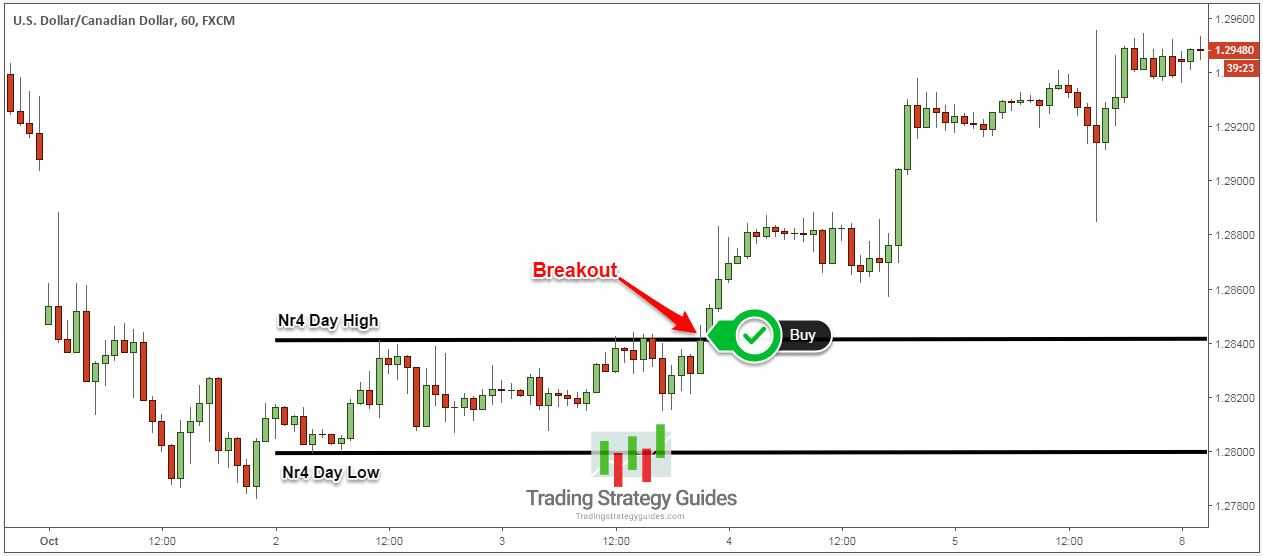
We use the Opening Range Breakout technique to time the market and have an effective trade entry.
Trades based on the ORB – Nr4 candlestick chart pattern will show you a profit instantly.
Now, if the trade is not showing you a profit right away, then your trade becomes more vulnerable. As a general rule, if after the first trading hour your trade is not in the green, you can safely close the trade at the market.
Of course, you can only do that if your stop loss hasn’t been triggered in the meantime.
Now, let’s outline where to place our protective stop loss and where to exit our profitable trade.
See below:
Step #4: Place SL below NR4 day low, Take profit using a trailing SL below each 1h candle low
For buy trades, hide your stop loss below Nr4 day low. The ORB – Nr4 pattern tends to precede strong trend day activity, so your stop loss should be rarely hit.
Our take profit strategy is fairly easy and it’s slightly modified from the original strategy highlighted in the “Day Trading with Short Term Price Patterns and Opening Range Breakout” book written by Toby Crabel.
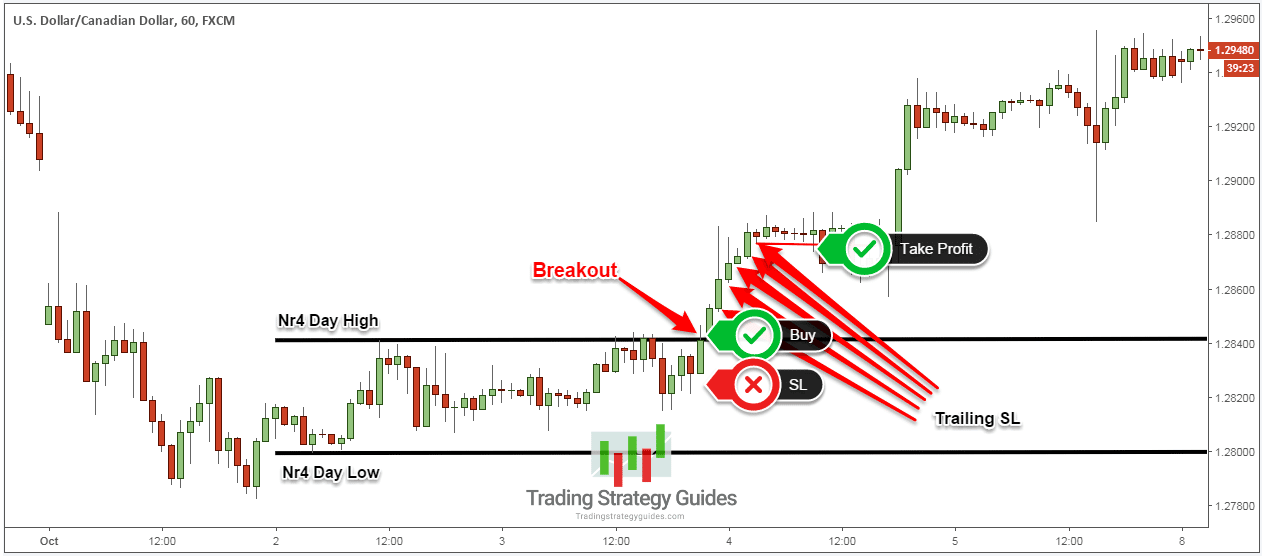
Even though the ORB NR4 pattern tends to lead to trend trading days, we’re more conservative and want to quickly take profits. We would rather trail our stop loss below each 1-hour candle low and wait for the market to reverse to take profits.
Candlestick Patterns In Action
As explained in the previous paragraphs, each candle provides a valued source of information whether the market remains/changes to bullish, bearish or indecisive. Some of the candlesticks, however, do provide more value than others. These candlesticks have various names because they are of more importance than regular and “normal” candles.
Certain candlestick patterns consist of 1 candle. Other candlestick patterns need two candles to be complete, or even up to 3 candles to form a combination formation.
Candlestick Patterns in Market Structure
Candlesticks are the building blocks of what will later become a swing high or swing low. The swing or swing low in turn can either be impulsive / momentum OR corrective / consolidation. The candlestick patterns usually occur at the bottom or top of these swing highs and swing lows, but can also provide information of continuation. Also, candlestick patterns often indicate the beginning and end of momentum and corrections.
The various swing highs and swing lows that are labeled as momentum and correction can, in turn, be the building blocks of a trend channel, trend line, and chart pattern.
Candle Stick Patterns Video
I have posted this video if you are interested in becoming a more advanced candlestick trader.
Candlestick Pattern Strategy
Candlesticks can be used for trading Forex strategies. How these candles are used will differ from strategy to strategy, and from trader to trader. Some Forex traders even opt to trade solely based on the information provided by candlesticks. They make their analysis and trading decisions/management based on candlestick patterns. An example could be for instance trading pin bars.
Other traders use candlesticks as supportive information. They seek confirmation of their analysis via candlestick patterns. For example, traders could be waiting for a bounce at a trend line by analyzing candles. This strategy means that traders use candles as part of a broader strategy and use it as confluence. Price action signals at major support and resistance, for instance, is a method that capitalizes on candlestick patterns in combination with other technical analysis.
Last but not least, some traders may choose not to use candlestick patterns because they prefer other concepts. All traders need to find a balance in their tools, indicators, and analysis.
Do you use Japanese candlestick patterns for analysis and trade management? If yes, are there any particular candlestick patterns you like most? If not, why not? Let us know down below!
Thanks for sharing this candlestick patterns training article and Good Trading!
Trade Setups Based on the Candlestick Formations:
With the start of a new month, Forex traders have the luxury of analyzing new monthly candlesticks and patterns.
In January of 2015, there was a wide range of valuable information. This post reviews those interesting opportunities and conclusions on the majors which we can learn from for future trades to find setups based on candlesticks formations of the major forex pairs.
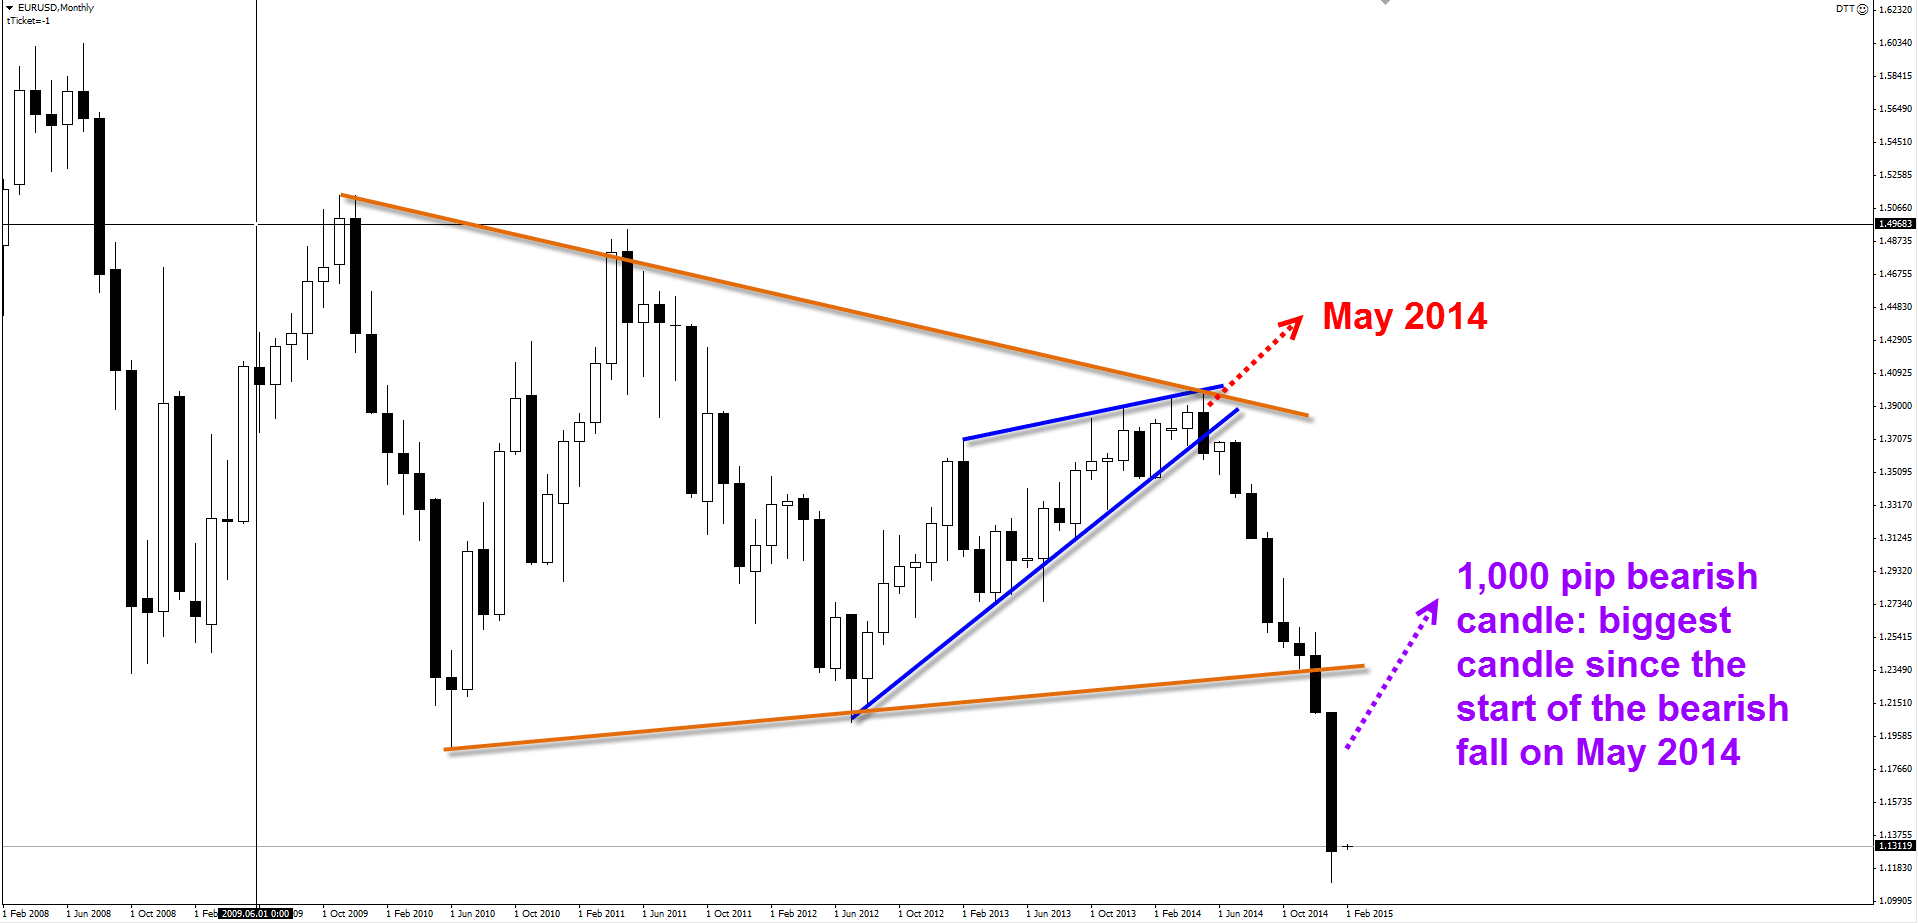
The EURUSD monthly candle of January 2015 was not only heavily bearish, but it was also a massive candle: more than 1,000 pip from high to low. This has been by far the largest bearish candle since the downtrend started in May 2014.
The wick at the bottom candle represents +/- 185 pips which are 18.5% of the entire candle. For the bears, it was certainly a decently strong close but not as sturdy as July ’14, August ’14, and December ’14 candlesticks.
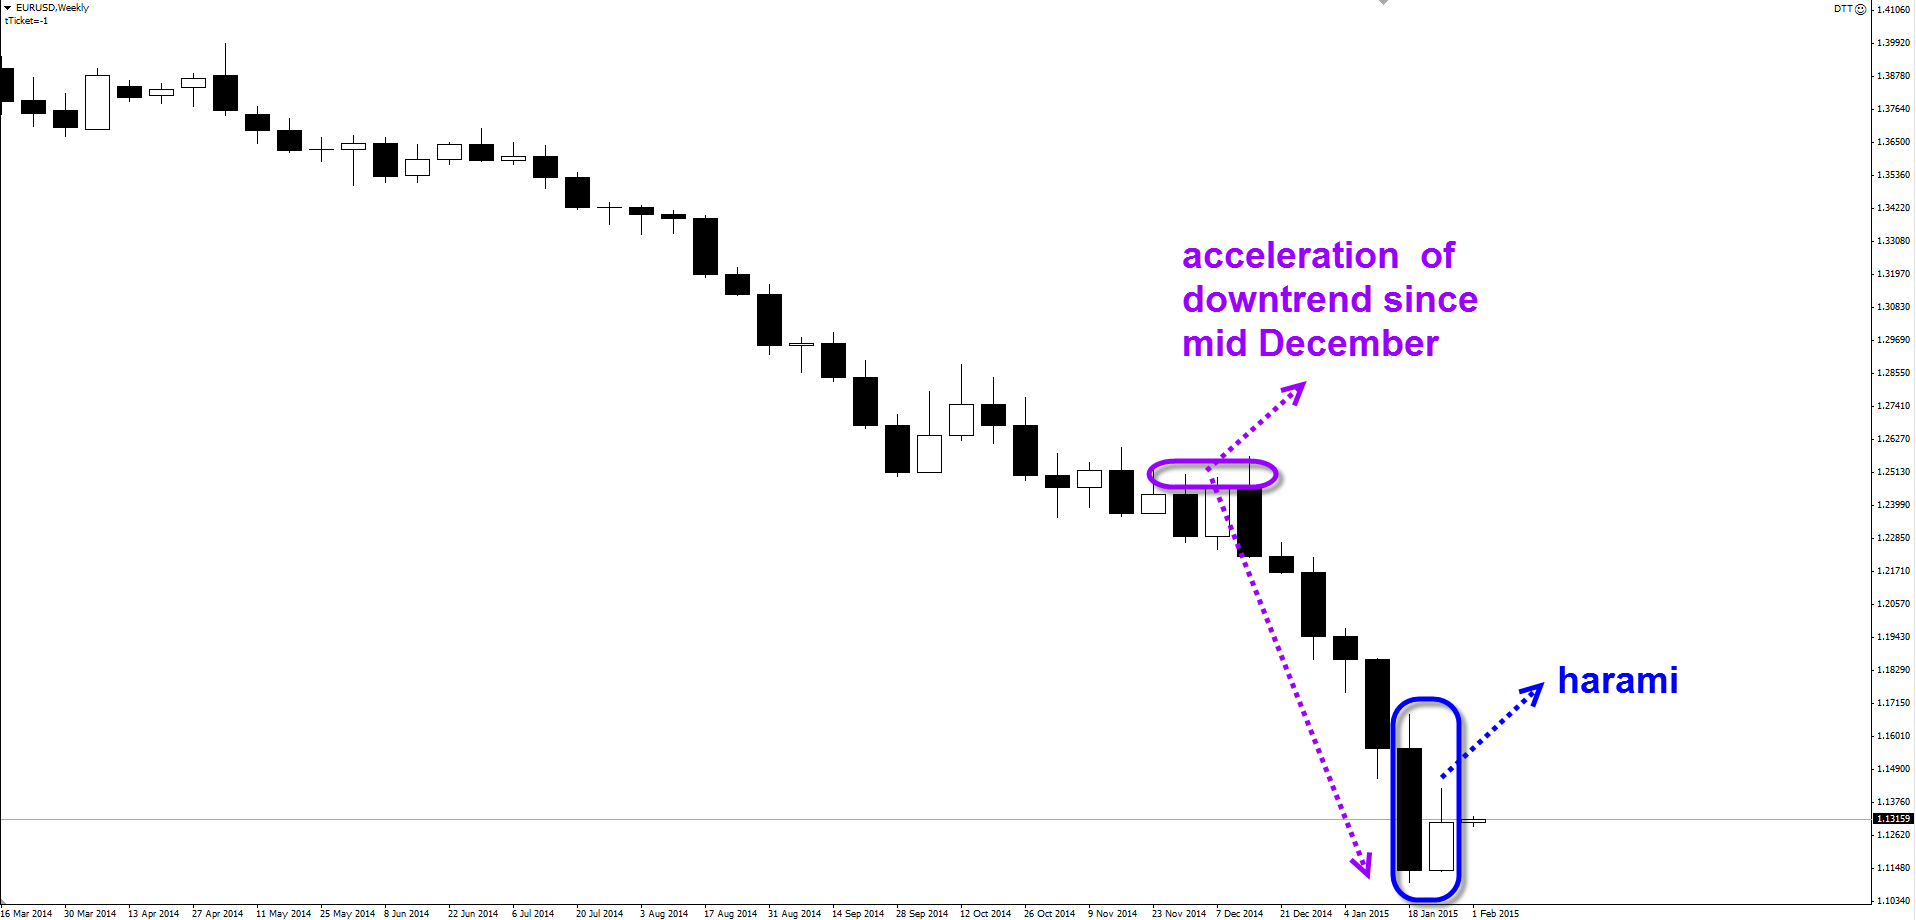
When analyzing the weekly chart, the EURUSD showed bullish candlestick patterns for the first time a 7 week period. It is called a Harami candlestick and the pattern indicates a potential bullish reversal. This could set the tone for a bullish EURUSD this upcoming week.
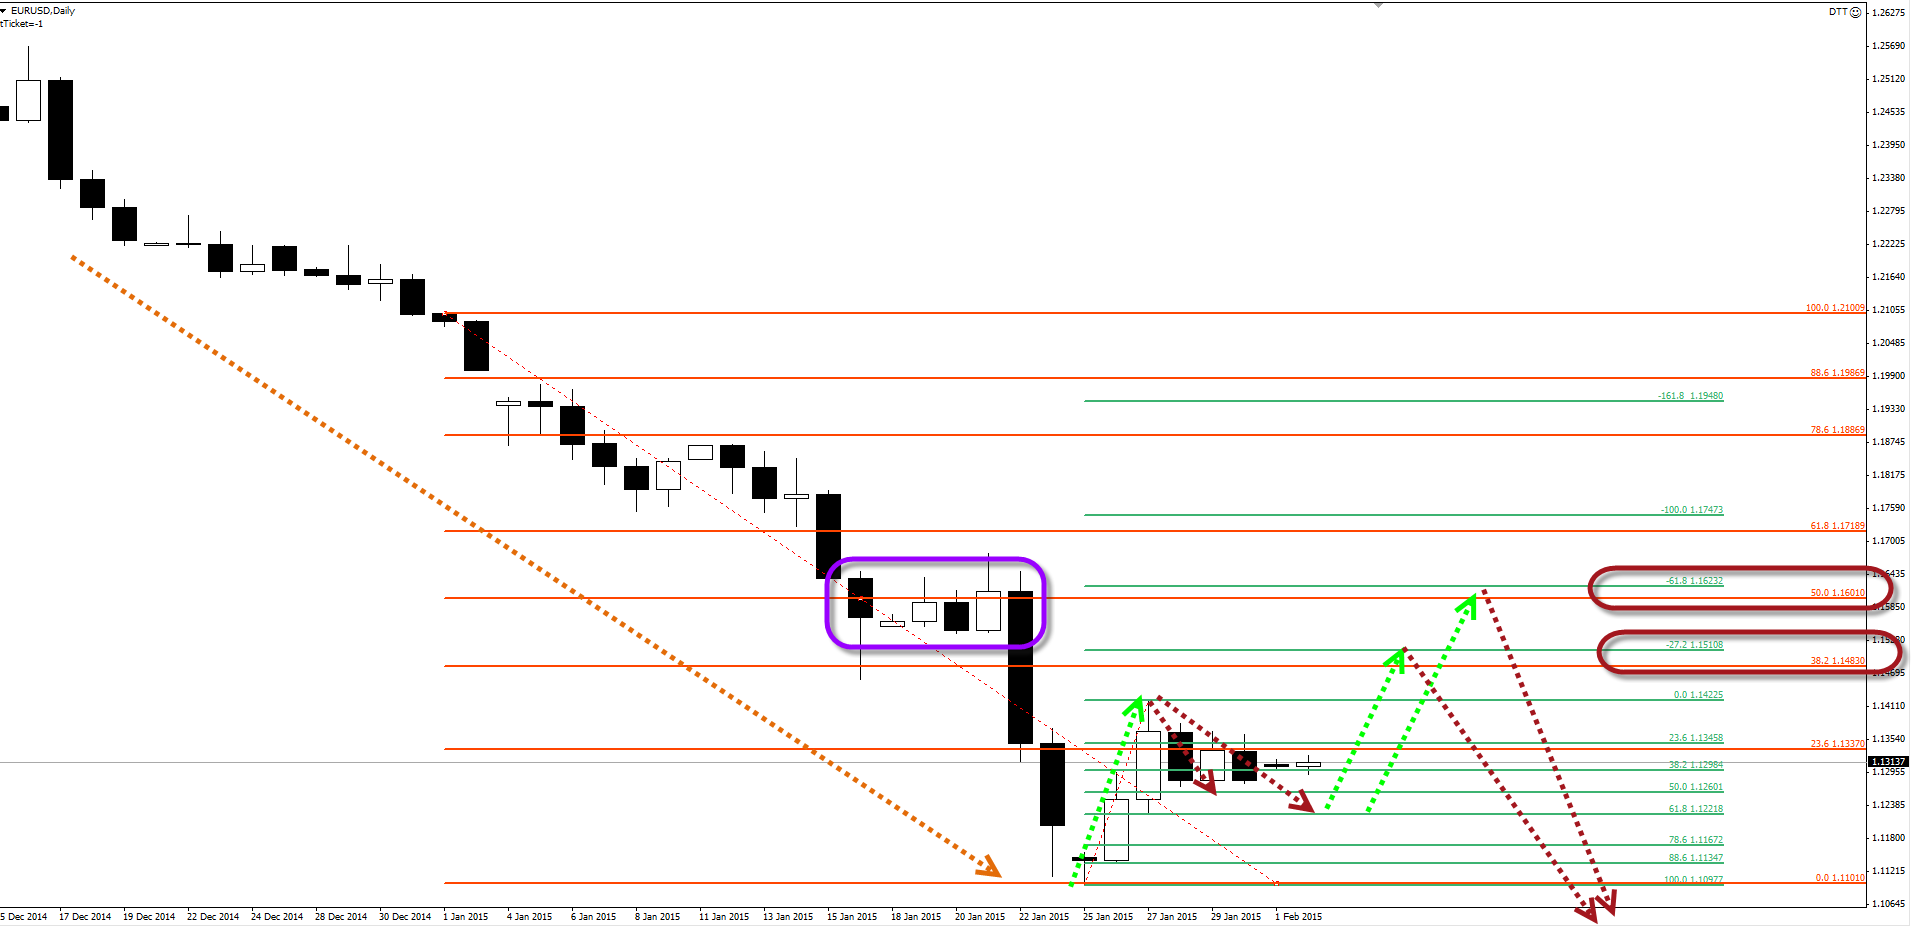
When I place a Fibonacci tool on the Harami weekly candle then the -27.2 and -61.8 Fibonacci levels (green Fib) are the key targets for the following reasons:
- The previous consolidation zone (purple circle) could act as a resistance zone;
- A zigzag correction would be completed (green arrows);
- The bigger trend remains down (orange arrow);
- The January candle is bearish and when the price reaches the Fibonacci targets (orange Fib), it will have retraced back to the 38.2 and 50% Fib levels of the monthly candle.
The path of the highest probability for the EURUSD, therefore, seems to be a bullish zigzag followed by a downtrend continuation. This analysis is highly dependent on the NFP figures. The other majors are showing a different situation.
Strong monthly Support Level and Candle Stick Pattern
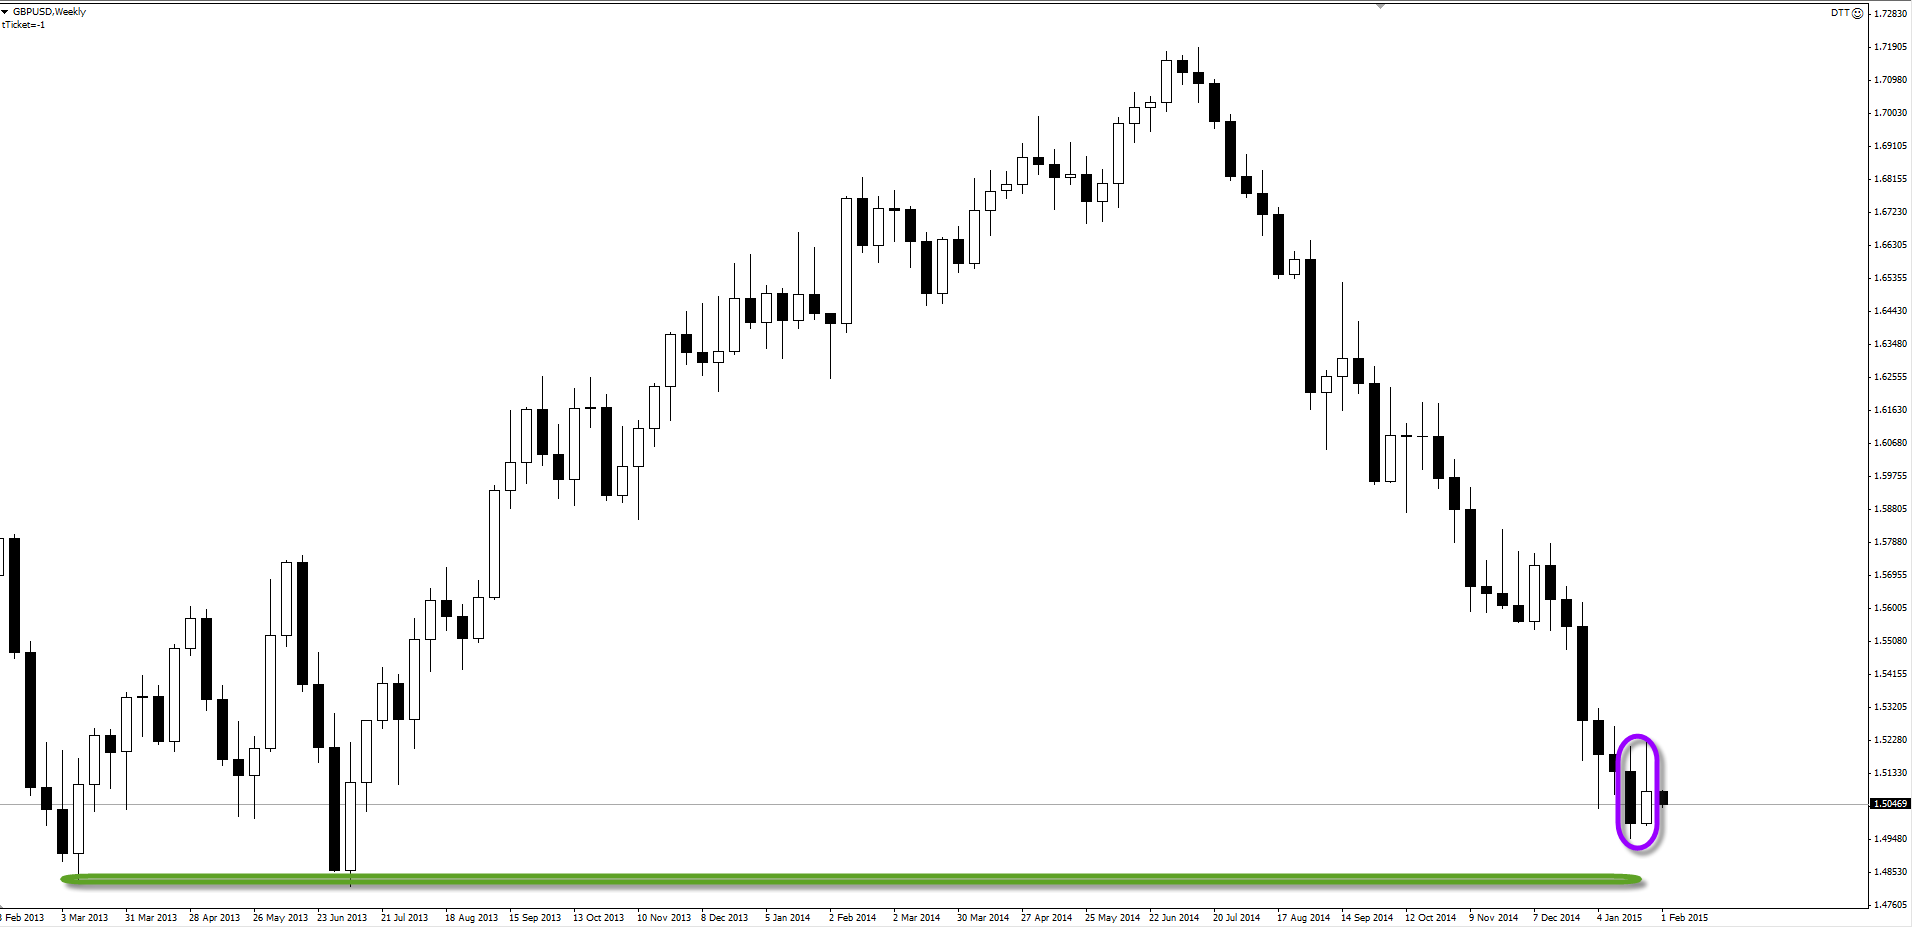
The GBPUSD bearishness seems substantially less interesting to me due to various reasons:
- It has a GBP interest rate announcement on Thursday;
- Monthly support is close by;
- January’s candle was bearish but not impulsive.
- The weekly candle closed bullish as well;
- The GBP has been showing strength against other currencies.
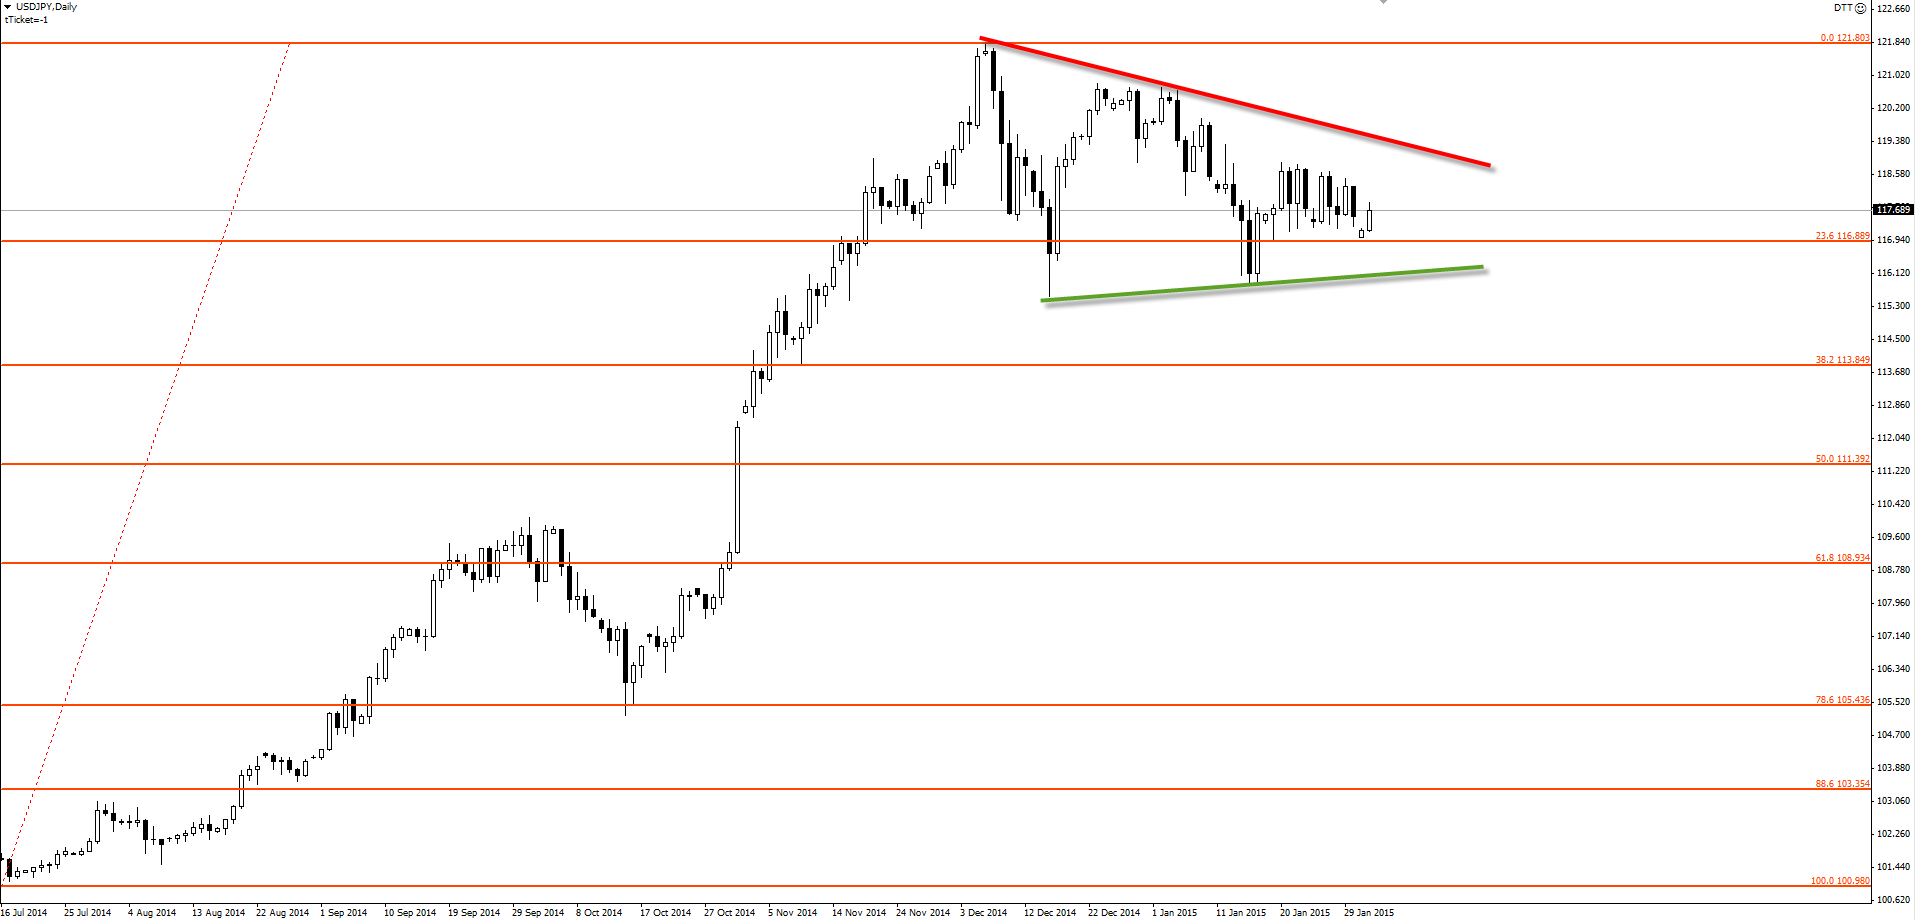
The USDJPY bullishness was certainly not visible on the USDJPY during January. Its candle closed bearish and indicates a decent to high chance of further consolidation. I am expecting the triangle to continue before any bullish (or bearish break) occurs.
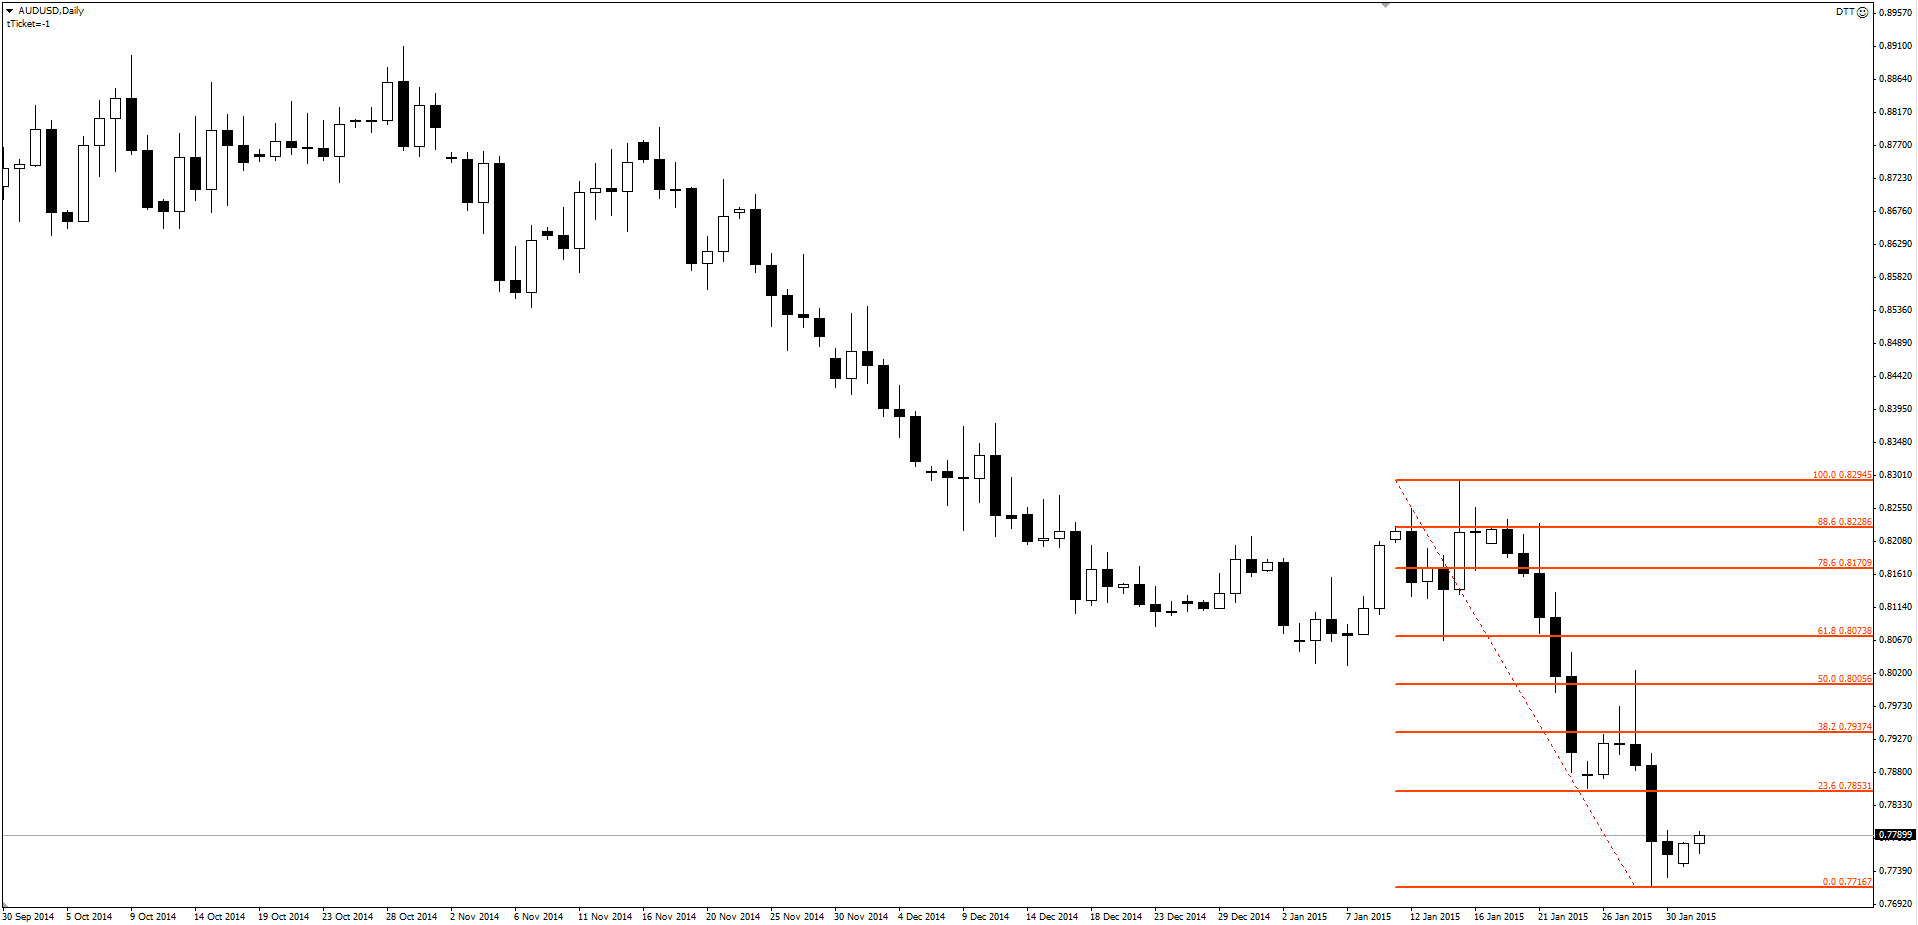
Contrary to the EURUSD and GBPUSD, the AUDUSD not only had very big bearish candlestick patterns in the January candle but also has a bearish weekly candle the previous week. There was no crucial bounce for the AUDUSD and hence I am expecting a more bearish trend. Technically speaking I am looking for more downside continuation upon the retracement of the monthly candle (orange Fib). The best turning spot is 50% due to the resistance on the left.
Master Candle Setup Example
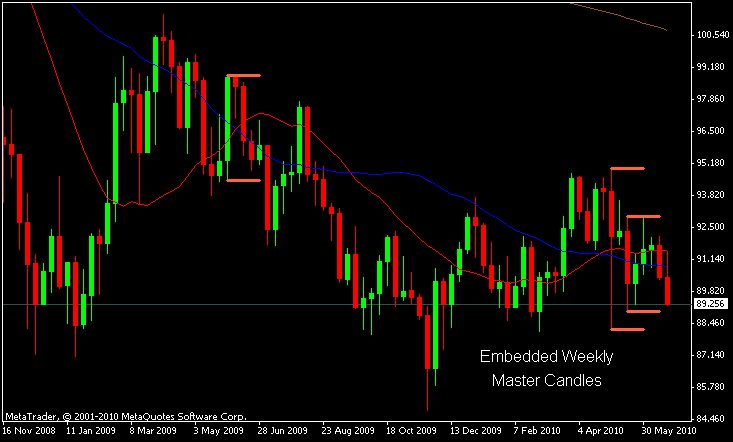
Looking at a weekly USDJPY chart, you will notice that we have embedded weekly Master Candles set up. For those of you unfamiliar with Master Candles, they are candles that engulf the next four following candles. Trading a break of a Master Candle on any time frame can be very profitable, but trading a break of a weekly Master Candle can be especially profitable.
Usually, when I trade hourly master candles, I place my stop on the opposite side of the master candle. If the candle is too wide to maintain my risk parameters, I will place my stop in the center of the master candle.
Since this master candle was around 385 pips wide, I planned to trade the break as if it were a break of a lower time frame candle and try to set my risk around 50 pips. That way I will be able to trade the break with decent size and hopefully get a piece of the initial move.
In this example, the price action was about 25 pips above the low of the inner master candle which is near 88.95. I placed a pending sell order at 88.85 to allow for a head fake and I’m setting my stop at 89.35.
When I have 20 pips profit, I took 1/3 of my trade-off and move my stop to break even. From there, I followed my stops down using the hourly chart, placing my stop at the top of the prior hourly bar.
Best Candlestick PDF guide FAQ
What Is The Best candlestick pattern for crypto?
The Spike and Ledge pattern by Linda Raschke is the best candlestick pattern for cryptocurrencies. Every crypto trader should know this pattern especially if you want to keep up with the volatility in the cryptocurrency market.
What Is The Best candlestick pattern for penny stocks?
The OHL trades are the best candlestick patterns for penny stocks. This trading pattern allows everyone to establish a position during the first 5 minutes of the trading day.
What Is The Best candlestick pattern for binary options?
The best candlestick patterns for binary options are the pin bars, bearish and bullish outside bars, the 3 white soldiers, and the 3 black crows. For binary options trading, candlestick patterns are the most reliable techniques you can use to place your bets on.
What Is The Best candlestick pattern to earn a profit?
The best candlestick pattern to profit in any market and across different time frames is the Hot Dog pattern. This is a unique pattern taught to our subscribers that can be used to detect bullish and bearish reversals as well as continuations in any market.
What Is The Best Candlestick Pattern to Buy Stocks?
The best candlestick pattern to buy stocks is the 3-bar strategy. This candlestick pattern is an all-in-one trading strategy is a trend-dependent strategy that can ride both bullish markets and bearish markets.
Best Candlestick PDF Guide Video
Conclusion – Best Candlestick Patterns
The Best Candlestick PDF Guide is a result of a series of research that leads us to find tradeable market tendencies. The price of any market follows some mechanical laws that can be observed through candlestick chart patterns. Having some definable rules of entry based on candlestick patterns can really help the aspiring trader.
Some of the best candlestick patterns are more predictable once you have a framework developed around these chart patterns. As a trader, your obligations are to apply these trading concepts inside your own understanding of the market. Be sure to read about our megaphone pattern trading guide!
If you manage to combine the two things, you can develop a candlestick pattern strategy.
Thank you for reading!
Feel free to leave any comments below, we do read them all and will respond.
Looking to invest $1,000 Right Now?
Our market experts at Trading Strategy Guides believe there’s a more lucrative opportunity than simply just focusing on the right trading strategy. In fact, before you make any decisions about the market, consider this:
Our team of analysts specializing in Swing Trading just unveiled their top analysis for traders looking to capitalize on market momentum.
At Trading Strategy Guides, we want to make sure you understand the market’s momentum before entering in a trade.
Our Swing Trading Reports have helped hundreds of traders find success and beat the market consistently. Don’t miss the next opportunity!
Best Candlestick Guide PDF Download
Please Share this Candlestick Trading Strategy Below and keep it for your own personal use! Thanks, Traders!





I need pdf of candlesticks
If you have then share with me
https://f.hubspotusercontent40.net/hubfs/3799241/Assets/Best%20Candlestick%20PDF%20Guide.docx.pdf
Hi can i have candle stick pdf
https://f.hubspotusercontent40.net/hubfs/3799241/Assets/Best%20Candlestick%20PDF%20Guide.docx.pdf
https://f.hubspotusercontent40.net/hubfs/3799241/Assets/Best%20Candlestick%20PDF%20Guide.docx.pdf
I need pdf of candlesticks for example candlesticks names and explanations
Here you go.
https://report.tradingstrategyguides.com/price-action-free-strategy
https://f.hubspotusercontent40.net/hubfs/3799241/Assets/Best%20Candlestick%20PDF%20Guide.docx.pdf
Yes i need the candle stick pattern pdf….
https://f.hubspotusercontent40.net/hubfs/3799241/Assets/Best%20Candlestick%20PDF%20Guide.docx.pdf
Good information. I’m in for giving it a try. Thank ou
very helpful, just not sure of what the meaning is for, And its an inside day too?
The Nr4 strategy is wonderful. Please can it also work for stock tradings?
yes it works for stocks very well.
I need pdf of candlesticks for example candlesticks names and explanations
https://f.hubspotusercontent40.net/hubfs/3799241/Assets/Best%20Candlestick%20PDF%20Guide.docx.pdf
Yes l need pdf file
https://f.hubspotusercontent40.net/hubfs/3799241/Assets/Best%20Candlestick%20PDF%20Guide.docx.pdf
Yes i need the candle stick pattern pdf format please
https://f.hubspotusercontent40.net/hubfs/3799241/Assets/Best%20Candlestick%20PDF%20Guide.docx.pdf
Pdf
https://f.hubspotusercontent40.net/hubfs/3799241/Assets/Best%20Candlestick%20PDF%20Guide.docx.pdf