Double Bottom Chart Pattern Strategy: An Unfair Advantage

This trading strategy tutorial can teach you how to trade the Double Bottom Chart Pattern Strategy. The double bottom reversal pattern is different from the triple bottom pattern and triple top pattern. However, it is similar to the double-top pattern. The only difference is it develops at the end of a bearish trend.
Our team at Trading Strategy Guides is launching a new series of articles called Chart Pattern Trading Strategies. It was created to enhance and elevate your trading to a new level.
Furthermore, the chart pattern trading strategy will give you a framework for methodically examining the fight between the bulls and the bears. The most profitable chart patterns are the ones that tell you who is winning the battle between the bulls and the bears.

Thanks for visiting Trading Strategy Guides (TSG)!
You have discovered the most extensive library of trading content on the internet. Our aim is to provide the best educational content to traders of all stages.
Learn Our Trading Best Strategy By our Founder Casey Stubbs
In other words, we want to make YOU a consistent and profitable trader.
If you’re a brand new trader, we recommend hopping over to our ultimate beginner’s guide to trading to learn more.
The double bottom Forex reversal, as the name suggests, is a trend reversal pattern. It is basically going to turn a downtrend into an uptrend. You can trade this chart pattern strategy in any time frame. However, the bigger the time frame, the bigger the potential profit.
If you are a day trader or a swing trader, it’s still good to learn the power of simple chart pattern formations. It can help you better understand the price action.
Moving forward, we’re going to discuss what makes a good reversal. We will highlight five basic trading rules to conquer the markets with the Double-Bottom Chart Pattern Strategy.
Table of Contents
What Is Double Bottom Reversal?
The double bottom breakout is a bullish reversal trading pattern that emerges at the end of a bearish trend. It’s composed of two consecutive bottoms with approximately the same equal lows. This differs from the double top breakout because the setups we’re looking for will be long trades instead of short ones.
Moreover, the first low forms when the bearish trend finds support, and the price retraces until it finds a resistance level that we call the neckline. You may also enjoy reading the Symmetrical Triangle Trading Strategy.
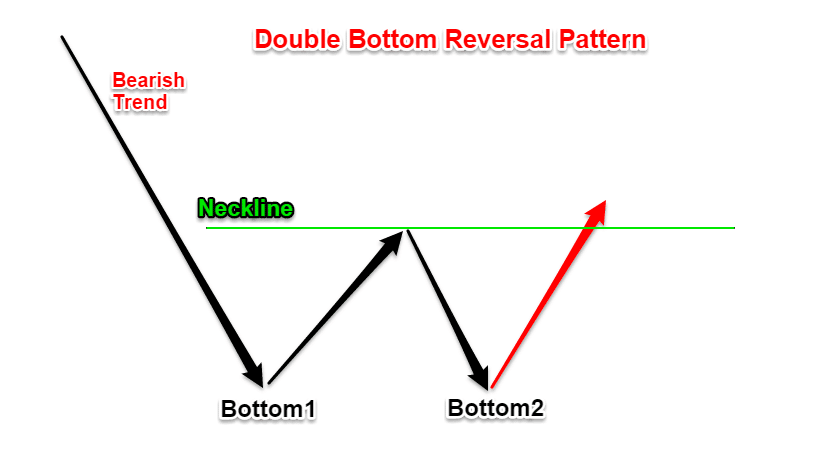
In the second phase, the price moves downwards towards the support created early by the first peak, but it fails to break it and instead rallies to the neckline again.
The Psychology Behind Double Bottom Reversal
The pattern highlights the battle between the bulls and the bears.
This works because other market participants like to wait for confirmation that the support level will hold before committing any real money to a trade.
After the first bottom has been accepted and recognized by other traders, more people can now identify the support level and trade the second bottom.
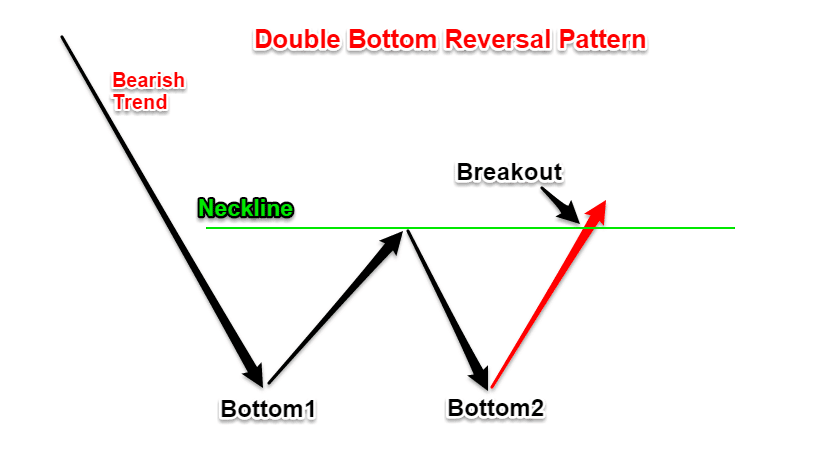
The bears will only capitulate when the breakout occurs. This is clear evidence that the market tide is turning around. So, the reversal is confirmed once the neckline is broken.
Now, let’s see how you can effectively trade with the strategy and make profits from using naked charts.
How to Use the Double-bottom Chart Pattern Strategy – Buy Rules
The pattern is a good representation of seller exhaustion. When the sellers are running out of fuel, that’s the time when a trend reversal usually happens.
Moreover, the strategy also offers an easy way to determine your profit objectives. It is also a place to hide your protective stop loss.
Trading with these techniques is much different than trading tops and bottoms. This is because, with our strategy, you have to be patient and wait for the trade setup to develop.
To trade the double-bottom breakout, you‘ll basically need just three things:
- A prevailing bearish trend.
- Two equal bottoms at the support level.
- Candlestick breakout of the neckline.
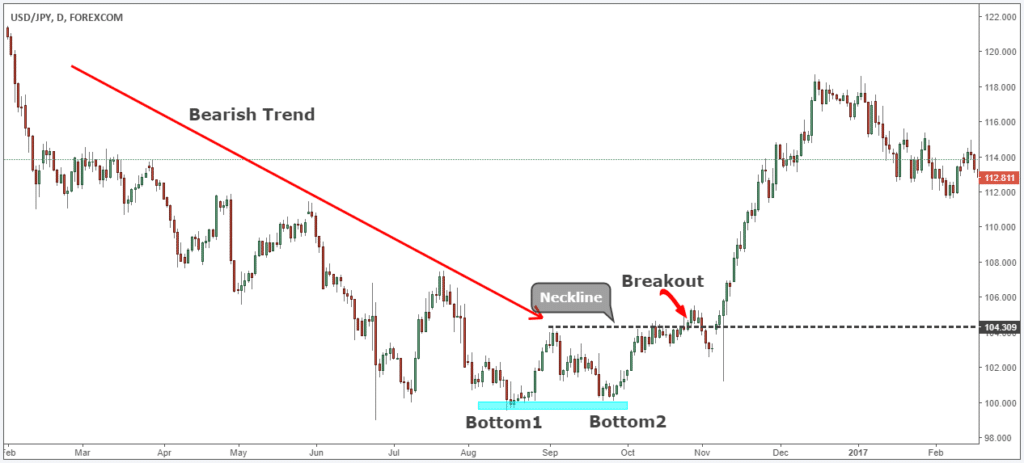
Now is the time to go through the Double Bottom Chart Pattern Strategy step-by-step guide.
Step #1: Identify the Phase of the Market. The Double-bottom Reversal Needs a Downtrend.
Just because you can spot the reversal doesn’t mean you have to jump in willy-nilly. Remember, we need the proper context, and everything needs to line up for a trade-able setup.
So, the first step is to identify the phase or market condition. At any given moment, the market can be trading up or down or go sideways.
As we previously established, the trade setup needs a prior downtrend.
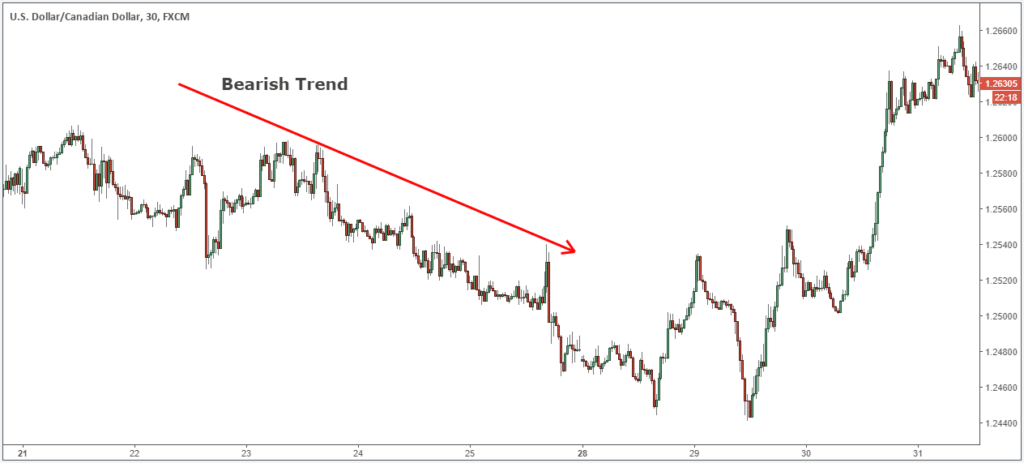
Establishing the market phase, a.k.a. identifying the trend, is probably the biggest ingredient in determining the success rate of double bottom pattern technical analysis.
Step #2: The Historical Precedent. An A++ Double Top Reversal Is Composed of Two Rounded Tops.
The second step of this strategy is to find what we call the historical precedent or a chart pattern.
We don’t want to make a trading decision without price confirmation, and in our case, we use the reversal pattern. You need to identify two rounded bottoms for the pattern to be considered tradeable.
What is a rounded bottom?
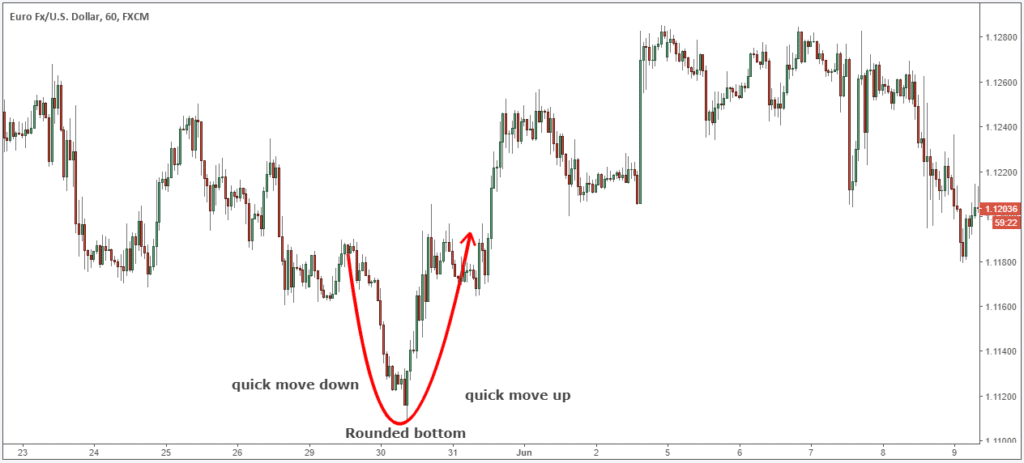
In technical analysis, a rounded bottom is simply a price formation that typically occurs after a downtrend; prices move downwards and then quickly rally, creating a rounded bottom.
Now, of course, depending on the structure, the rounded bottom will vary in size and magnitude. However, the idea is that we need a quick move down followed by a quick move up to define a rounded bottom.
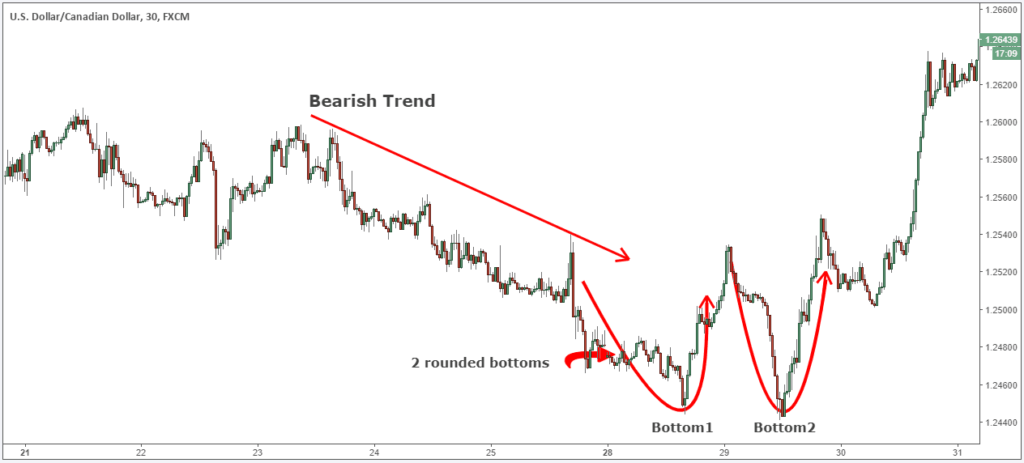
Note: A valid double top reversal has two rounded tops.
Let’s move forward to the third criteria of our chart pattern strategy.
Step #3: Allow a Maximum of 10 Pips Variation Between the Two Bottoms.
Don’t seek perfection because, in trading, you need to get rid of your idealistic mindset, as the pattern will not always look perfect, so be flexible.
This is the reason why we need to allow a maximum of 10 pips variation between the two bottoms.
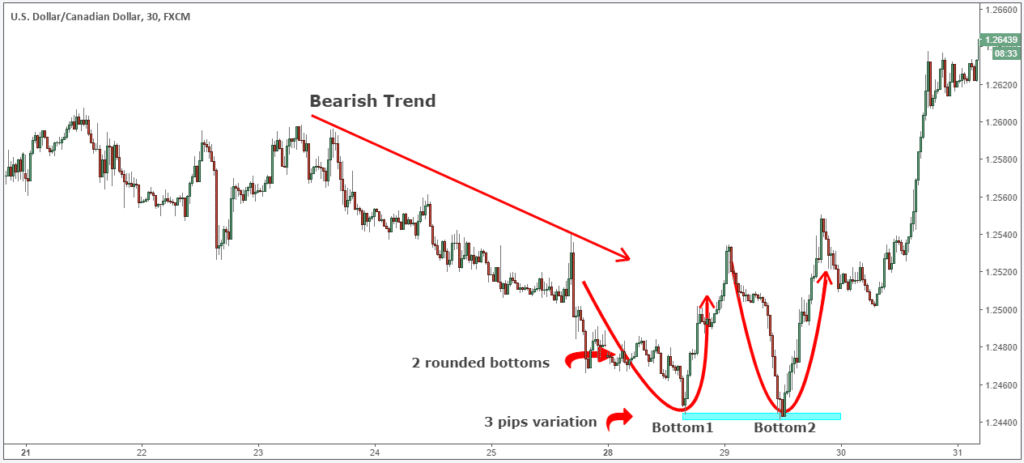
The probability of two bottoms happening at the same exact price level is almost impossible.
If you don’t have a good understanding of support and resistance and how to plot them, we’ve got your back. Feel free to check out our article covering that topic to learn more.
So far, so good.
Now, we have to determine an entry technique for our chart pattern strategy.
Step #4: Buy When the Double Bottom Breakout Candle Closes above the Neckline.
After we identify the phase of the market and the characteristics of a good reversal, we need to wait for confirmation that the momentum is shifting.
The breakout candle is our signal that the momentum has shifted, and it’s what confirms and validates the double-top pattern.
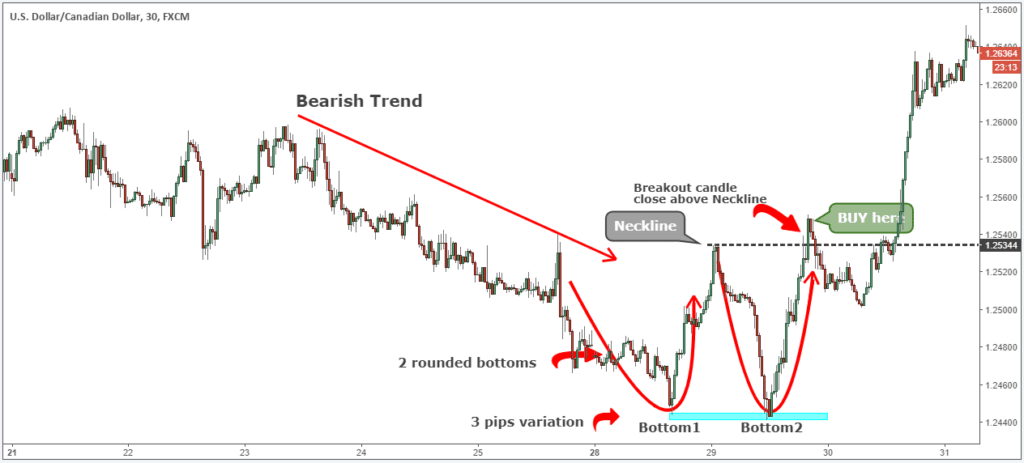
You’ll see the double bottom breakdown happen repeatedly, but it’s essential to analyze them within the context of the market trend.
The next logical thing we need to establish for the strategy is where to take profits.
Step #5: Take Profit at the Same Price Distance as Measured from the Highest Peak to the Neckline
The minimum profit target for this type of trade is approximately equal to the same price distance as measured from the double bottom to the neckline.
If we project the same price distance to the downside, we obtain our first take-profit zone for the strategy.
Moreover, the double bottom pattern can produce a significant reversal, so we advise you to be very flexible with your profit target and not to miss any big profit opportunity.
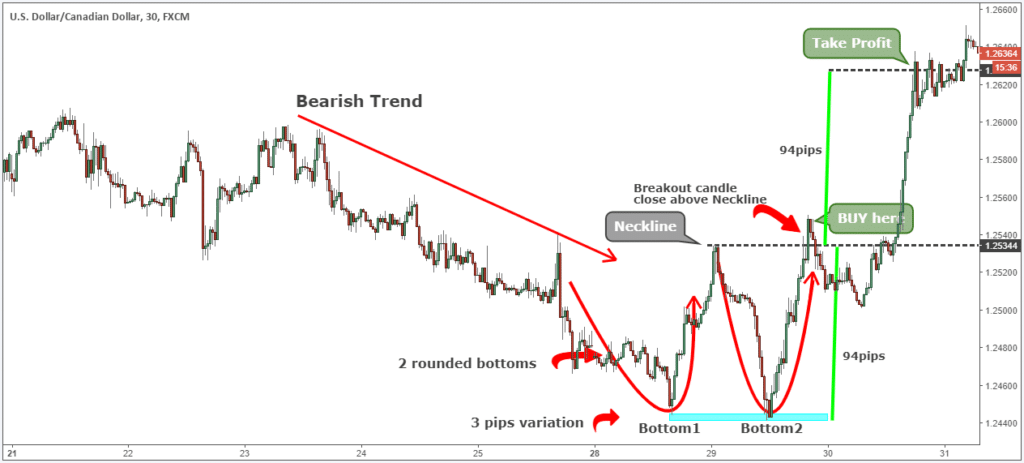
The next important thing we need to establish is where to place our protective stop loss.
Step #6: Place the Protective Stop-loss Slightly below the Support Created by the Double-bottom Reversal
The Double-Bottom Chart Pattern Strategy gives you a simple way to quantify risk because you can place your protective stop-loss slightly below the double bottom pattern.
The double bottom pattern also allows you to trade with a tight stop loss, which is great as we always want to keep losses at a minimum.
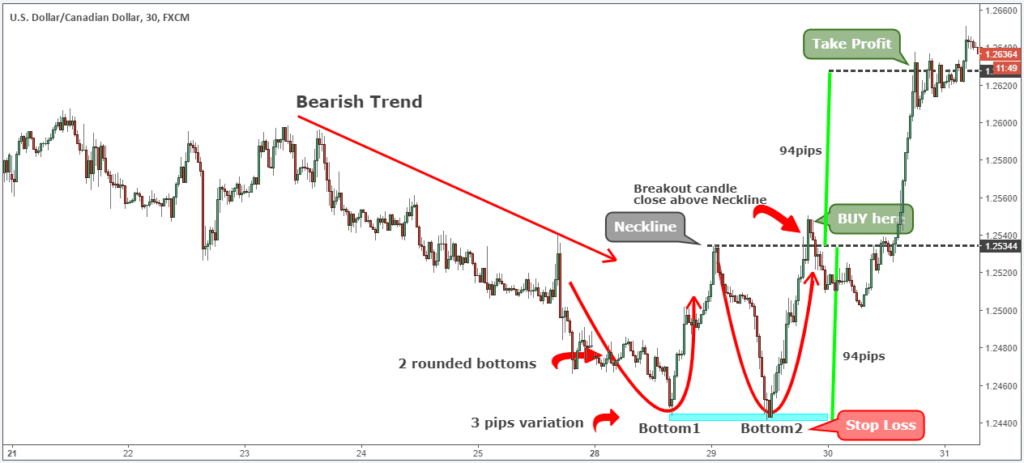
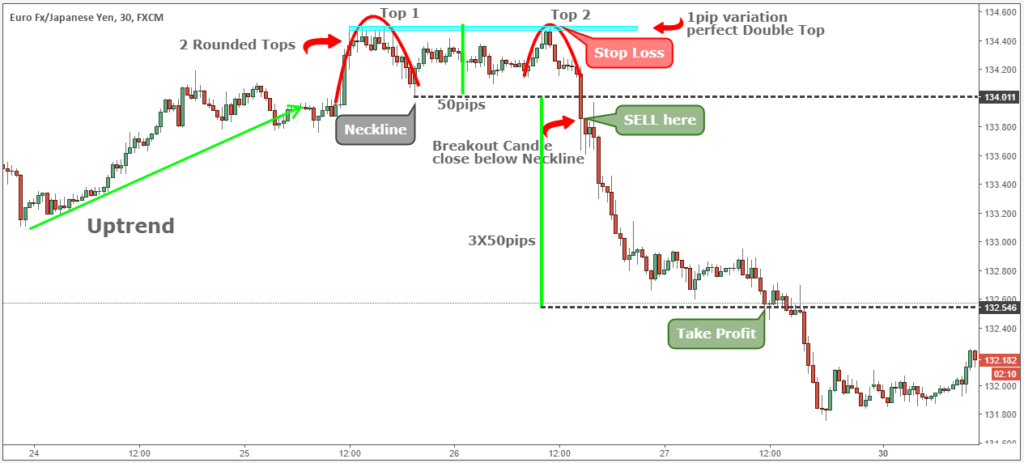
Note: The above was an example of a BUY trade. You can use the same rules, but in reverse, for a SELL trade. However, this time, we’re going to use the double-top pattern. In the figure below, you can see an actual SELL trade example using a top-bottom pattern.
Also, feel free to read our Triple Top Chart Pattern Strategy.
Conclusion: Double Bottom Trading
No chart pattern illustrates the trend reversal; however, despite the high success rate, you still need to use a protective stop loss and wait for the breakout when trading with the double-bottom chart pattern strategy. You can also trade with a breakout triangle strategy.
The bottom line is that you still need a plan to trade the double-bottom breakout successfully. Our Double Bottom Chart Pattern Strategy should answer all your questions regarding how to make money with this simple pattern.
TSG website is a 100% free service dedicated to smart traders. All we ask in return is that you please refer a friend to benefit from our amazing trading strategies collection.
Thank you for reading!
Be sure to read our more advanced Reversal Trading Strategy here.
Double Bottom Chart Pattern Strategy Video
Global Prop Trader
We have developed a prop trading firm that helps average traders become wealthy. With simple, easy to follow rules any trader can be ready to trade the $1 million account in no time.
Please leave a comment below if you have any questions about this strategy!
Double Bottom Chart Pattern Strategy PDF Download
Download the Double Bottom Chart Pattern PDF Guide to gain a comprehensive understanding of this powerful trading tool. This guide offers in-depth insights into market psychology, detailed steps for pattern identification, and strategies for effective trade execution.
Enhance your trading acumen by mastering the nuances of this pattern and learning to spot key indicators that signal a market shift. The guide is an essential resource for both novice and seasoned traders, providing valuable information to improve decision-making and risk management in trading scenarios.
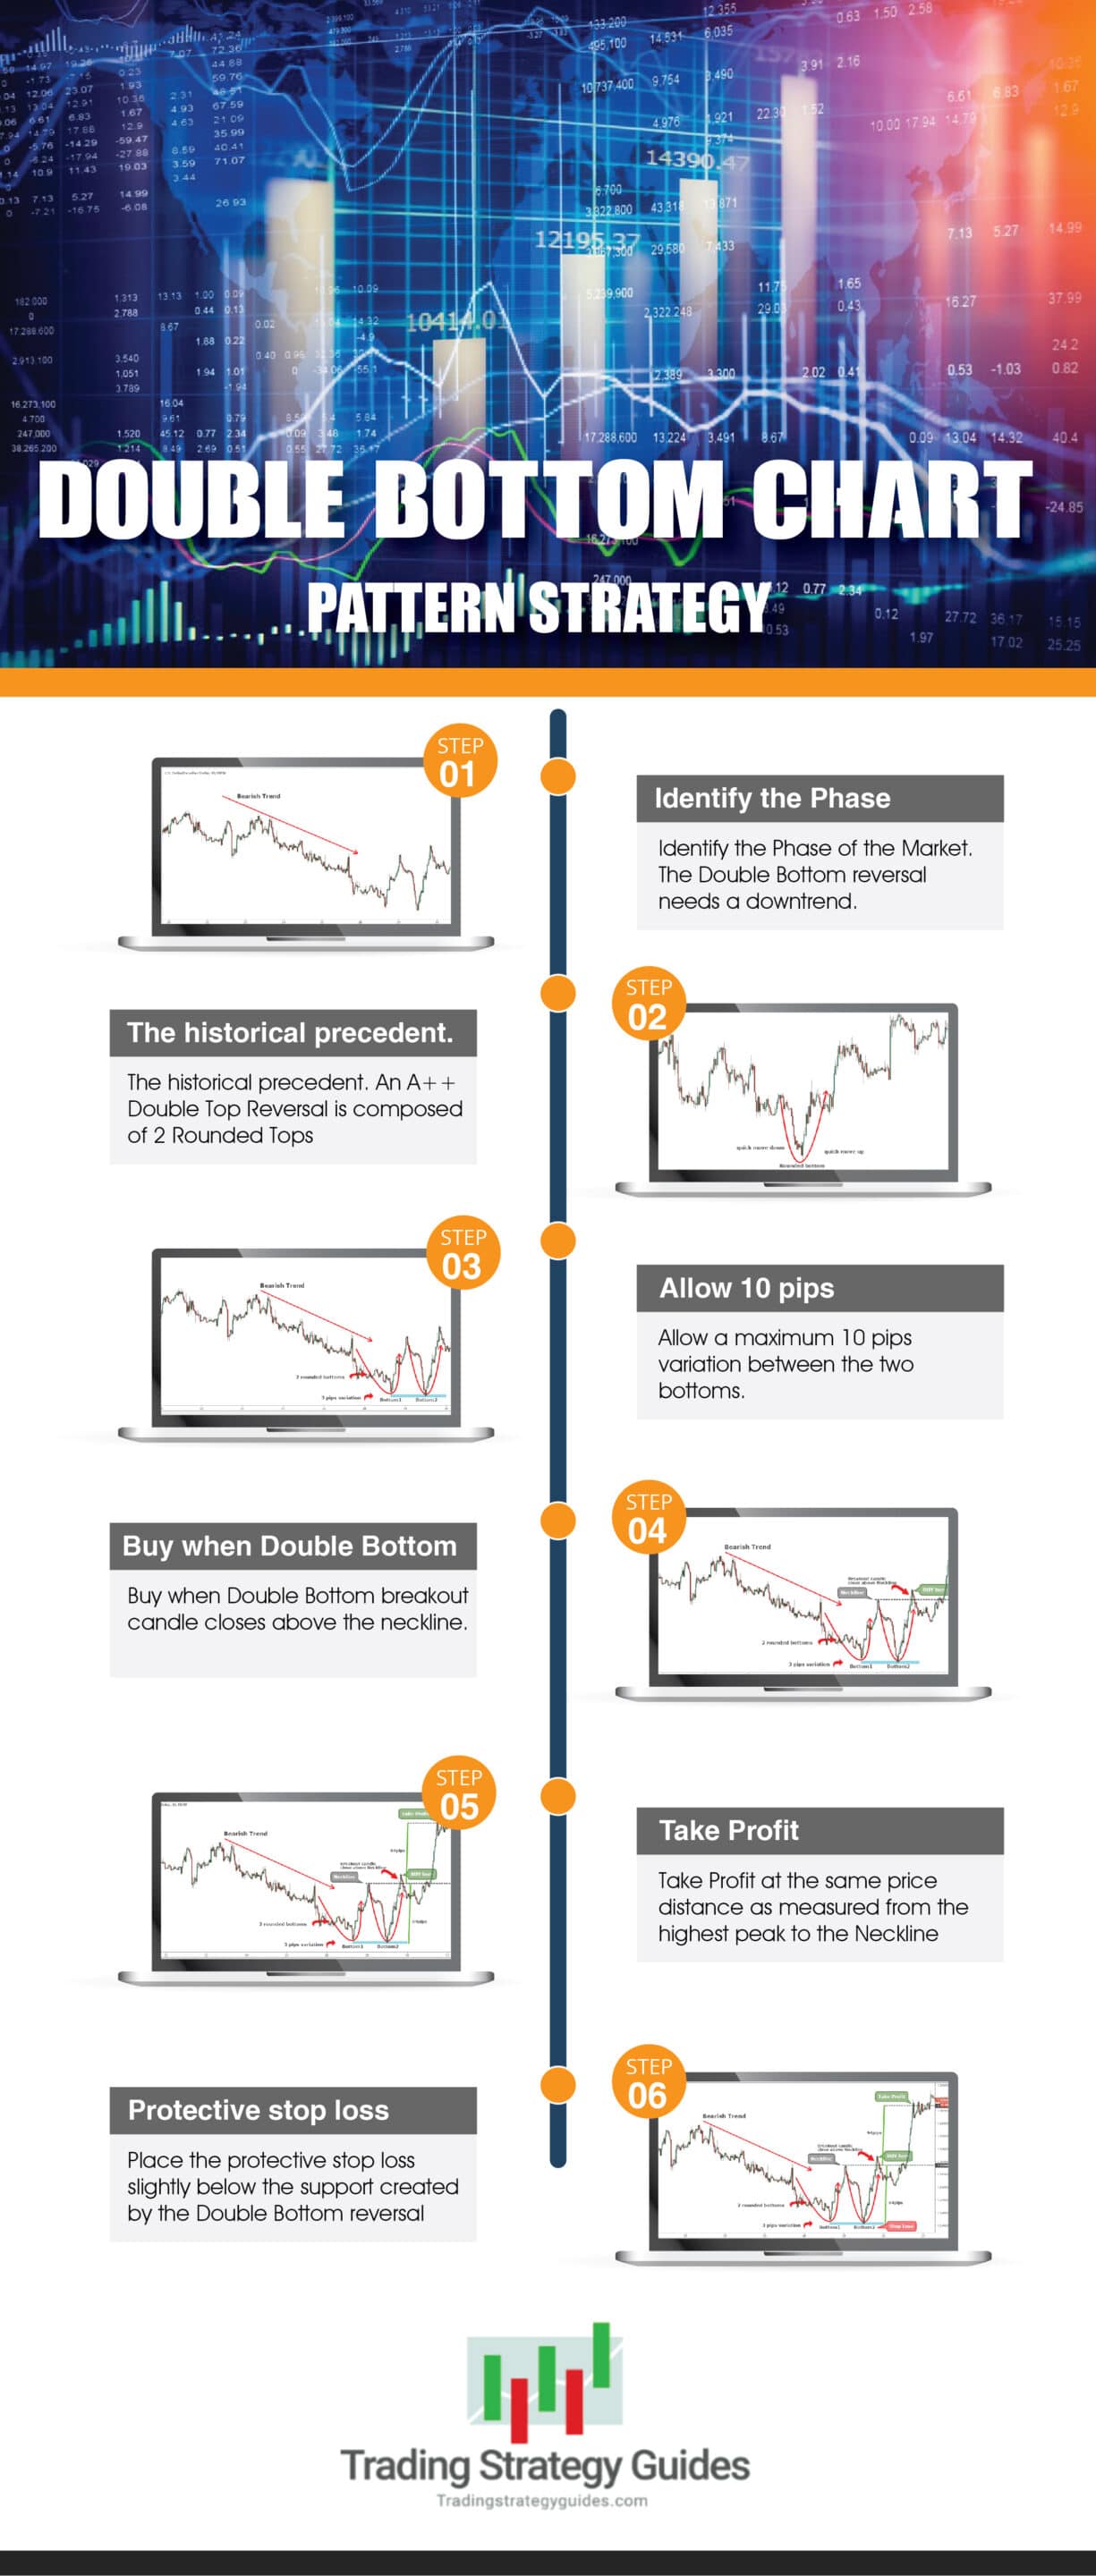
Double Bottom Chart Pattern Strategy Info-graphic Download
Please share this trading strategy below and keep it for your own personal use! Thanks, traders!




Thanks for all these info ,
Is there difference between a rounded bottom and regular movement of price in support area?
I haven’t checked in here for a while as I thought it was getting boring, but the last few posts are great quality so I guess I’ll add you back to my daily bloglist. You deserve it my friend 🙂