Mastering Technical Analysis Step by Step: 4 Powerful Tips You Need To Know

Every morning I scan the charts in search of opportunities for Technical analysis Step By Step in the Forex marketplace. I review various time frames and currency pairs and narrow down the list of potentially tradeable pairs for that day and week.
Typically, when these articles are written, you see the finalized version of the analysis and (potential) trade setups.
This article will be drastically different!
To show how to apply technical analysis step by step, we have taken a randomly chosen currency pair and shown you the process of analysis and not the outcome or end result. Therefore, it is not known if this pair will be interesting or have an actual setup now or soon (contrary to the usual post when the most interesting pairs are chosen).
Let’s Move on to Technical Analysis Step By Step
STEP 1 IDENTIFY THE TREND
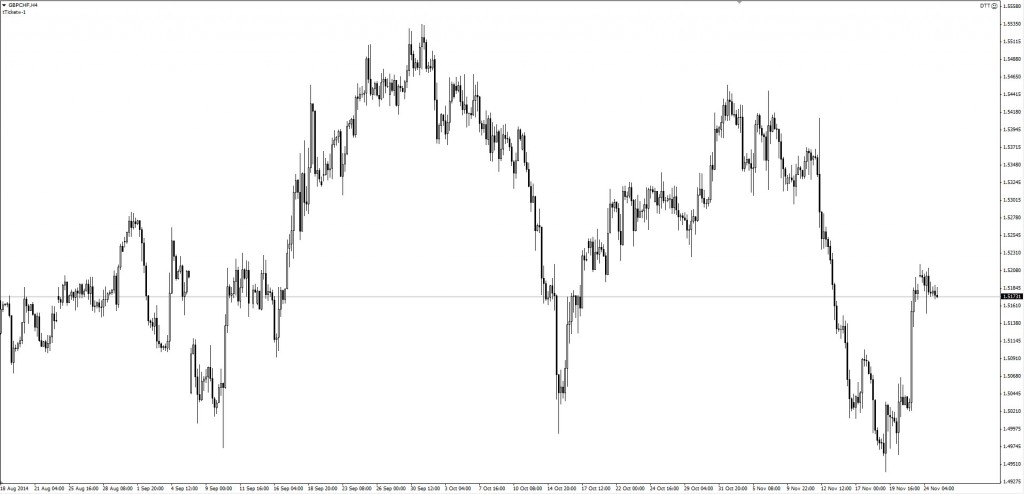
For this exercise, I will choose the GBPCHF currency pair. Let us start with a blank 4-hour chart and try to examine it.
What do you think?
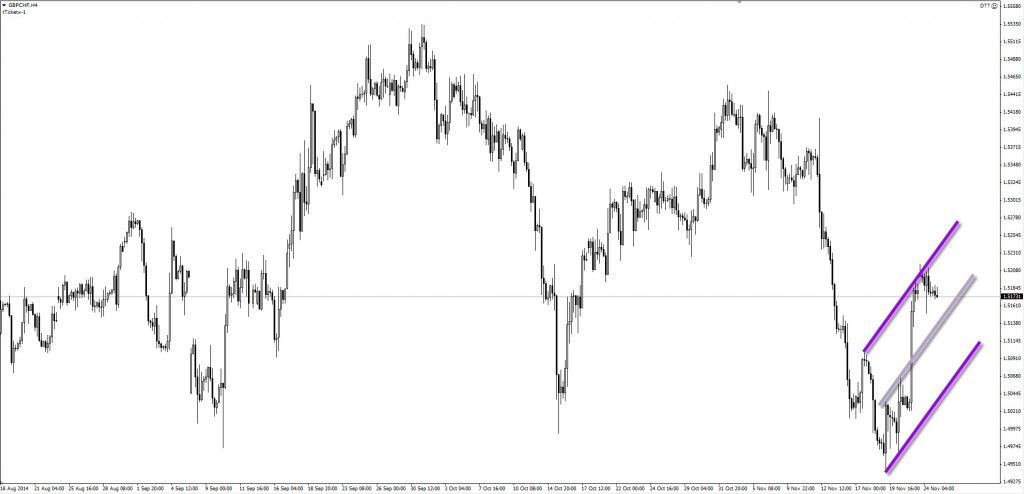
Overall price action looks pretty flat and sideways to me and there is no bigger trend driving this pair up or down. More recently I noticed a strong bearish impulse but a recent attempt to climb back up as price is making higher highs and higher lows, so let us add those lines.
The purple trend lines indicate the uptrend channel with 2 hits on the bottom, 2 hits on the middle line, and 2 hits on the top. The channel will become a confirmed uptrend channel when a 3rd hit is recorded on the bottom.
As long as the price stays within or above this channel the environment is bullish and as soon as price breaks out of it (below channel) then the environment is bearish.
STEP 2 MARK SUPPORT AND RESISTANCE
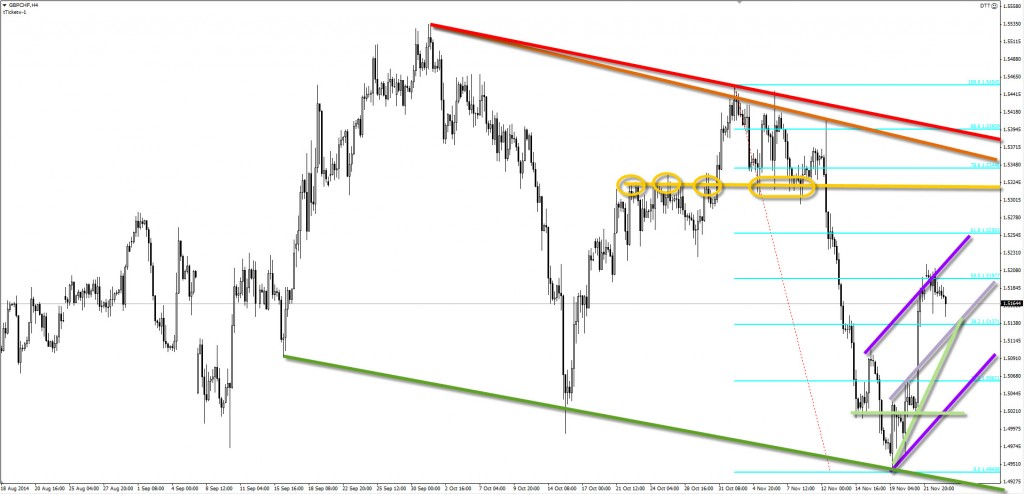
The next step is to review what major support and resistance levels stand in the way of the trend. By connecting the tops and bottoms I can quickly add very important trend lines. Also, including the Fibonacci retracement tool on the last bearish swing high and swing low potential support and resistance spots can be identified. These are levels that can be used as filters, bounce, and break spots.
STEP 3 SEARCH FOR PATTERNS
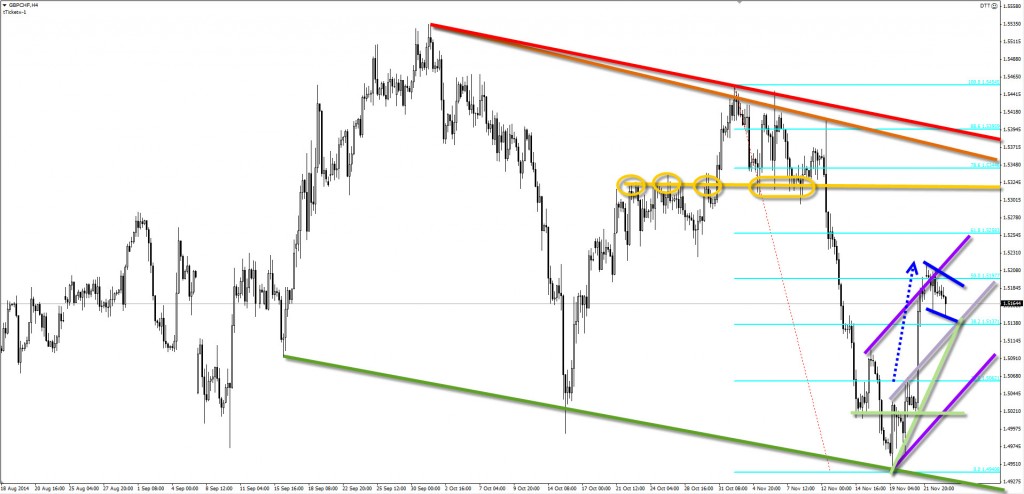
Patterns are not visible on this 4-hour chart. The green support and red resistance line could hint at a potential bull flag pattern on a higher time frame like the weekly chart. On the 4-hour chart, I see a strong impulse up (blue arrow) followed by slow price action back down (blue trend line) which could be a small bull flag. Of course, looking at other time frames for more candlestick patterns makes sense but for this example, I want to keep things simple and focus on a single time frame analysis.
STEP 4 SETUP WITH HIGH PROBABILITY
The total market structure of the GBPCHF 4-hour chart is not fantastic and I would not see high-probability trading setups. But a decent opportunity could be a long at the confluence of support in the middle of the trend channel, trend line support, bull flag bottom, and 38.2 Fib (magenta circle).
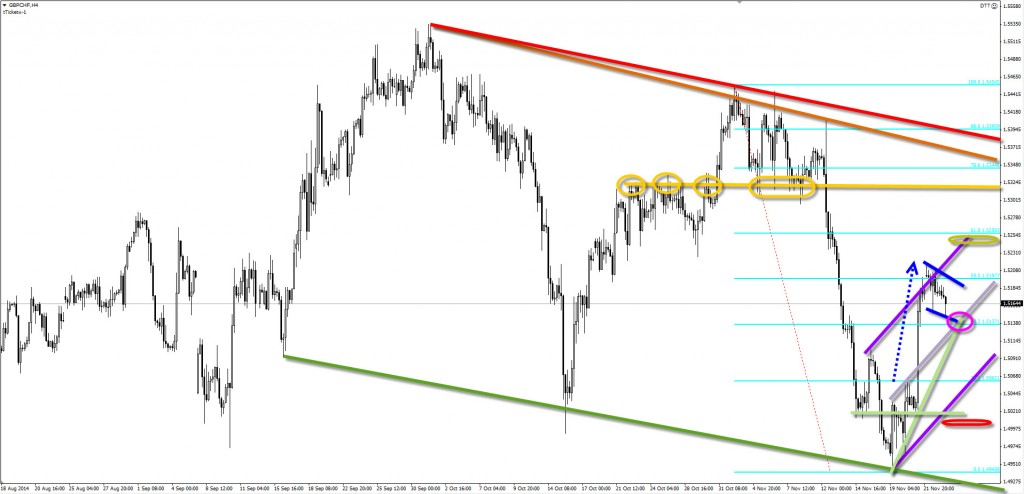
The specifics: long setup at +/-1.5137 with a stop loss below the bullish candle (red circle) at 1.5017 and a target at the 61.8 Fibonacci retracements at 1.5258 (green circle).
The risk and reward are both +/- 120 pips making it an even 1:1 reward-to-risk setup.
Conclusion — Technical Analysis Step By Step
Did you learn how to apply technical analysis step by step?
Does it help you see the technical analysis techniques instead of only the end analysis?
Are there any other technical analysis tools we could have used? Technical analysis indicators, perhaps?
Is there something that you would like to add to the analysis?
Let us know down below! Thank you for reading!
You may also be interested in our Technical Analysis Trading Strategies article.
Please leave a comment below if you have any questions on How to Apply Technical Analysis!




SL could be moved now to 1.5113, thereby reducing the risk by 80% of the original risk. This is an option but it is not a must if you prefer set and forget setups.
The target was nearly hit so just one more small push up and 120 pips are in the pocket!
Trade closes for a +120 pip win. If trail stop loss is used, then trade closed for break even or -20 pips.
I appreciate your piece of work, thankyou for all the interesting blog posts.