Candlestick Patterns Every Trader Should Know in 2024
When I first started trading, I stared at price charts filled with lines, shapes, and colors, feeling totally lost.
All those exotic candlestick patterns like dojis, hammers, and tweezer tops?
They might as well have been ancient hieroglyphics. My trades felt like rolls of the dice – completely random guesses but then I discovered the power of reading candlestick patterns.
It was like discovering a trader’s code that unlocked the secrets behind price movements. As I learned the most common candlestick patterns, it felt like suddenly being able to interpret signals from the market which helped me spot trend reversals, support and resistance levels, and momentum shifts faster than ever before.
For the first time, I traded with confidence.
If you want to take the guesswork out of trading in 2024, candlestick pattern recognition is an essential skill every trader should know. Trust me, I’ve been there, staring confused at the charts!
In this article, we’ll cover the most potent candlestick patterns you need in your trader toolbox, like the mighty Doji and the slippery Spinning Tops. I’ll share the patterns that can lead to explosive breakouts or warn you when a reversal is looming.

Thanks for visiting Trading Strategy Guides (TSG)!
You have discovered the most extensive library of trading content on the internet. Our aim is to provide the best educational content to traders of all stages.
Learn Our Trading Best Strategy By our Founder Casey Stubbs
In other words, we want to make YOU a consistent and profitable trader.
If you’re a brand new trader, we recommend hopping over to our ultimate beginner’s guide to trading to learn more.
Arm yourself with candlestick pattern knowledge, and you can trade through 2024 like a smart sniper – taking high-probability shots instead of blind guesses.
Ready to learn the codes that can unlock your trading potential?
Let’s get started!
Table of Contents
Intro: What Is a Candlestick Pattern?
Candlestick patterns fall under the umbrella of technical analysis – evaluating price action to predict future movements. Specifically, candlestick charts display the open, high, low, and closing (OHLC) prices for a trading period which could be a minute, hour, day, or week timeframe.
The candlestick body depicts the range between the open and close:
- A green (or white) candlestick indicates a bullish period closing higher than the open.
- A red (or black) candle is a bearish candle, closing lower than the open price.

Lines called “wicks” or “shadows” show the highs and lows and are positioned above and below the real body of the candle.
Analyzing these candle shapes allows traders to identify trading signals and trading opportunities.
Certain chart patterns tend to precede price reversals or trend continuations, especially when combined with other technical indicators like volume, oscillators, etc.
There are numerous candlestick patterns traders look for. Some predict trend reversals, like Doji or Shooting Star patterns while others signal potential breakouts and momentum, like the bullish engulfing. We’ll explore the most useful candlestick patterns to know before diving into analyzing price charts regularly.
Recognizing candlestick patterns takes some practice, but doing so can uncover the story behind price action – and lead to better trading outcomes. Once you learn to spot these powerful candle signals, you can trade the market’s momentum instead of trading blind.
How to identify candlestick Patterns
When searching for candlestick patterns, start by looking at key support and resistance levels on whatever time frame chart you’re analyzing because powerful reversals often occur at these price points as bulls and bears battle it out.
Then scan for familiar candlestick chart pattern shapes.
For example, do you see a tall upper shadow indicating sellers stepped in to push the price down?
That could be a Shooting Star reversal formation.
Or is there a long lower wick showing strong buying pressure?
That’s a sign of a Hammer pattern.
Also pay attention to the size of candlestick bodies and their shadows or wicks:
- Large candle bodies signal intense buying or selling momentum.
- But big shadows reveal that bulls or bears couldn’t sustain the price in their direction.
Combining these pattern clues, support/resistance context, and volume can confirm reliable candlestick signals. We’ll highlight the highest probability candlestick chart patterns so you can quickly recognize them.
Trading is part art, part science.
Learning to spot candlestick patterns is the analytical side but give yourself time to train your eye through practice. Soon you’ll be able to decode the market’s secret signals based on candle shape and size.
What are candlestick patterns telling us?
Candlestick patterns visually reveal the battle between buyers and sellers in a market. Their shapes portray whether supply or demand is winning out over a timeframe so reading them is like interpreting the body language of price action.
For example, long lower wicks show buyers swooped in to support the price when sellers tried driving it down which suggests bullish strength. But an upper wick illustrates the opposite – a bear victory stopping an upward move.
These clues allow traders to gauge sentiment momentum.
No other charting method conveys the tug-of-war between bulls and bears as eloquently as candlestick patterns. Once you learn their hidden language, you’ll be able to spot potential breakouts or reversals earlier. Candle-reading tips the odds in your favor instead of trading randomly.
How to trade candlestick patterns
Now that you know how to identify candlestick patterns and what they signify, let’s discuss high-probability techniques for actually trading them.
- First, stick to patterns with a proven statistical edge, like the ones we’ll review shortly because not all candle formations are created equal when it comes to reliability.
- Look for confirmation signals like above-average volume, supporting indicators (e.g. RSI divergences), or chart pattern breakouts. Combining technical factors leads to higher probability setups.
- Go through your trading checklist before entering positions.
- Set clear entry rules, stop losses, and profit targets for trades based on chart pattern breakout/breakdown points or recent support and resistance.
- Manage risk accordingly – no position should risk more than 1-2% of capital.
- Finally, timing matters when trading candlestick patterns so be patient for the optimum breakout entries or look for pullback opportunities after initial breakouts to benefit from momentum.
- And don’t get married to any position – if the price action doesn’t align with your thesis, don’t be afraid to exit early.
Follow these guidelines, and the candlestick patterns we explore next can significantly stack odds in your favor.
How many candlestick patterns are there?
I’m not going to lie – there seem to be endless candlestick pattern variations floating around the internet. Open any technical analysis book and you’ll likely find 50+ different formations with fancy names like Three White Soldiers or Counterattack Lines, which makes it easy to get overwhelmed as a beginner trader trying to memorize them all!
But here’s the good news: you only need to focus on understanding a select handful of the most reliable, highest-probability candlestick patterns. Mastering those will give you an incredible edge.
No need to cram your brain memorizing obscure formations you’ll rarely see.
In the next section, we’ll highlight the 10 classic candlestick patterns that offer traders the most potent buy and sell signals that will arm you to catch major breakouts and spot impending trend reversals early.
These are the heavy hitters you absolutely need to recognize with ease.
So while there may be hundreds of exotic candlestick pattern combinations in existence, stick with the basics first. Get these core formations imprinted on your brain and trading like a pro using daily and weekly charts. Once those become second nature, you can level up studying more advanced hybrid patterns if you want.
For now, let’s decode the simplest yet most powerful candle signals together step-by-step!
Money/Risk Management for candlestick patterns
Even armed with reliable candlestick patterns, poor risk and money management can have a massively negative impact on your trading account but the good news is following a few simple guidelines around entry, exit and position sizing can stack the odds further in your favor.
The 2% Rule
One of the key risk management strategies is known as the “2% rule” which says that no single trade should risk more than 2% of your total account capital which helps avoid blowing up your account on a few bad trades.
So if you have a $10,000 account, your maximum loss per trade should be $200 or less.
Use Stop Loss
For entering candlestick pattern trades, always wait for confirmation signals like the breakout point or volume spike before buying and selling and use stop losses religiously on every trade – losses must be cut quickly before they balloon out of control.
Trailing stops should also be considered to protect profits too.
In terms of money management trading strategies, properly size positions using fixed fractional position sizing based on your 2% risk maximum and the upside/downside price targets. This helps mathematically dial in how many contracts, Forex lots or shares to buy/sell while optimizing reward potential versus total risk taken.
Follow these guidelines, and you can trade candlestick signals with confidence knowing one losing trade won’t devastate you then the probabilities play out in your favor over time compounding winners!
Bullish Candlestick Patterns
Bullish candlestick patterns, in particular, indicate that upward momentum and prices are likely to continue rising and they can indicate good buying opportunities, especially after a downtrend or period of consolidation. But there are a few major types of bullish candlestick formations that serve as reliable indicators for traders.
Our favorite bullish patterns that have a high probability of success include:
- Bullish engulfing pattern
- Morning star
- Long-legged Doji
- Hammer chart pattern
- Bullish Marubozu
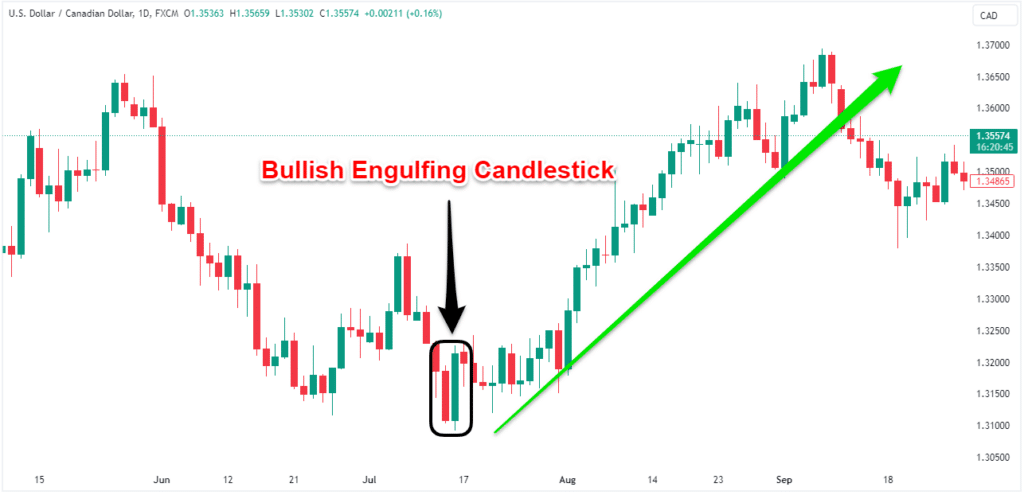
Bullish Engulfing Pattern
- This reversal pattern forms when a green (or white) candle comes after a large red (or black) candle, engulfing the body of the preceding candle
- This shows buyers have overwhelmed sellers, driving prices higher again in tug-of-war
- Signals potential bottom and upward reversal
- More significant after downtrends or selloffs
- Looks like large “V” bottom reversal shape
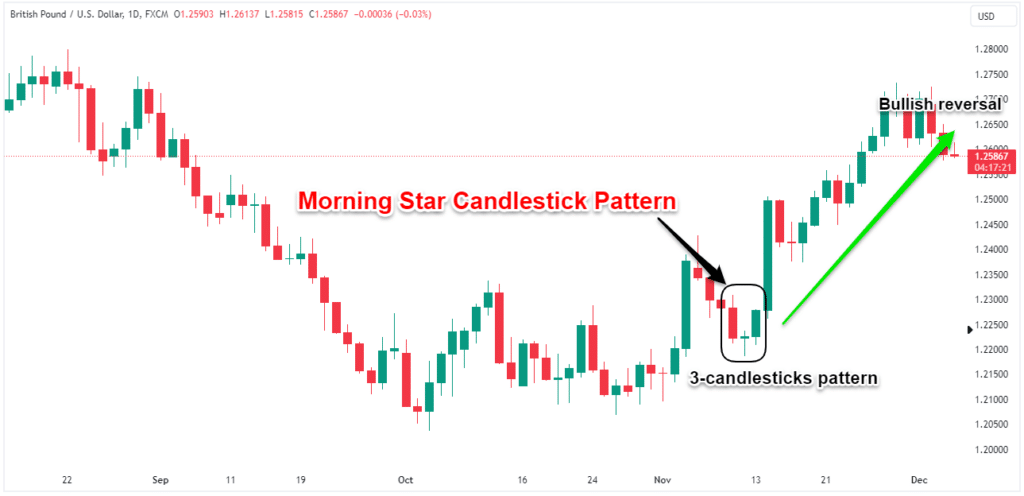
The Morning Star
- A three-candle formation signaling a potential turnaround
- It begins with a long red candle extending the decline, followed by a narrow range candle or a small-bodied star candle, and completes with a large green candle moving sharply higher
- Star candle shows indecision and it appears after strong downtrend and shows a transition from selling pressure to buying momentum
- Next long green candle confirms new upside momentum
- Powerful three candle reversal formation
- Signals potential bottom and trend change
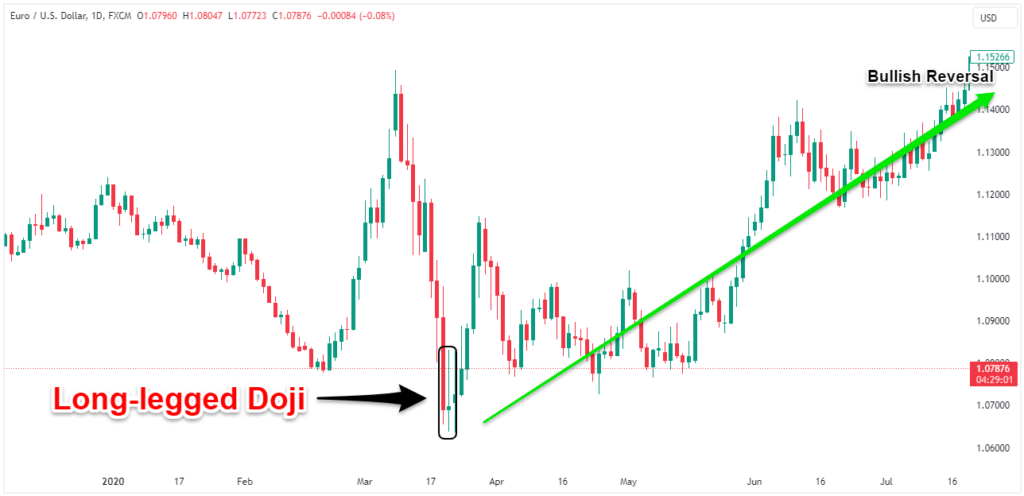
Long-legged Doji
- The candle has a small real body with very long upper/lower wicks
- Its key feature is exceptionally long upper and lower shadows, showing both intense buying and selling
- The narrow body closing virtually even shows balance and impending direction change higher again
- Typically, after an uptrend, a long-legged doji candlestick signals a potential bullish reversal with indecision preceding more upside
- Indicates a struggle for control and possible reversal
- More significant near support/resistance levels
Hammers
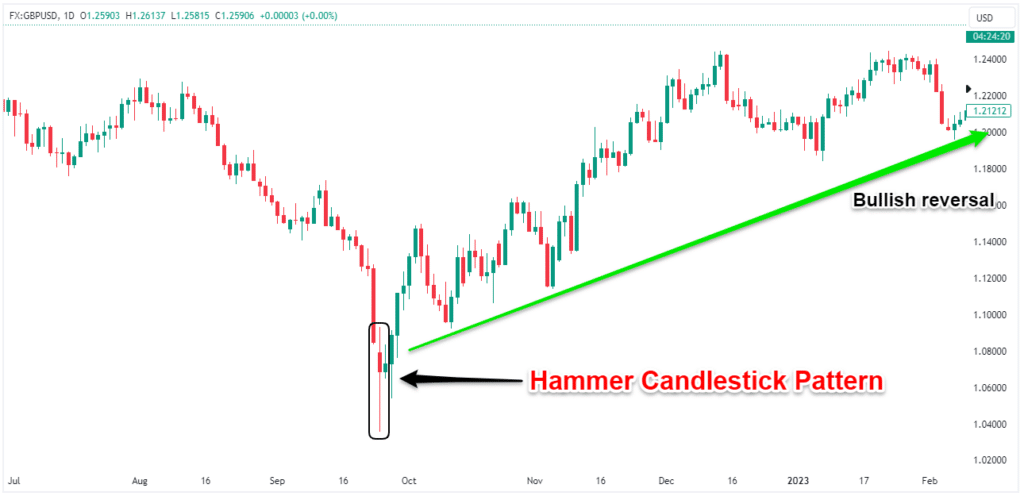
- After a decline, hammer candlestick patterns form when prices open and trade significantly lower, but then close near the top of the candle body
- Small real body near top with long lower wick
- The long lower wicks indicate buyers stepped in intraday
- Signifies sellers pushed price lower but buyers prevailed
- Indicates possible exhaustion of downtrend
- Reversal pattern forecasting upside continuation
- More reliable after prolonged selloffs
Bullish Marubozu
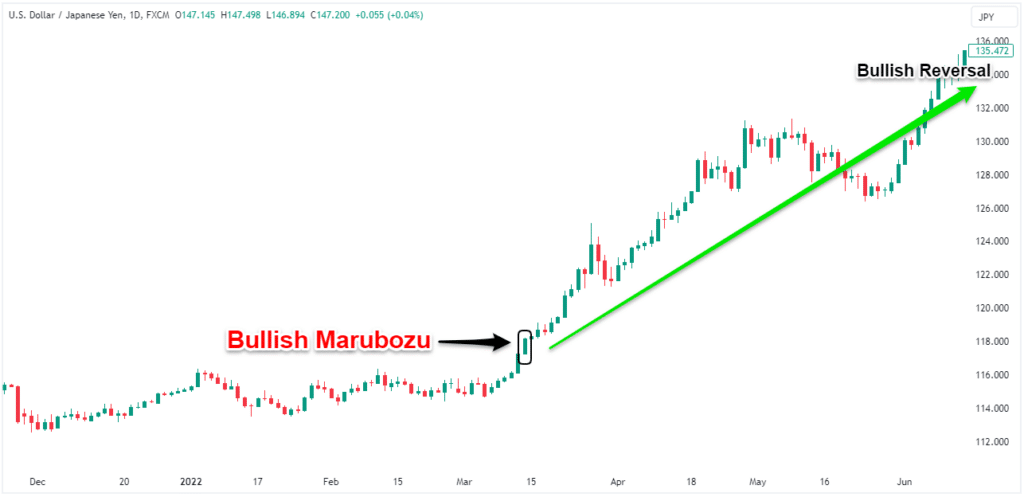
- Long white/green candle with no wicks or shadows
- This powerful candle shows unrelenting buying pressure all session long.
- Signifies strong upside momentum in place
- Continuation pattern rather than reversal
- Bullish Marubozus chart pattern opens at the low of the day and continue rising to close at the high
Bearish Candlestick Patterns
When it comes to trading financial markets (Forex, stocks, cryptocurrencies, options, etc.), learning how to spot impending danger is just as important as finding signs of strength.
That’s where bearish candlestick patterns come in.
These chart formations should set off alarm bells, signaling a downturn may be ahead.
When analyzing Forex charts, bearish candlestick patterns signal sellers are gaining control and applying downside pressure in the market.
Our favorite bearish patterns that have a high probability of success include:
- Bearish engulfing pattern
- Evening star
- Hanging man
- Shooting star
Bearish Engulfing Pattern
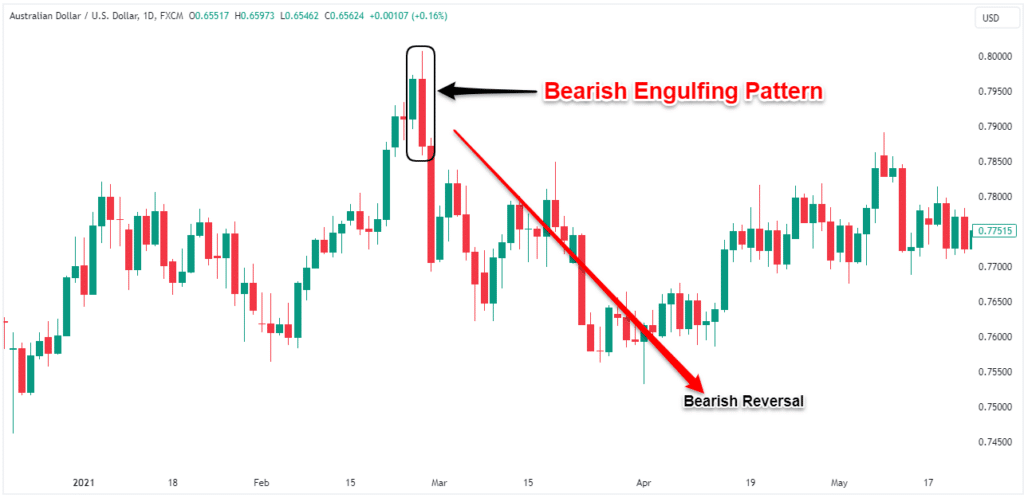
- The bearish engulfing pattern forms when a long red candlestick fully engulfs or covers the body of the preceding candle which was a smaller green candle
- This demonstrates a forceful shift to selling pressure as bears overwhelm the buying of the previous session.
- Signals potential trend reversal downward
- More significant after uptrends or rallies
- Shaped like large inverse “V” top reversal
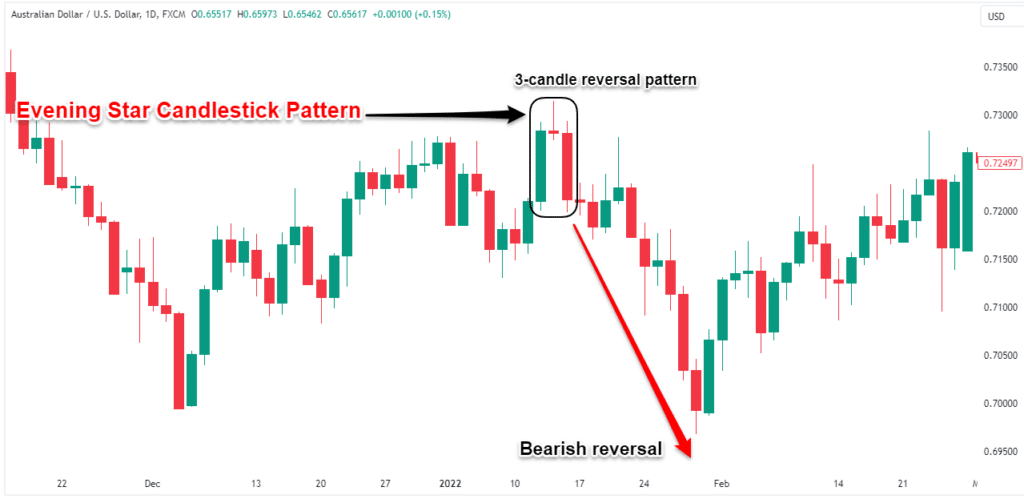
Evening Star
- A three-candle reversal pattern signaling a bearish turn in the market
- After an advance up, the first candle has a large white body, followed by a narrow range “star” candle, completed by a large red candle moving sharply lower
- Next long red candle confirms selling momentum
- This shows a shift of control from buyers to sellers
- Indicates likely trend change downward
Hanging Man
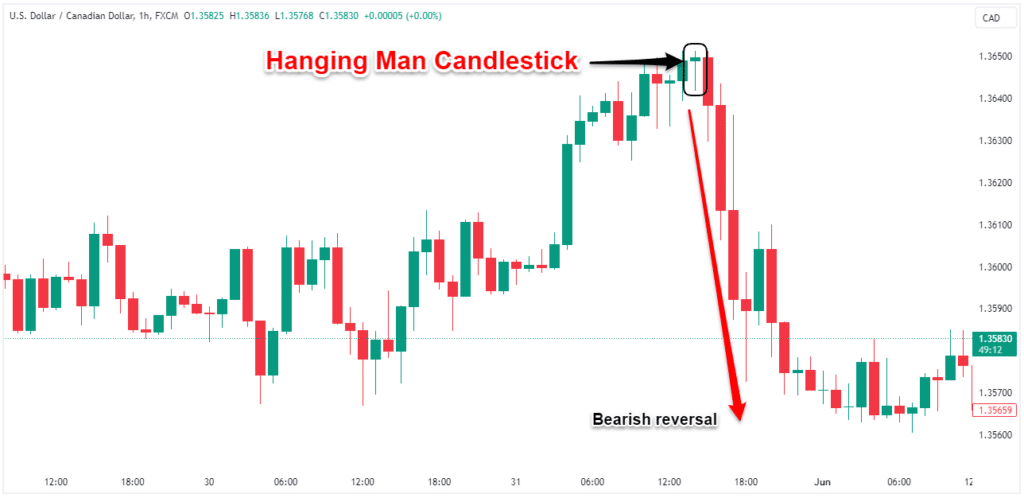
- Hanging man candlestick pattern emerges after an upward trend in prices and it signals potential topping behavior
- In an uptrend, the hanging man will form consisting of just a single candle
- It has a small real body at or near the top of the trading range, with a long lower shadow or “wick”
- This shows buyers pushed prices notably higher during the session, but sellers stepped in to reverse most of the intraday gains by the finish
- The long tail on the hanging man reflects that sellers drove prices forcefully lower at some point, before buyers re-emerged to close the candle near breakeven from the open.
Shooting Star
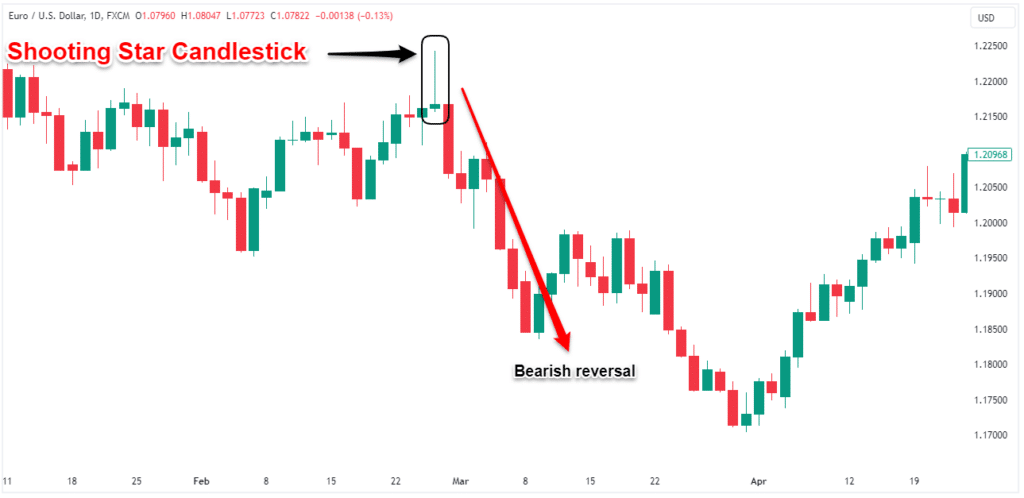
- The shooting star candle appears after an advance as a potential last gasp top, signaling bullish momentum may be exhausted
- Small body near the bottom of the range with long upper shadow
- The long upper shadow looks like a star shooting up before reversing the advance which warns buyers are losing control
- Sellers rejected further gains pushing price lower
- Indicates upside momentum stalling out
- Likely reversal pattern if confirmed by the next candle breakout
Candlestick Patterns YouTube
Here is a complete candlestick pattern video that I have done on YouTube to help you understand in even greater detail.
Best Stock Candlestick patterns
With tons of different stock candlestick formations out there, how do you know which ones to look for?
The stock patterns we’ll highlight here are total rock stars – the best of the best. I’ll walk you through what makes each one so powerful along with clear visuals so you can instantly recognize them.
Sounds good?
Let’s get to it!
But first you need to forget everything you think you know about stock candlestick patterns.
If you want to master bullish and bearish stock candlesticks, you need to focus on those chart formations that rarely make the textbooks but can still bring shockwaves to stock trading.
Curious what crazy trading candlesticks I’m talking about?
Read on!
Counterattack Line
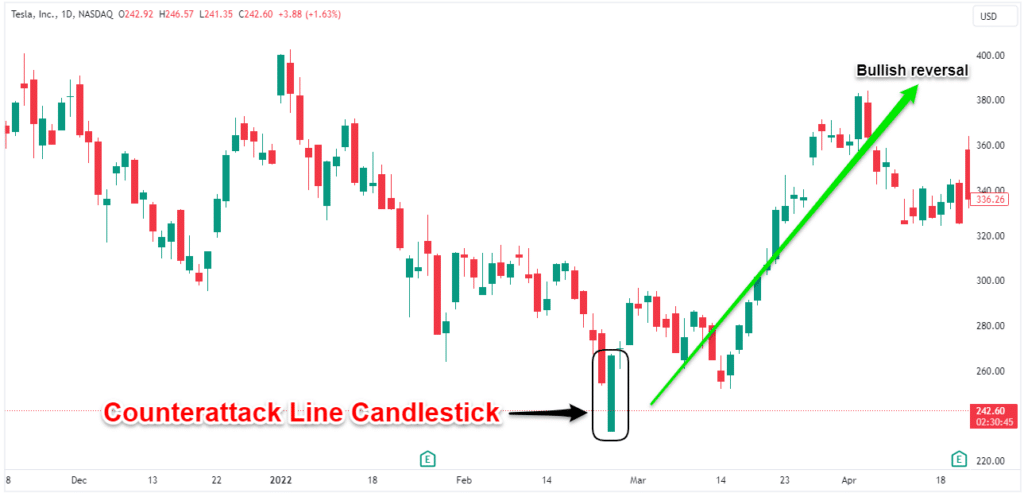
First up is the counterattack stock price formation.
Sounds intense, right?
And it is!
This wild stock chart trading pattern takes shape when prices sink or gaps far lower than expected intraday before a swarm of buyers step in to drive an explosive reversal back up. The closing price is usually near or slightly higher than the previous candle.
Not for the faint of heart stock traders!
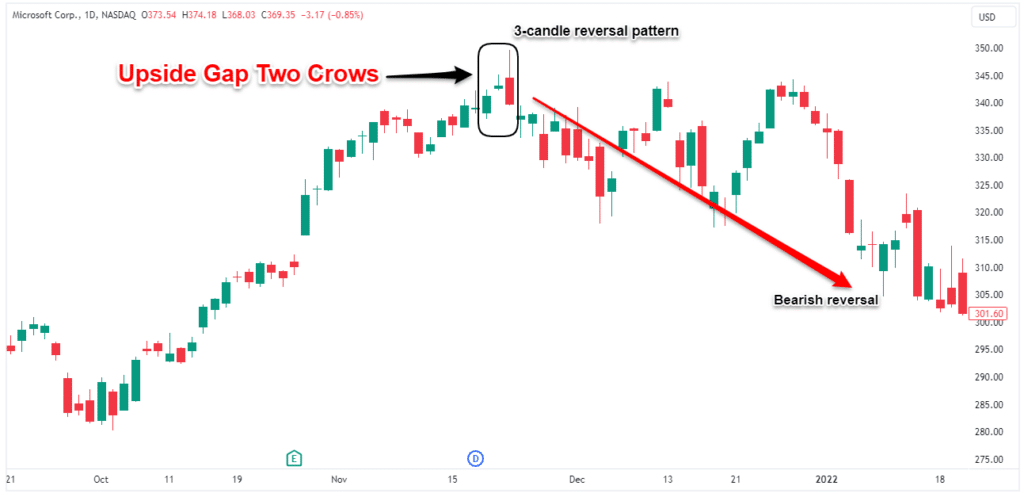
Upside Gap Two Crows
Next bizarre formation is the upside gap two crows pattern.
Yeah, crows aren’t usually a positive sign, but the bullish nature of this pattern means being visited by a couple black birds could translate to serious profits!
Specifically, here is what the formation looks like:
We see a long white (or green) candle first that shows stock prices rocketing upward with a lot of buying momentum. The next candle gaps up strongly at the open but the selling pressure then sends the price down, resulting in a black or a bearish candle by the close.
The next candle also gaps up on the open but again, aggressive selling grabs hold to push the stock price all the way down, resulting in a second black or bearish candle. The two black crows show the tide turning, with sellers overwhelming the buyers.
Three Black Crows and Three White Soldiers Chart Patterns
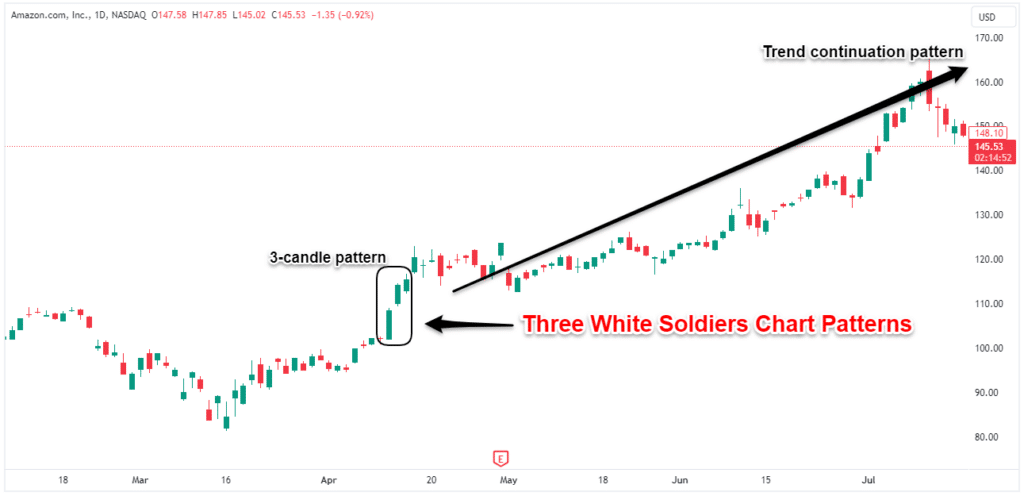
We also have the identical three black crows formation to keep an eye out for.
Three consecutive bearish candles that look almost exactly the same with each successive closing price being near the top of the daily price range.
This rare appearance marks a potential stopping point after a solid uptrend.
The opposite of the three black crows chart pattern is the three white soldiers which obviously signals a bullish reversal pattern.
Abandoned Baby
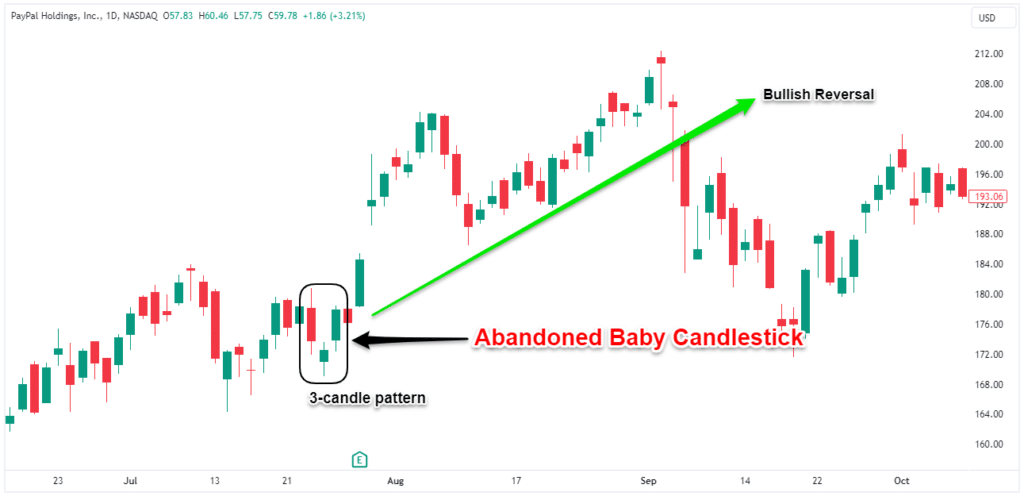
And finally, there’s the abandoned baby chart pattern.
Not as cute as it sounds!
This 3-candle turnaround shows up after a big move up or down. It contains a doji middle candle representing a standstill – like traders have “abandoned” directional bias. On the right and on the left of the doji middle candle there are price gaps as the second candle gaps below the first candle and the third candle opens higher than the doji candle.
This uneasy truce leads into an explosive reversal the other way!
Crypto Candlestick patterns
Forget stocks – if you really want candlestick patterns that pack a punch, cryptocurrency market is where it’s at! Wild price swings means these iconic crypto chart formations show up strong, telegraphing when it’s time to grab profits or run for cover.
Let me highlight 2 must-know candlestick markers for dominating crypto trades:
- Falling three methods
- Abandoned baby
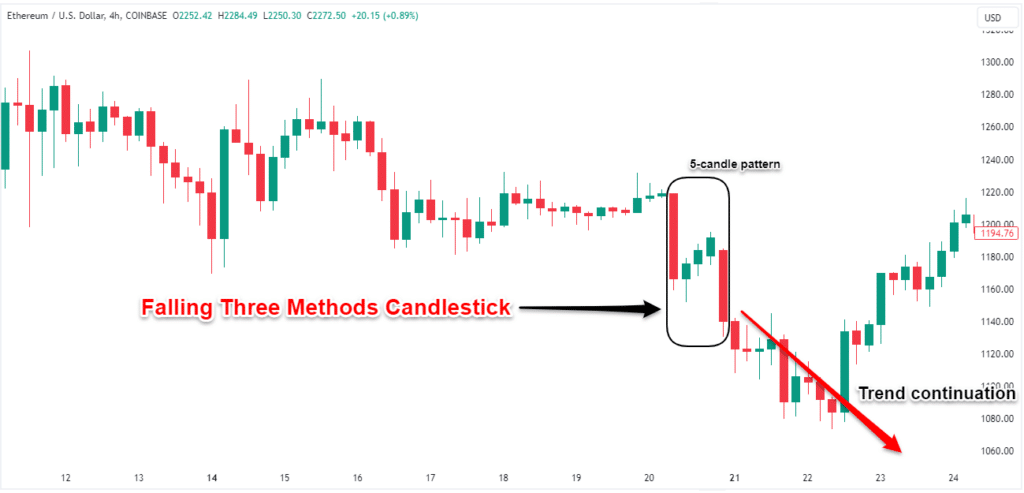
Falling Three Methods
Even more dangerous is the Falling three methods formation which involves 3 consecutive shorter bullish candles, each closing near their highs that are sandwiched between two long bearish candlesticks.
New crypto investors often ask when to take profits during volatile runs. Well, these bear signals ring the alarm. Whether trading Bitcoin, Ethereum, or small cap gems – when sellers dominate for days on end, the party is likely not over.
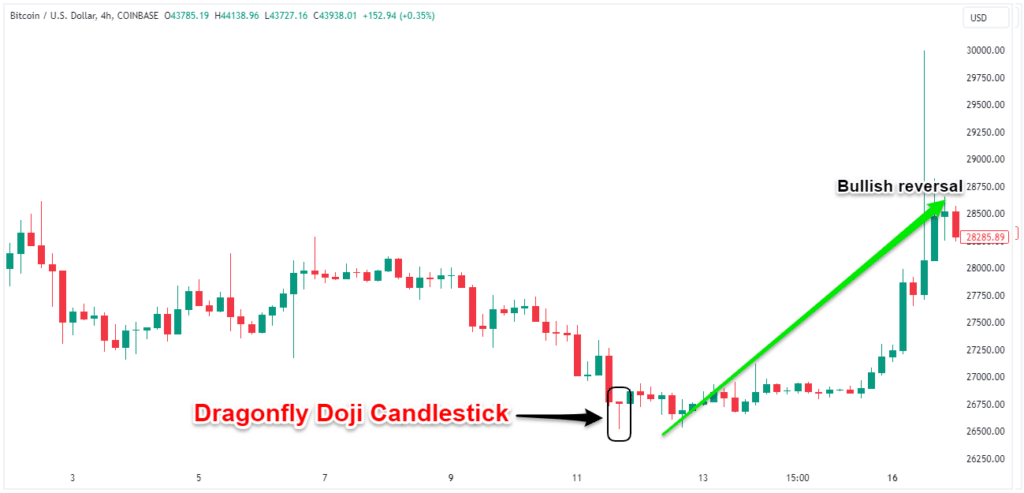
Dragonfly Doji
And finally, we have the dragonfly Doji stock chart pattern.
This freaky fly-looking crypto candlestick forms when prices zoom up and down within the candle’s range before closing back near the open.
Its unique shape at turning points screams “pay attention!”
Options candlestick patterns
Alright, let’s shift gears and tackle candlestick patterns specifically for options traders. I hear you – who has time to pore over endless chart formations? Let’s keep this short and sweet, focusing on just 3 key candlesticks that can guide smart options plays.
Looking to gain an edge timing entries and exits on options contracts you’re trading?
Are you searching for signals to capture quick profits or avoid nasty reversals?
Then this intel is for you!
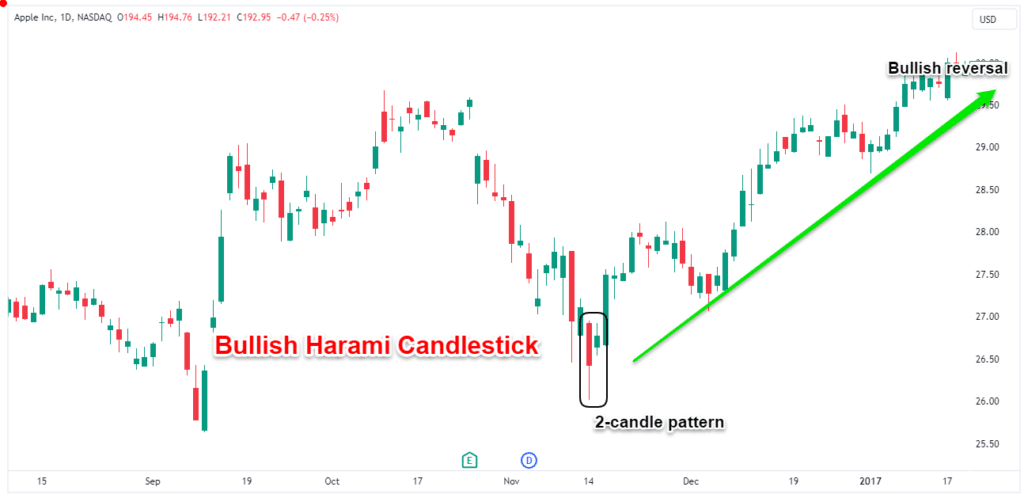
Bullish and Bearish Harami
First up is the bullish Harami candlestick pattern. After a downtrend, this 2-candle pattern forms with a long red candle followed by a small green one nestled entirely within the red’s range because the second candlestick gaps higher. This baby candle cradled inside signals the selling pressure is losing steam!
- When you spot a Bullish Harami, quickly buy out-of-the-money call options to profit from the impending upside.
- Conversely, the Bearish Harami appears after uptrends, with a small red candle nestled inside the prior long green candle’s range.
Dark Cloud Cover
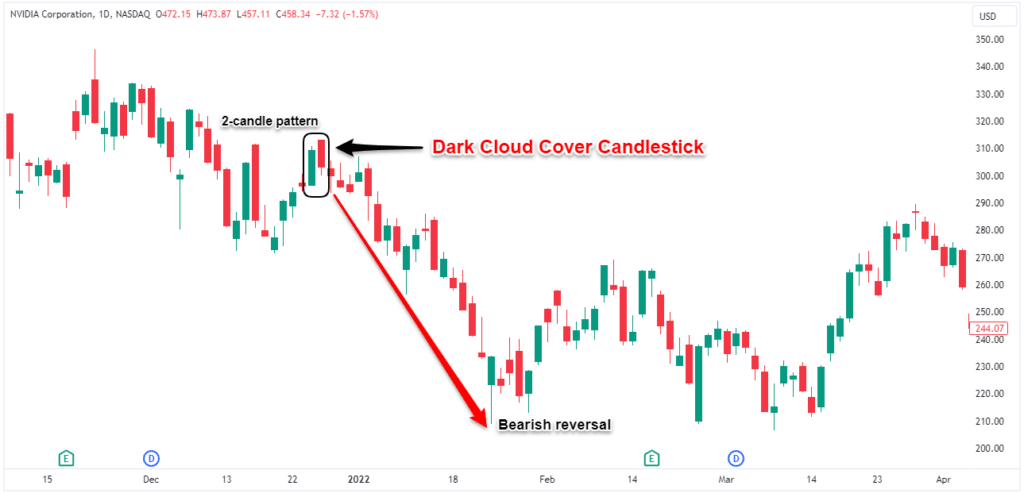
First is the Dark cloud cover candlestick pattern. After a rally up, this reversal pattern forms with a long green day followed by a red candle that gaps up and closes below the midpoint of the green candle.
A dark storm cloud snuffing out the bullish outlook making it a perfect chance for bearish put options to capture the turn!
The Piercing Pattern
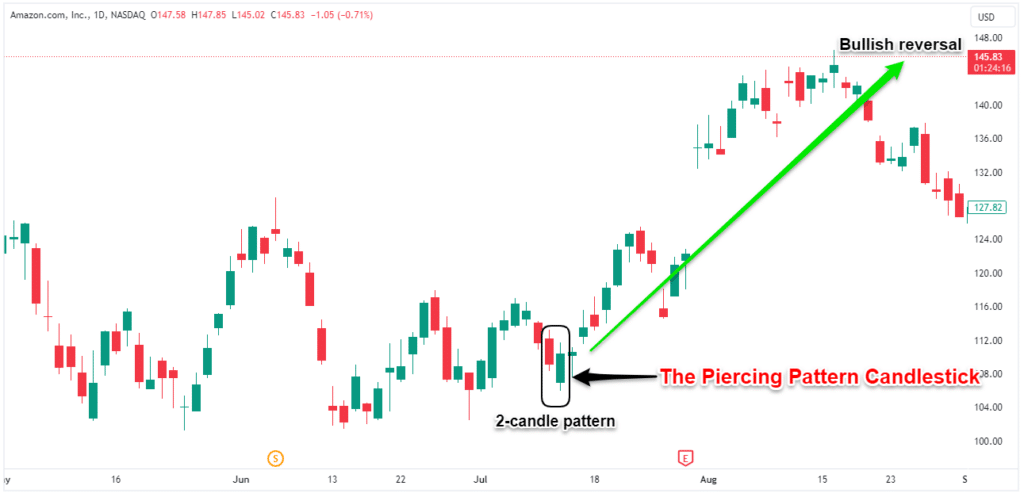
Similar to the engulfing pattern, the piercing pattern also indicates a potential reversal upward after a decline. It features a long red candle followed by a tall green candle that opens lower but rallies to close over halfway into the red candle’s body.
The deeper the pierce into the prior bearish candle, the more bullish the signal is which is a perfect time to buy some stock call options.
Swing Trading Candlestick Patterns
Looking for an edge to ignite your swing trading?
Candlestick patterns are the keys to spotting short-term moves before they happen. Forget lagging indicators – these visual formations flash RIGHT on the chart immediately when supply and demand shifts.
Many swing trading candlestick patterns exist, but a few absolute powerhouses tend to precede the most explosive swing trades. Here are the 3 best candlesticks for swing traders to spot entries and exits ahead of the herd:
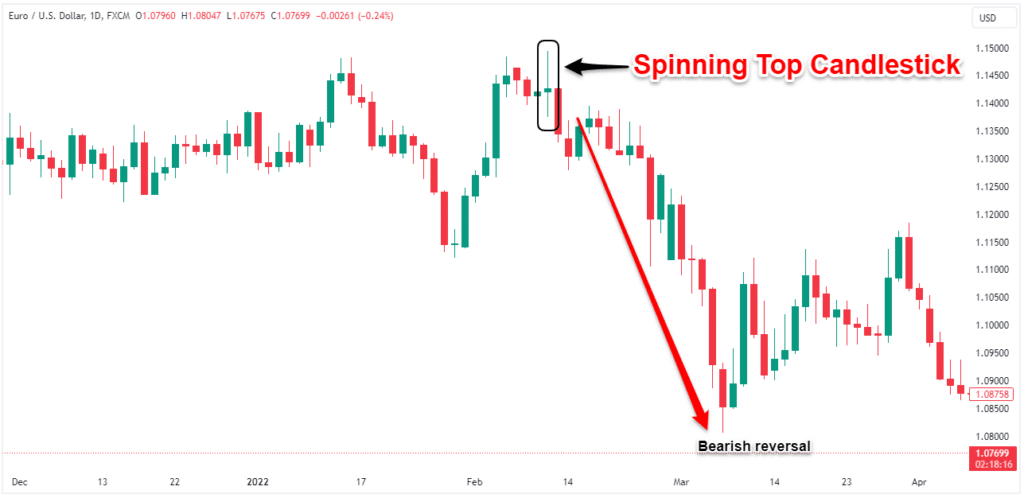
Spinning Top
First watch for the Spinning Top candlestick pattern. This wild candle has a tiny body with sizable wicks above and below, making it look like a spinning top. It shows utter indecision between buyers and sellers at possible turning points!
Bullish and Bearish Kickers
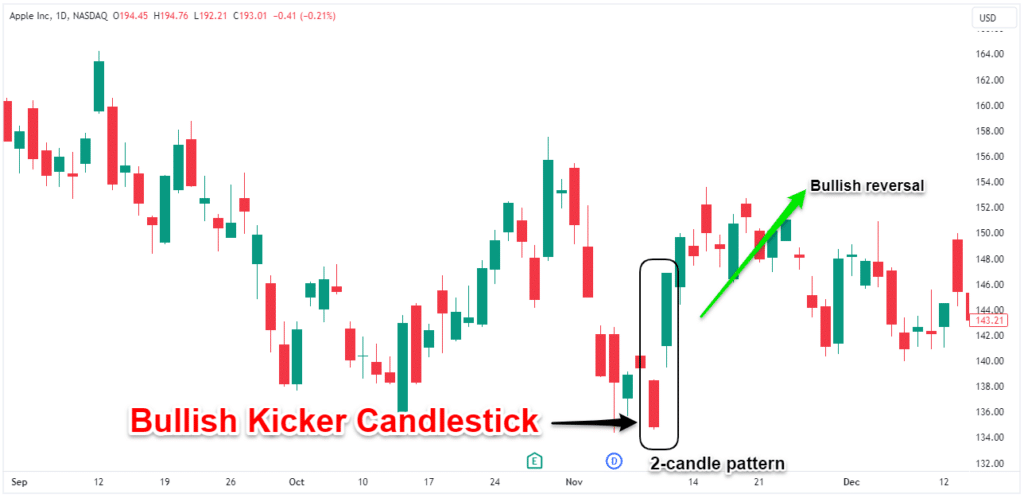
Bullish Kickers form after declines with a red candle followed by a green real body candle that “kicks” out below the red candle’s low. It’s similar to a hammer and signals a likely swing low. Go long!
Bearish Kickers are the opposite, with the second black real body candle “kicking” the low of the previous white candle after a rise. Short time!
Tweezer Top and Bottom
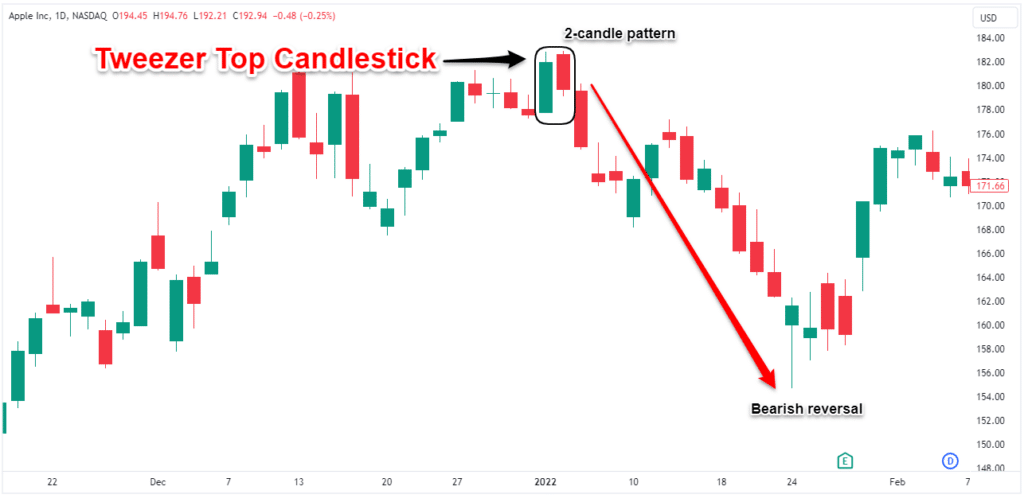
First we have the Tweezer Bottom with two candles having matching bottom wicks. This shows buyers swooping in strongly at a key support level. Time to enter new long swing positions! Conversely, the Tweezer Top with matching top wicks shows distribution and marks potential swing short entries.
Day Trading Candlestick Patterns
Day trading candlestick patterns are the keys to nailing entries and exits surrounding intraday moves. While many formations exist, a few superstars tend to precede the most explosive breakouts.
Inside bar
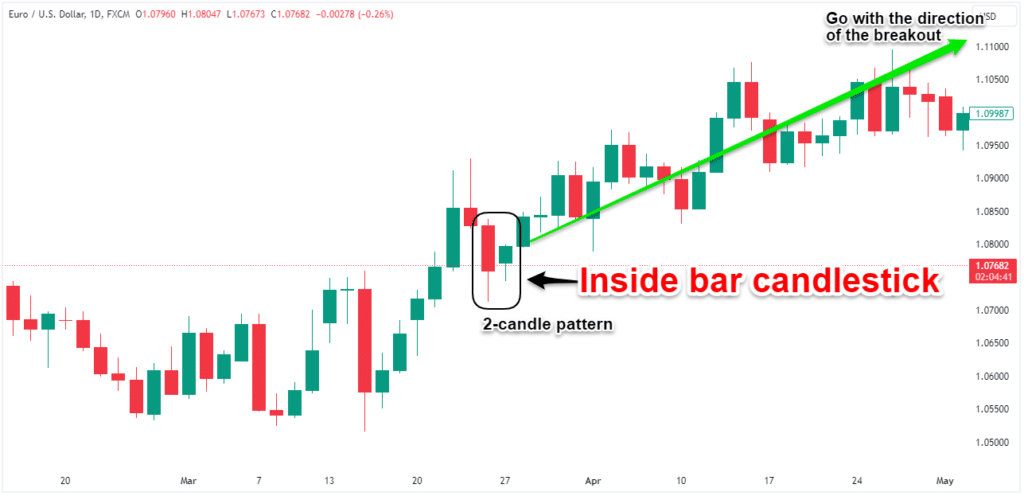
- Inside Bars An inside bar forms when the entire daily price range falls within the prior bar’s high and low.
- This demonstrates consolidation and indecision after volatility.
- Day traders utilize inside bars to spot continuity interruptions and potential breakouts ahead.
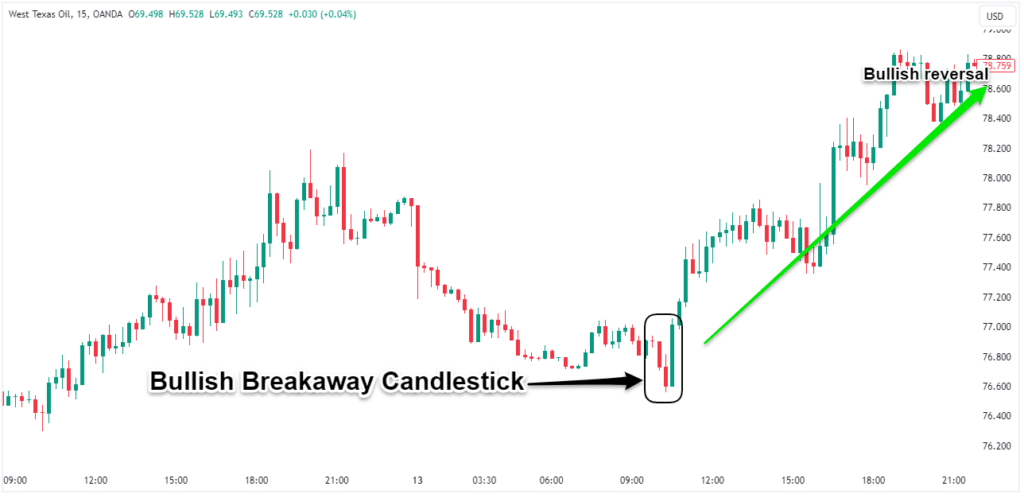
Bullish Breakaway
- The bullish breakaway pattern starts with several declining candles in a downtrend, showing strong control by bearish forces.
- But then out of nowhere, a singular large bullish candle explodes higher, breaking out of the prior sessions’ range unexpectedly.
- This extremely wide-range candle gaps away signals the downtrend’s sudden end as bulls grab control.
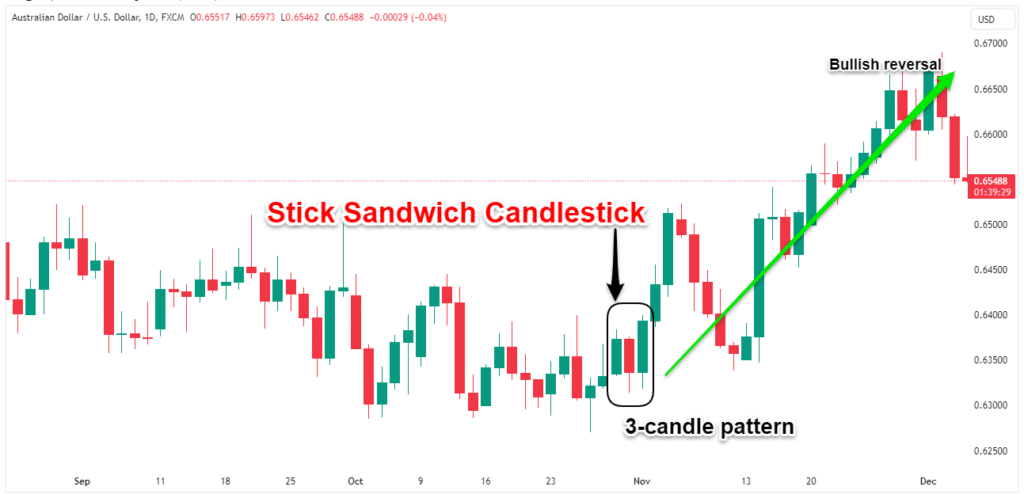
Stick Sandwich
- The stick sandwich candlestick gets its descriptive name from its composition – a “stick” or narrow range candle nestled between two wide range candles on either side.
- This shows decreased volatility and indecision sandwiched between intensity.
- Traders observe stick sandwich pivots for potential reversals ahead.
Final words
And there you have it – the essential candlestick patterns every trader needs to know!
We covered the classic reversal signals like Dojis and Evening Stars warning of trend changes. You now know the bullish Marubozus, White Soldiers and other continuation patterns signaling further momentum ahead.
While hundreds of candle formations exist, mastering these high-probability candlesticks first will put the odds of trading success firmly in your favor.
With the markets as hotly contested as ever, having trading edges will be more important than ever.
But who has time to pore through hundreds of complex chart formations?!
You want simple, crystal clear trade signals that cut through the intraday noise and identify big moves BEFORE they ignite and that’s exactly what these powerful candlesticks patterns deliver!
Remember, don’t get overwhelmed trying to memorize every exotic candle variant. Stick with the highest probability patterns and the rest will come naturally with practice.
Now those colorful charts that once appeared filled with chaos will transform into your own personal crystal ball, giving you a glimpse into the future so you’ll become a master at forecasting what markets will do next!


