Four Candle Hammer Strategy – Powerful Technical Analysis Strategy


In this article, we’re going to teach you one of our favorite technical analysis strategy. The four candle hammer strategy is a pullback strategy that has been long used by hedge fund managers and professional traders.
Our team at Trading Strategy Guides has decided to bring to light one of the best secrets kept by hedge fund managers that they don’t want you to know.
We used this technical analysis strategy for more than 20 years, and we still find it producing the same kind of performance in today’s market. Technical analysis trading is useful for any type of market from stock trading, Forex trading and, even cryptocurrency trading.
The four candle hammer strategy works both intra-day for day traders and for swing traders who tend to hold positions for a more extended period of time. We recommend using the hammer strategy on the daily time frame because it yields bigger profits.
The four candle hammer strategy can be used to take both long and short positions.
This guide will include every step that you need to follow so you have a better understanding of how hedge fund managers trade the market. But first let’s define what is technical analysis, and what it’s not.
Once you understand what is technical analysis, you’ll gain a much better understanding of how to read a chart price. Also, read the weekly trading strategy that will keep you sane.
What is a Technical Analysis strategy?
 In trading, technical analysis is a method used to forecast the direction of the market price or the strength of the trend by analyzing the past market price. Technical analysis trading focuses on the charts and other technical indicators to forecast the market
The three fundamental principles behind technical analysis basics are as follows:
- Market price action discounts everything. So, wherever the market is trading now that’s the fair market price. All the hopes, fears and market expectations they’re all factored into the price.
- Markets move in trends. The markets take a while to get to wherever they are going to go.
- The third assumption is that history tends to repeat itself so price levels that were vital in the past can often be important in the future.
A technical analysis strategy is not a magic method that’s going to predict every swing in the market. A typical misconception traders have is that technical analysis trading is the answer to getting rich quick which is apparently not the case.
The majority of retail traders will look at technical analysis trading and charts.
Now, let’s don’t waste any more time and jump straight into the hammer strategy rules and how to trade pullbacks or retracements in any type of market.
Technical Analysis Trading – Buy Rules
Moving forward, we’re going to outline a step-by-step process so you can learn how to trade pullbacks in any market in a systematic way. We live by these rules on a daily basis, and we’re confident they will help you execute good trades right from the start. Here is another strategy called trading volume in forex.
The basic concept behind the technical analysis strategy is first to spot a strong market trend followed by a pullback in price. The retracement should only last a short period of time.
Once the market retracement pauses, the trend will resume and continue moving in the direction of the dominant trend.
Essentially the four candle hammer strategy is also a trend following strategy.
Note* Remember to pull out a piece of paper and a pen to write down the technical analysis strategy rules. For this article, we’re going to look at the buy side.
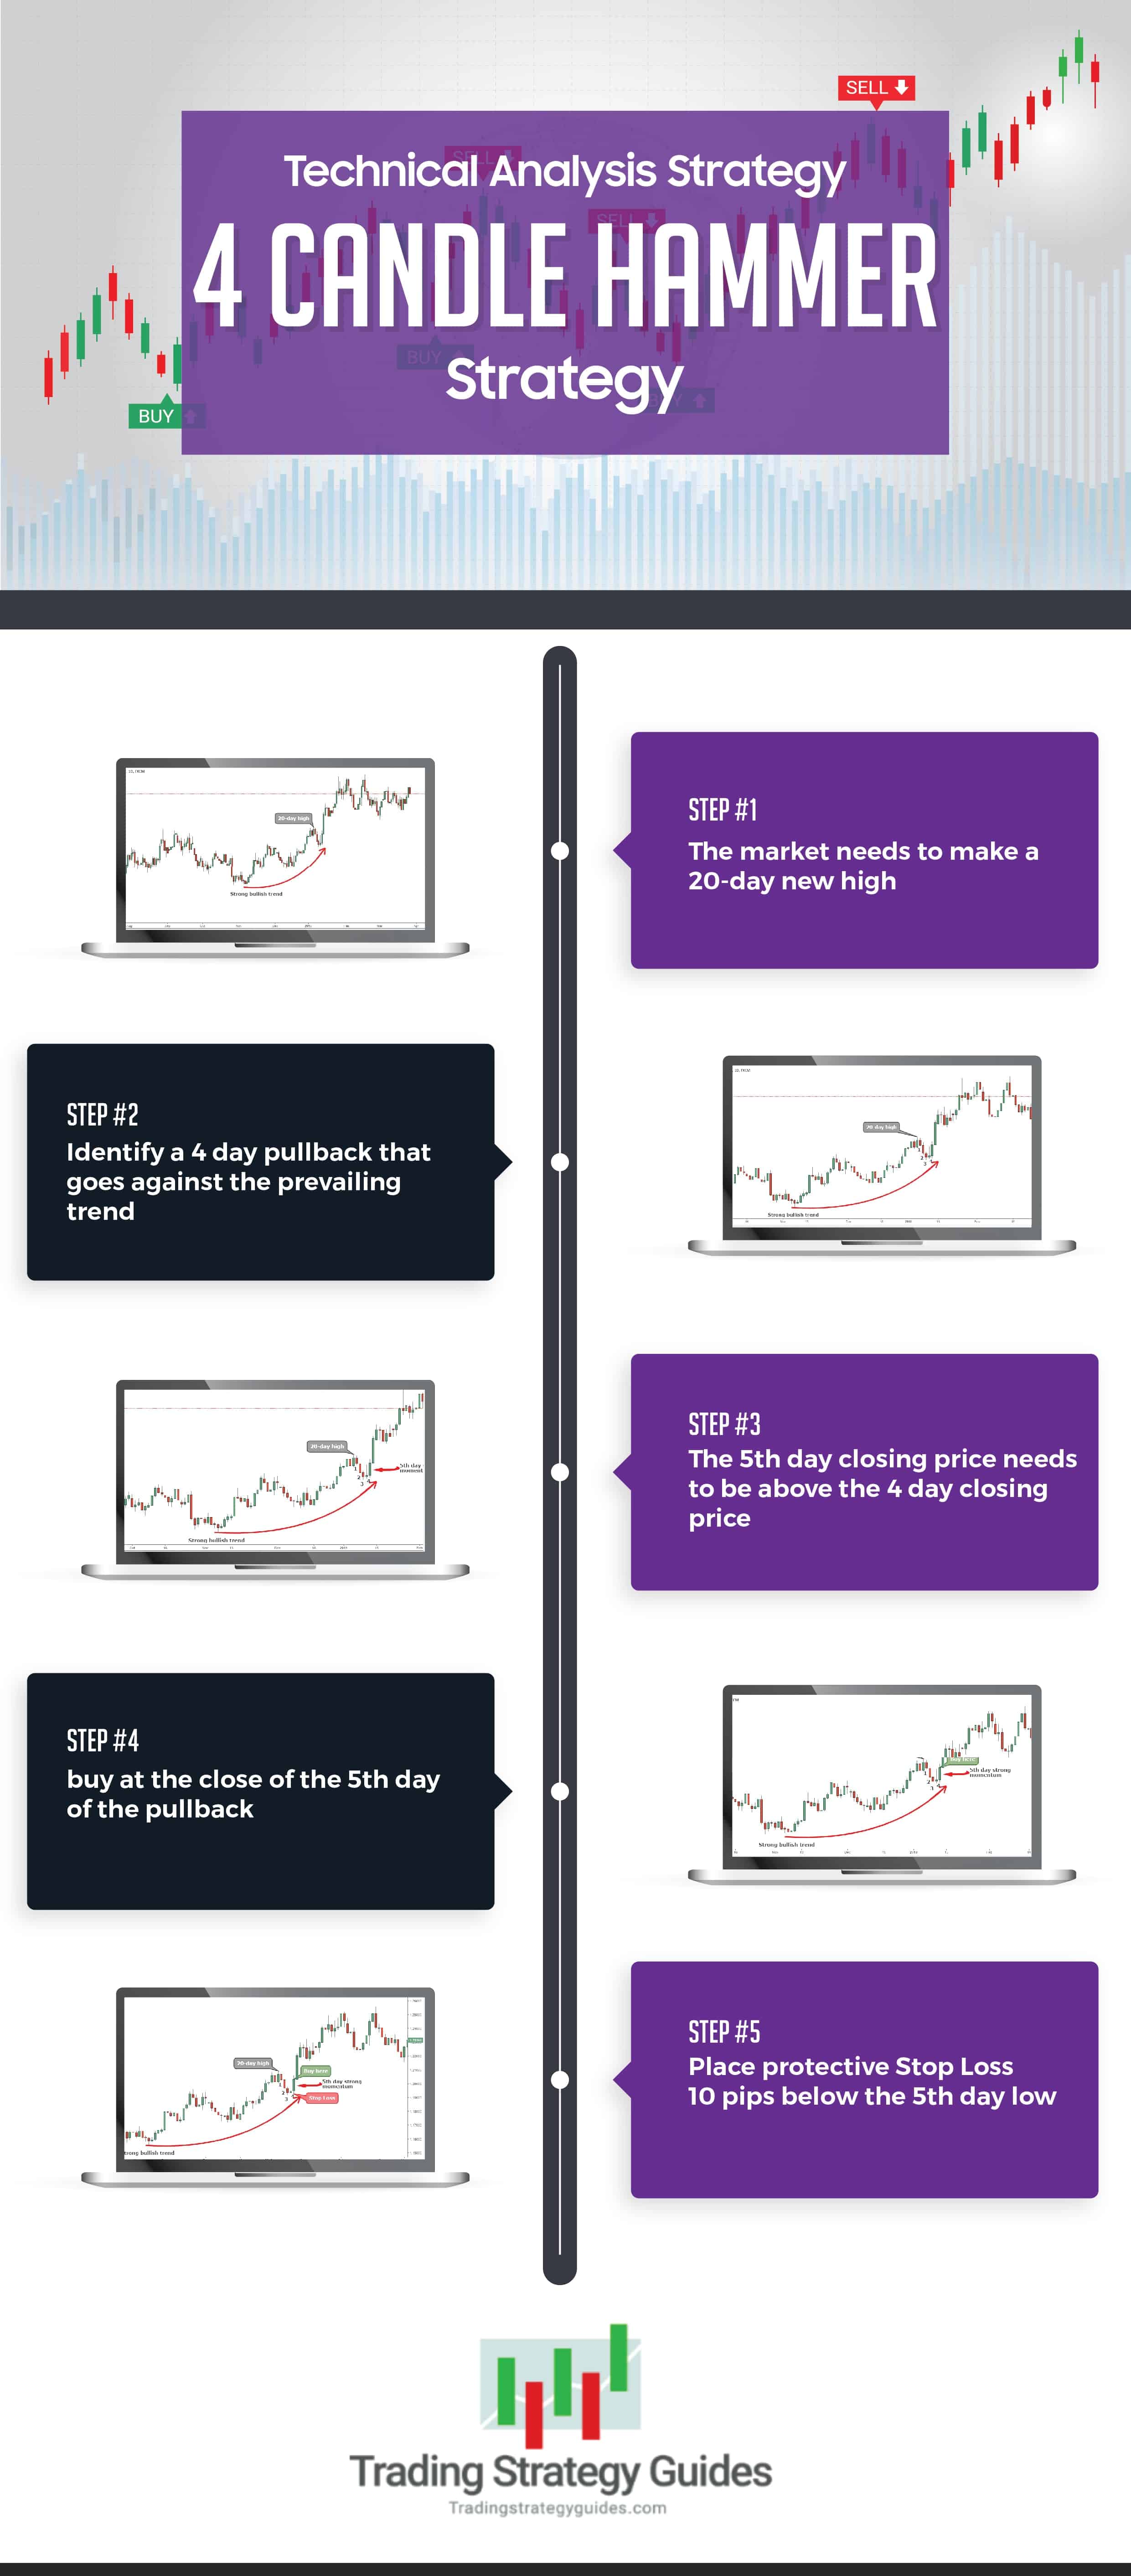
Step #1: The market needs to make a 20-day new high
The first step is to identify the market trend. This makes sense since the four candle hammer strategy is a pullback strategy it needs a prior trend.
The first and most important thing is to identify a strong trend that is moving vigorously up. Identifying strong trends can be done through technical indicators. However, our retracement strategy doesn’t use any technical indicators and relies solely on price action.
Price action is the most accurate way to determine trends and hedge fund managers know this best.
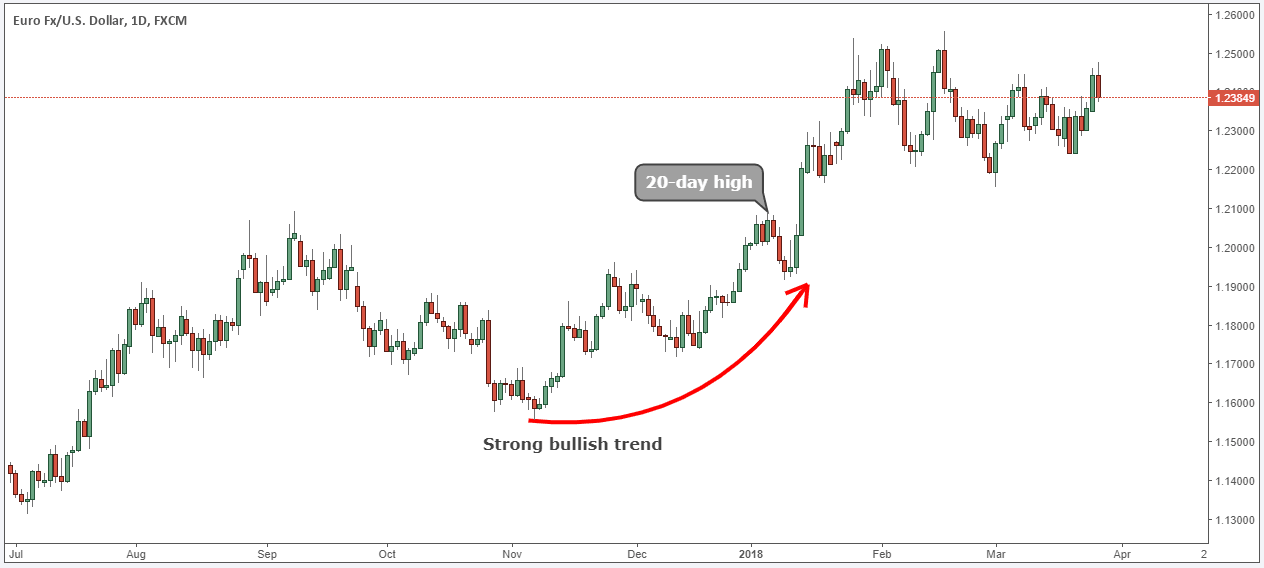
The 20-day high rule is an excellent way to identify markets that are having a strong trend and is it’s rather a simple way to spot the trend.
Note* We’ll demonstrate this trading method on a recent trade so you can see how the pullback strategy works on a live trade.
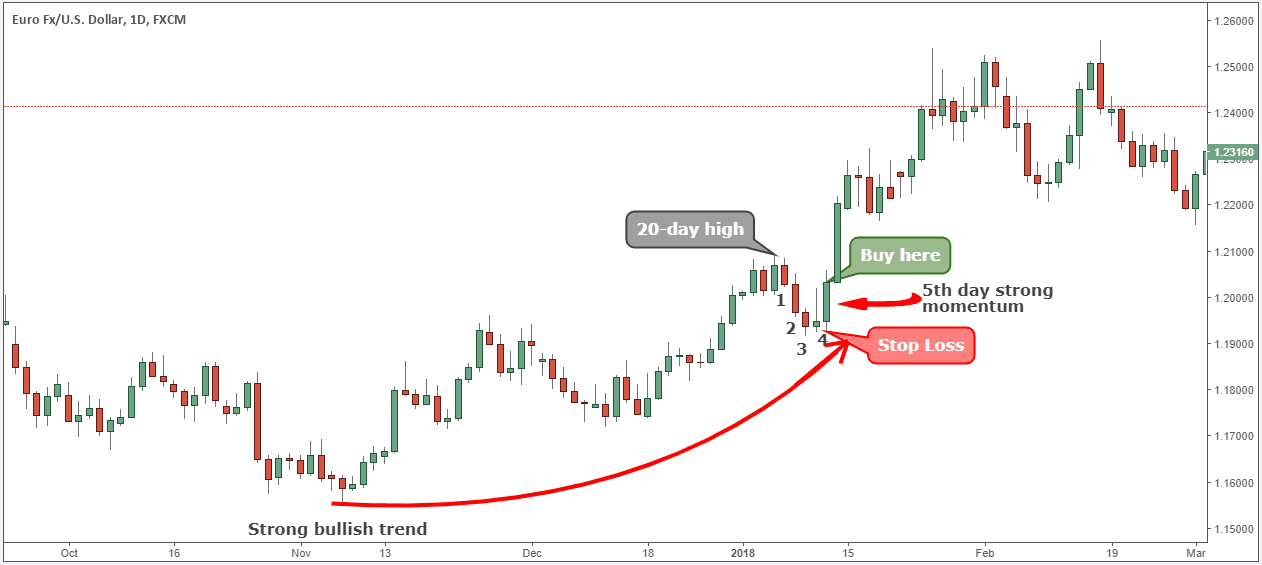
We can see EUR/USD is in a strong bullish trend, but it’s not overextended but still trading sharply in one direction.
Now, this brings us to the second rule.
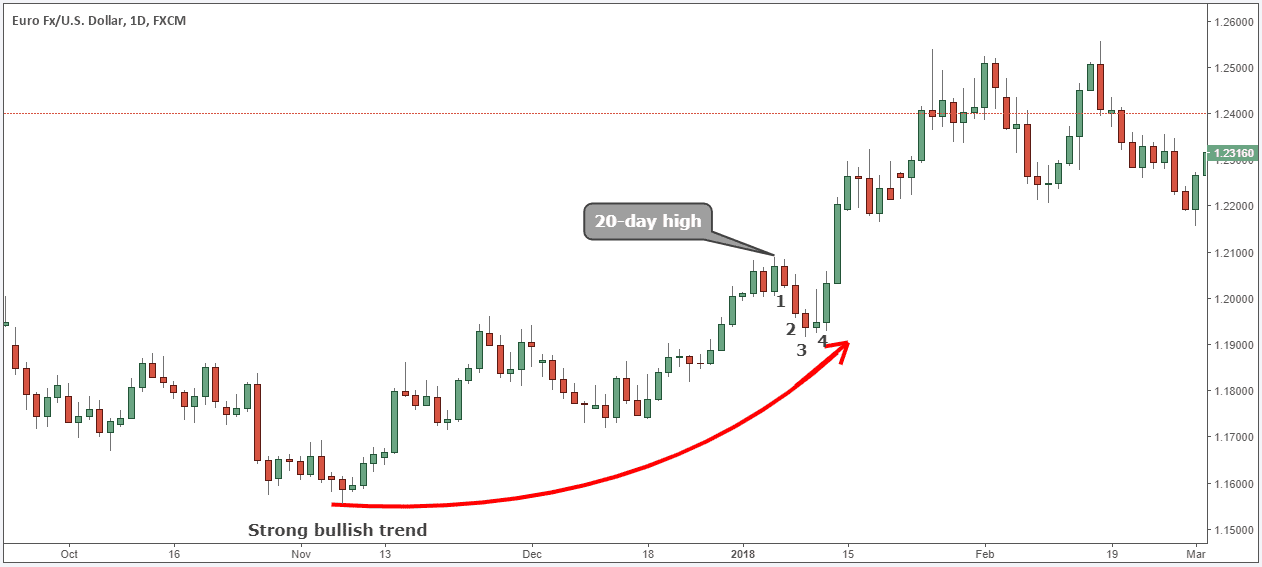
Step #2: Identify a 4-day pullback that goes against the prevailing trend.
As a general rule, the second part is to spot a pullback that moves against the prevailing trend. This step is quite important because the pullback will create our entry opportunity before the market starts resuming the prevailing trend.
Make sure to also check out our article on how to apply technical analysis!
The four candle hammer strategy will rely again on the price to identify the retracement. Technical analysis trading can be done even without indicators. However, the retracement still needs to satisfy some trading conditions.
Namely, we want to see 4 consecutive days of retracement in a row after the 20-day high was put in place.
The next step will also outline our pullback buying strategy.
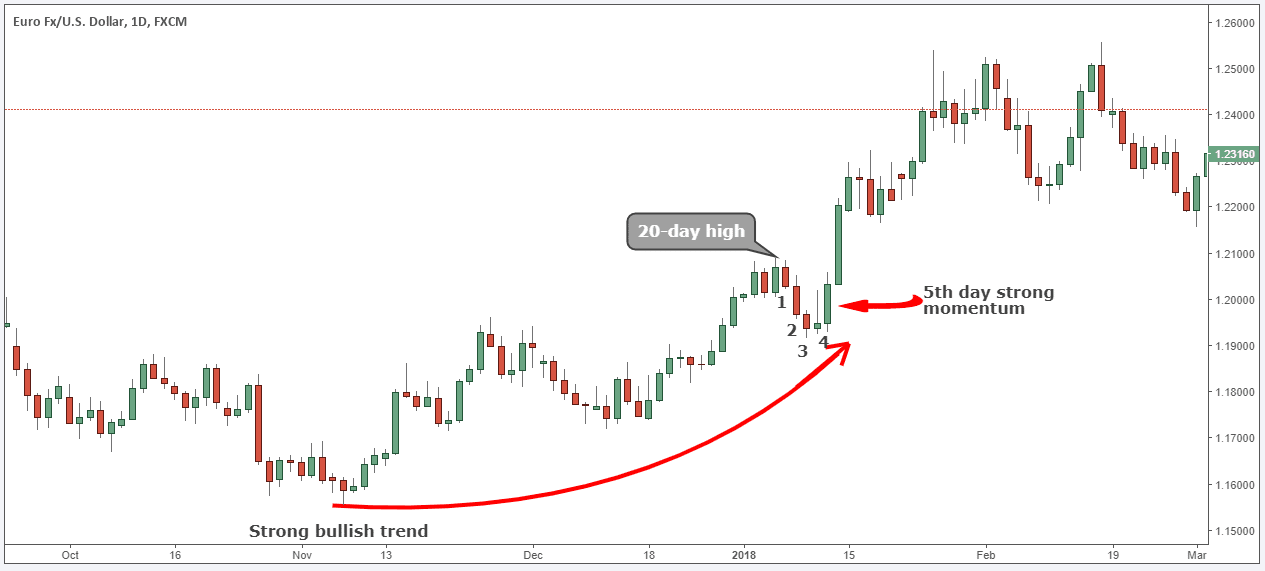
Step #3: The 5th-day closing price needs to be above the 4th-day closing price
It’s our job to identify when the short-term retracement will end and jump on the wagon before the dominant trend resumes and leaves us in the dust.
On the 5th day, we’re looking for the market to put an end to the retracement. The upside momentum should pick up on the 5th day.
The stronger the momentum at this stage, the better.
Note* It’s sufficient for the 5th-day closing price to be above the 4th-day CLOSING price. Please note that we didn’t say the 4th-day HIGHEST price. The rule is that the higher the 5th-day closing price is, the better.
This is a crucial day because it’s the day prior to our possible entry point.
The next part of the four candle hammer strategy is detecting the right spot of where to enter the market.
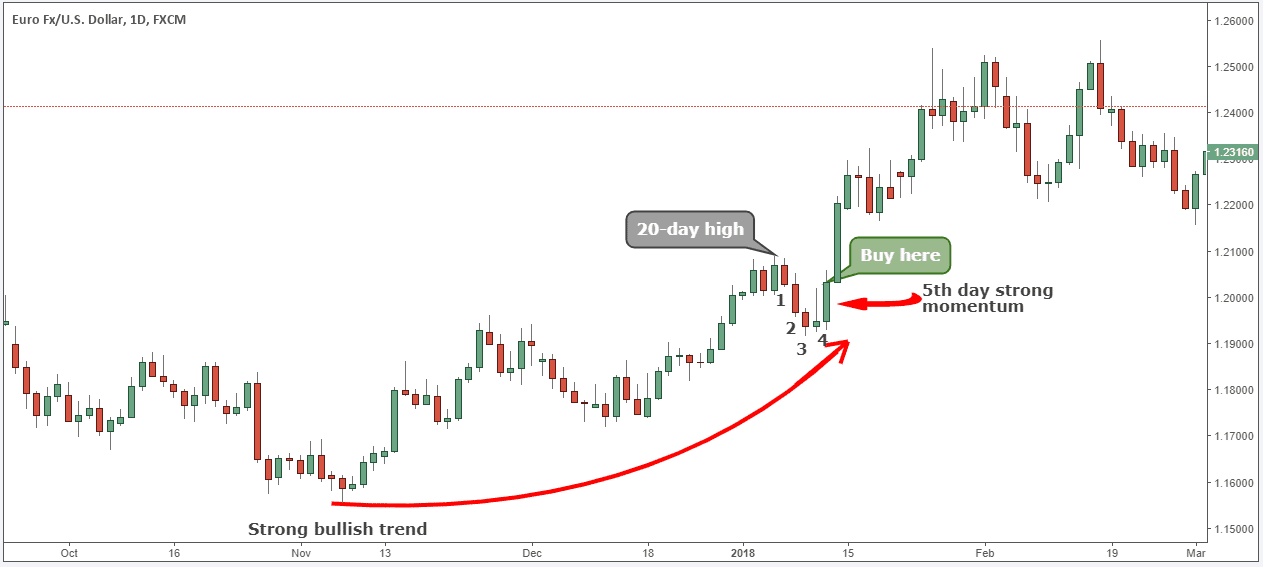
Step #4: Buy at the close of the 5th day of the pullback
Our retracement strategy is offering us a good entry point that is close to the end of the pullback. This is also the point where the market will begin resuming the primary trend.
In this regard, we buy at the close of the 5th day of the pullback. Or you can say that we buy at the opening of the 6th day.
Our entry strategy will help you maximize your profit potential and minimize your risk level.
The next important thing we need to establish for our pullback strategy is where to place our protective stop loss.
See below …
Step #5: Place protective Stop Loss 10 pips below the 5th day low
Usually, the lowest risk trades happen when the retracement of a strong trend ends. This is the reason why we’re able to use such a tight stop loss.
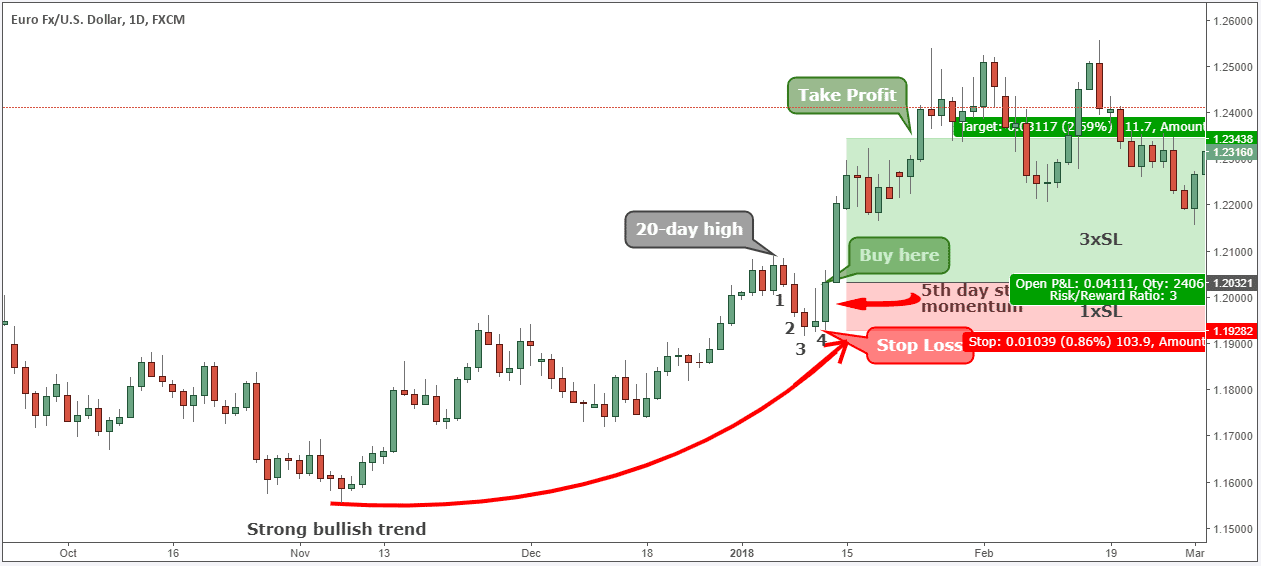
Place your protective stop loss 10 pips below the 5th day low. We’ve added a buffer of 10 pips to protect ourselves in case of any false breakouts.
Note* Remember to always use SL because not using stop loss is the number 1 reason why traders take significant losses.
Last but not least, we also need to define the technical analysis trading methods and techniques for four of our take profit levels which brings us to the last step of our technical analysis tutorial.
See below …
Step #6: Take Profit equals 3 times the distance between your entry price and your stop-loss price
The best way to establish your profit targets is to multiply the distance between your entry price and your stop-loss price by 3. In other words, we want our profit target to be 3 times greater than our stop loss giving us a positive risk to reward ratio of 1:3.
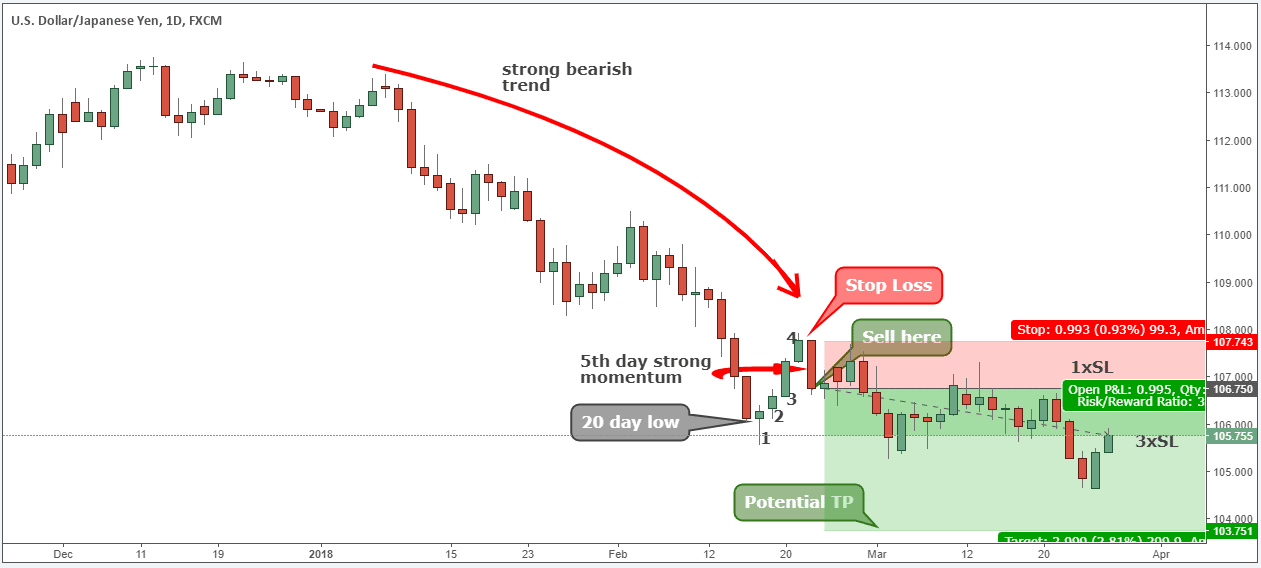
Note** the above was an example of a BUY trade using technical analysis trading. Use the same rules for a SELL trade – but in reverse. In the figure below, you can see an actual SELL trade example.
Conclusion – Technical Analysis Trading
Many hedge fund managers believe that technical analysis trading has a role and a place in every investor’s toolkit. One of the biggest mistakes retail traders make is not looking at the big picture trend, and the four candle hammer strategy capitalizes on this market pitfalls. You can also trade with the breakout triangle strategy.
If you correctly follow this technical analysis strategy guide, then you should have a better understanding of how the market moves and how smart money operates in the market.
Thank you for reading! Be sure to read more about candlestick trading in the Best Candlestick Strategy Guide.
Please leave a comment below if you have any questions about what is technical analysis!
Also, please give this strategy a 5 star if you enjoyed it!
[ratings]
Please Share this Trading Strategy Below and keep it for your own personal use! Thanks, Traders!





Excellent. Thank you.
Merci pour ces conseils…
Et si, à la 1ère lecture du MFI = 100, la bougie est rouge et qu’à la 2ème lecture du MFI = 100 est rouge aussi… que le prix est à peu près stable… à la 3ème lecture du MFI = 100, il faut s’attendre à une baisse ou pas forcément ?
Sorry no one in the office speaks French and Google translate isn’t working. ☹
Great . I checked in cryptocurrency and it answered. I am an Iranian
what is the best tool/app to use to see the charts?
I use Webull and in that platform there are free indicators. You can use any trading platform and there are also indicators you can buy. It’s all about finding what works best for you.
Very good insights
Thank you!
thanks for good information about trading
Thank you!
THANK YOU