Trend Following Trading Strategy: Master the Ichimoku System
The Trend Following Trading Strategy is an approach that combines the precision of technical analysis with the clarity of market trends.
This article delves into utilizing the Ichimoku indicator, a powerful tool for identifying market directions and potential trade opportunities. Focused on practical application, it provides insights on how to effectively interpret and use this indicator for better decision-making in trading.

Thanks for visiting Trading Strategy Guides (TSG)!
You have discovered the most extensive library of trading content on the internet. Our aim is to provide the best educational content to traders of all stages.
Learn Our Trading Best Strategy By our Founder Casey Stubbs
In other words, we want to make YOU a consistent and profitable trader.
If you’re a brand new trader, we recommend hopping over to our ultimate beginner’s guide to trading to learn more.
With a straightforward explanation of key concepts and actionable steps, this strategy is tailored for traders seeking to enhance their market analysis and improve trade execution.
It emphasizes a disciplined approach to trading, underlining the importance of understanding market movements and responding strategically.
Table of Contents
The Trend Following Trading Strategy
This Trend Following Trading Strategy article will teach you how to use the Ichimoku Indicator to follow trends. You’ll use this indicator to enter and exit trades successfully.
Ichimoku Kinko Hyo gauges support and resistance and then determines the future price movement. Many traders are intimidated by this new strategy, especially if they have never used the Ichimoku indicator before.
Despite its complexity, the Trend Following Trading Strategy is actually easy to learn. With a bit of practice and patience, it can be a very successful trading strategy. If this strategy is too difficult for you, feel free to read and try our Parabolic SAR Moving Average trading strategy instead.
Ichimoku trading strategies are hard to come by because this indicator is complicated for many traders. This is one of the more advanced ichimoku trading strategies you will find.
It is actually very simple to use. You will learn about the Ichimoku 5-minute strategy, buy-sell signals, settings, kinko hyo indicator, simple trend-following strategy, and more aspects of this particular indicator.
Ichimoku Indicator Basics
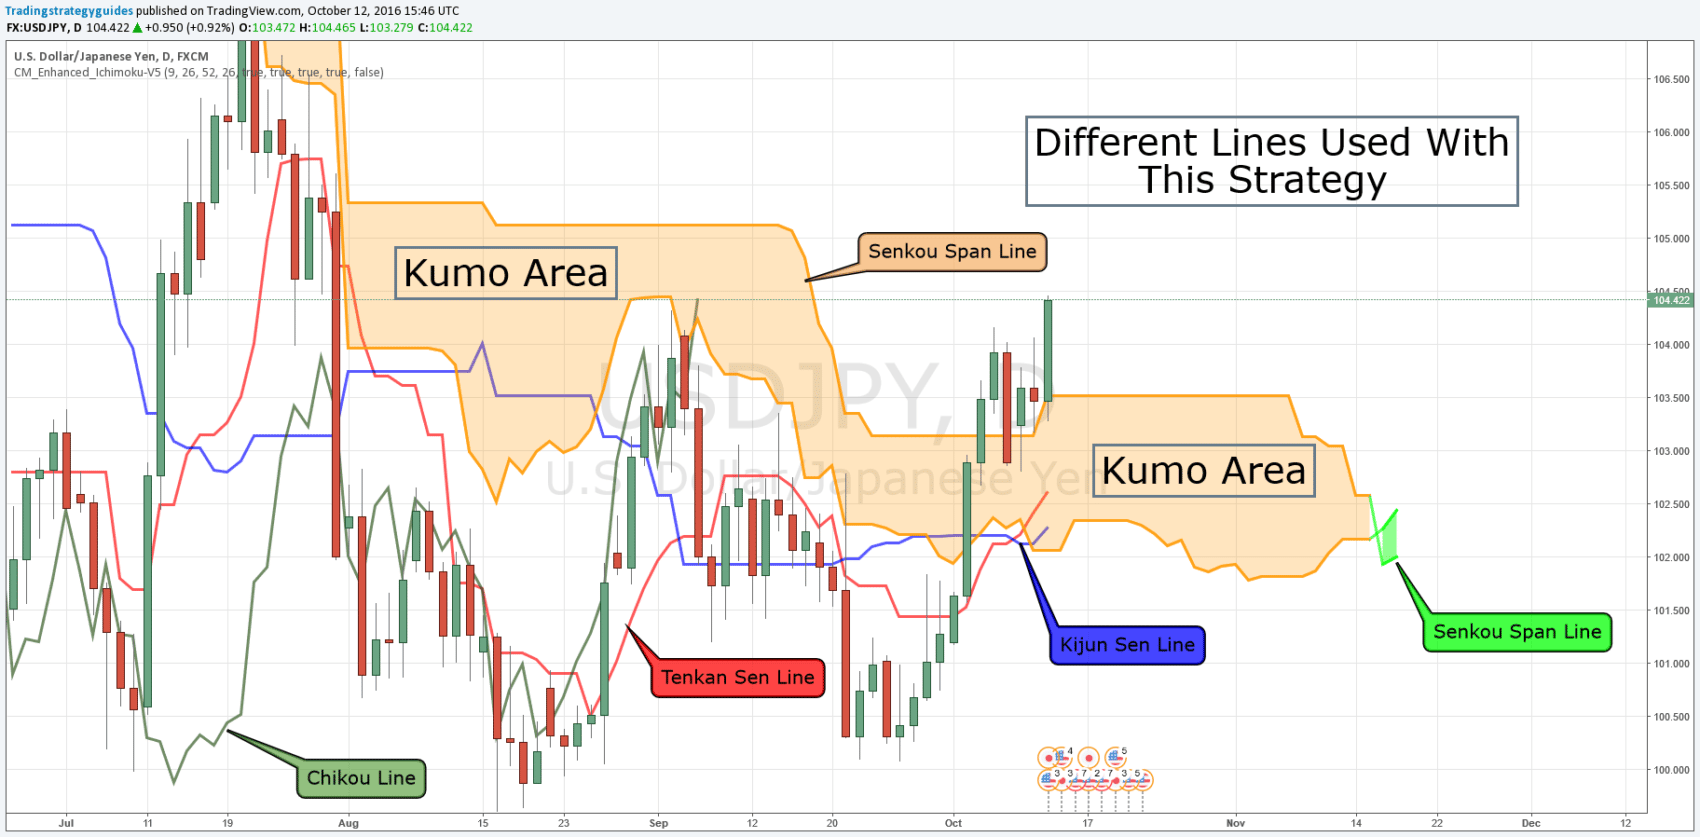
Before we get started with this trading strategy, let me explain how this indicator works. There are five lines, and they are all distinct colors to make it easy to identify the different lines.
- Kijun Sen (blue line): This line can also be called the standard line or the baseline. Moreover, this is calculated by averaging the highest high and the lowest low for the past 26 periods.
- Chikou Span ( dark green line): What this line does is give you the closing price of today and is plotted 26 periods behind.
- Tenkan Sen (red line): This line is called the turning line. The calculation for this line is averaging the highest high and the lowest low for the past nine periods.
- Senkou Span (lime green, orange): Two lines make up the Senkou Span. The first line (lime green)is calculated by the average of Tenkan and Kijun Sen and is plotted 26 periods ahead. Now, the second line (orange) is determined by averaging the highest high and the lowest low for the past 52 periods and plotted 26 periods ahead.
- Kumo Area: The area in between the two points of the Senkou span is called Kumo. This can be defined as the space between Senkou spans A and B. The cloud edges identify current and potential future support and resistance points. In future examples, you can easily identify this by the lime green/orange “cloud.”
Note: These settings are the default for this indicator. They can be adjusted, but this strategy needs to be used with the default settings.
Below will give you a great visual of what these different lines look like in a chart. As you can see, each line is colored to make it simple to identify each of these.
This strategy should be used on higher time frames like 30 minutes, 1 hour, 4 hours, 1 day, or even a month! The reason? Well, this particular indicator follows trends, so a lower time frame, such as a minute time frame, will possibly give you a false reading.

Enjoy
90% Off
Ichimoku Ninjas Premium Course
So, let’s get started on this strategy!
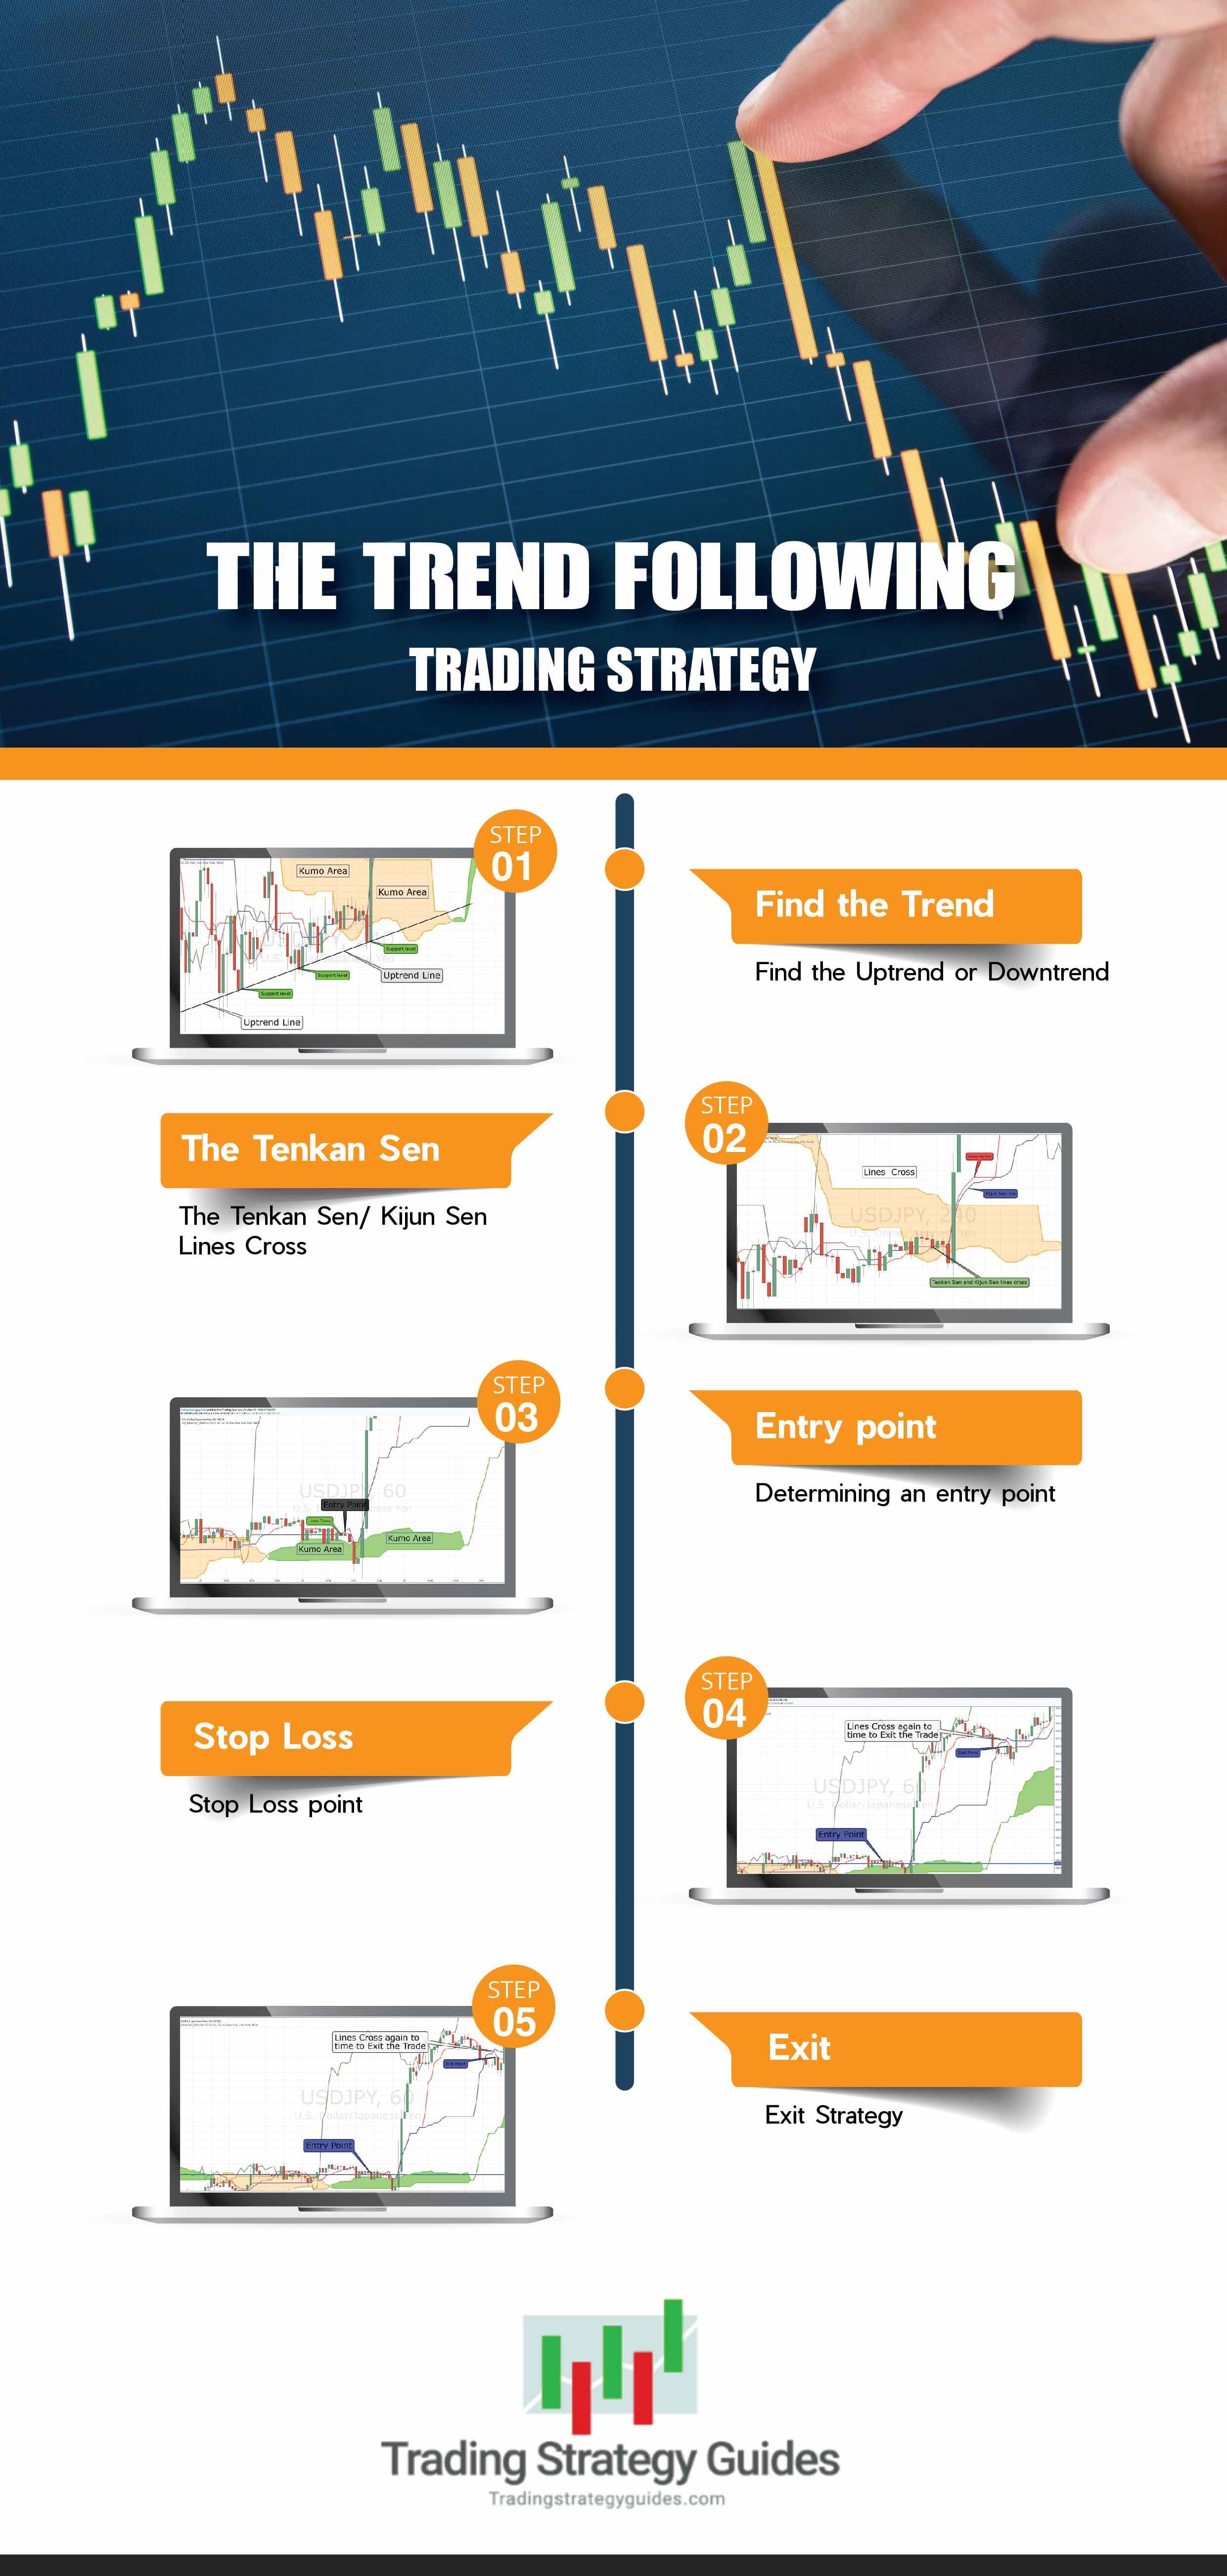
Step #1: Using the Ichimoku Indicator to Find the Uptrend or Downtrend
Since this is a trend-following strategy, the first thing that needs to be identified is a trend. Do this in a one-day or four-hour time frame. These time frames will give you the best opportunity to identify a trend.
In the example below, we see an upward trend with three levels of support.
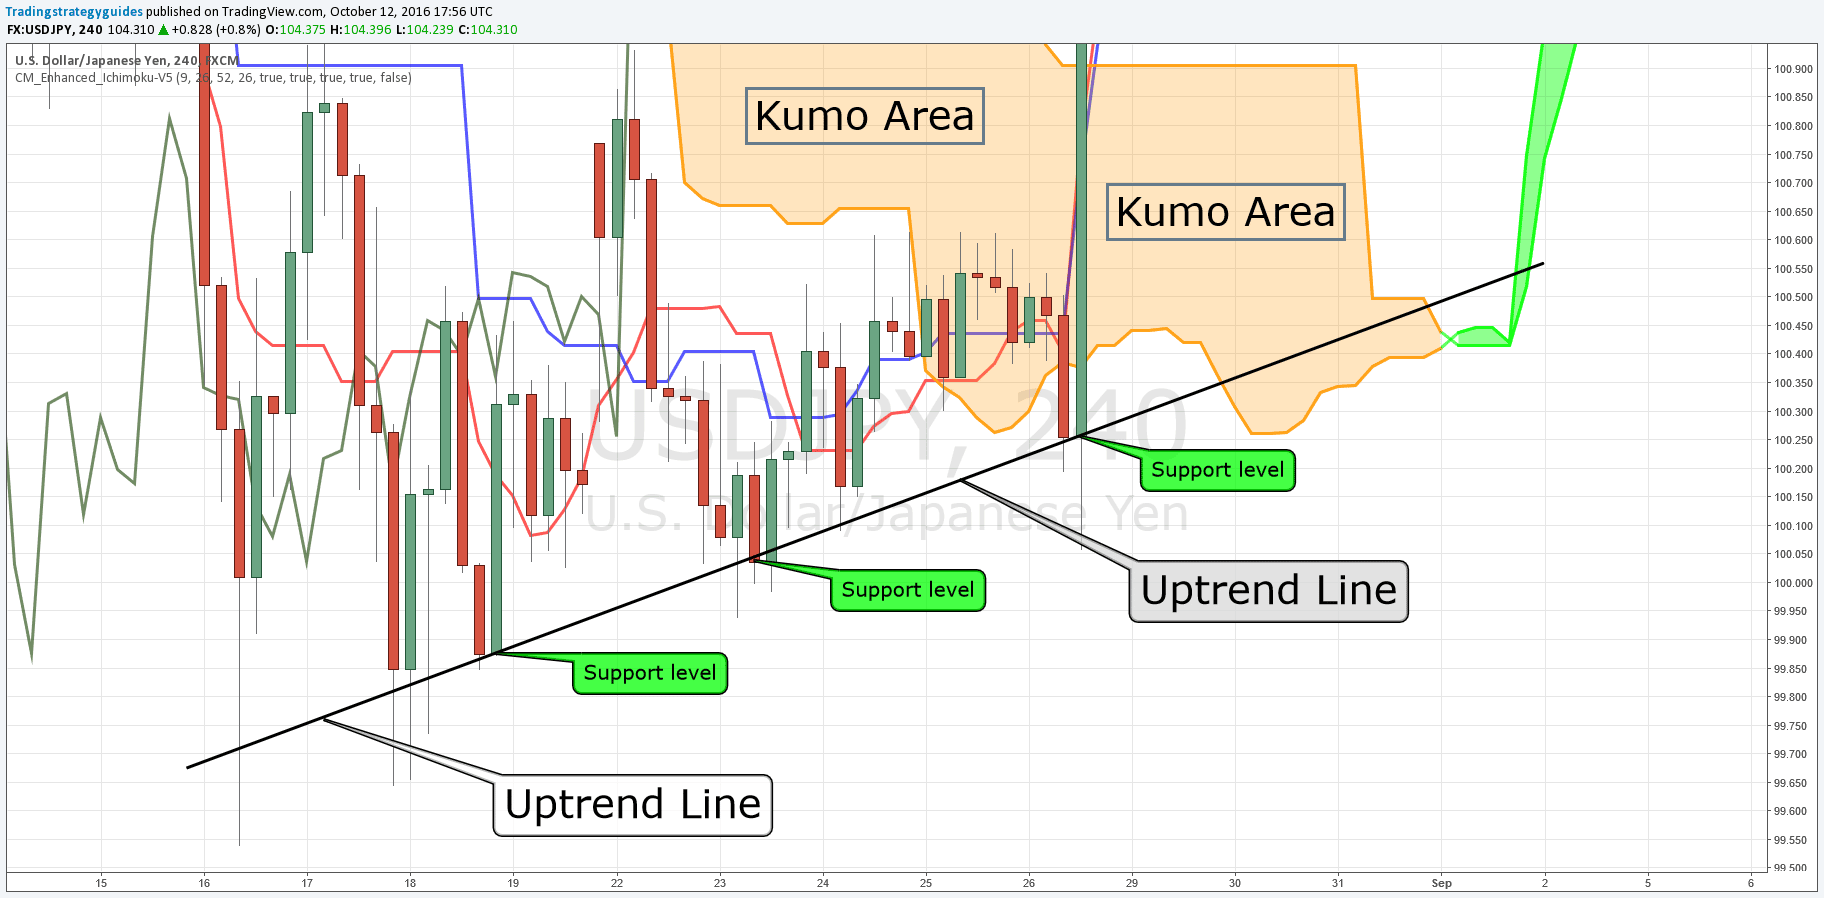
Drawing trend lines is one of the simplest ways to find a trend. Draw the trend line where there is support or resistance. The example above has three different levels of support to confirm this uptrend.
This trading strategy will always go in the direction of the trend. So, an uptrend will ALWAYS be a BUY. A downtrend will ALWAYS be a SELL.
Moreover, this strategy uses all of these tools to identify if a trend will keep going and get you into the uptrend or downtrend. Here, you can see a funny video about trading levels.
Perfect, let’s move on to the next step.
Step #2: Ichimoku Trading System the Tenkan Sen/ Kijun Sen Lines Cross
In this next step, I will use the Trend Following Trading Strategy to explain the criteria needed for a trade entry. Just to keep you on track, the Tenkan Sen lines are Red, and the Kijun Sen lines are Blue. This crossing signal will tell you whether there is a solid bullish or bearish trend.
When the Tenkan Sen line crosses above the Kijun Sen line, then this will give you an indication that there is a bullish trend. In the example below, you can see the lines clearly crossed, which is our indication that this bullish uptrend is strong.
These lines are designed to do that very thing when they cross each other. After the cross happened, the blue line (Kijun) is now below the red line (Tenkan). That means that the trend is going to keep heading upward. This is not an indication that the trend is breaking.
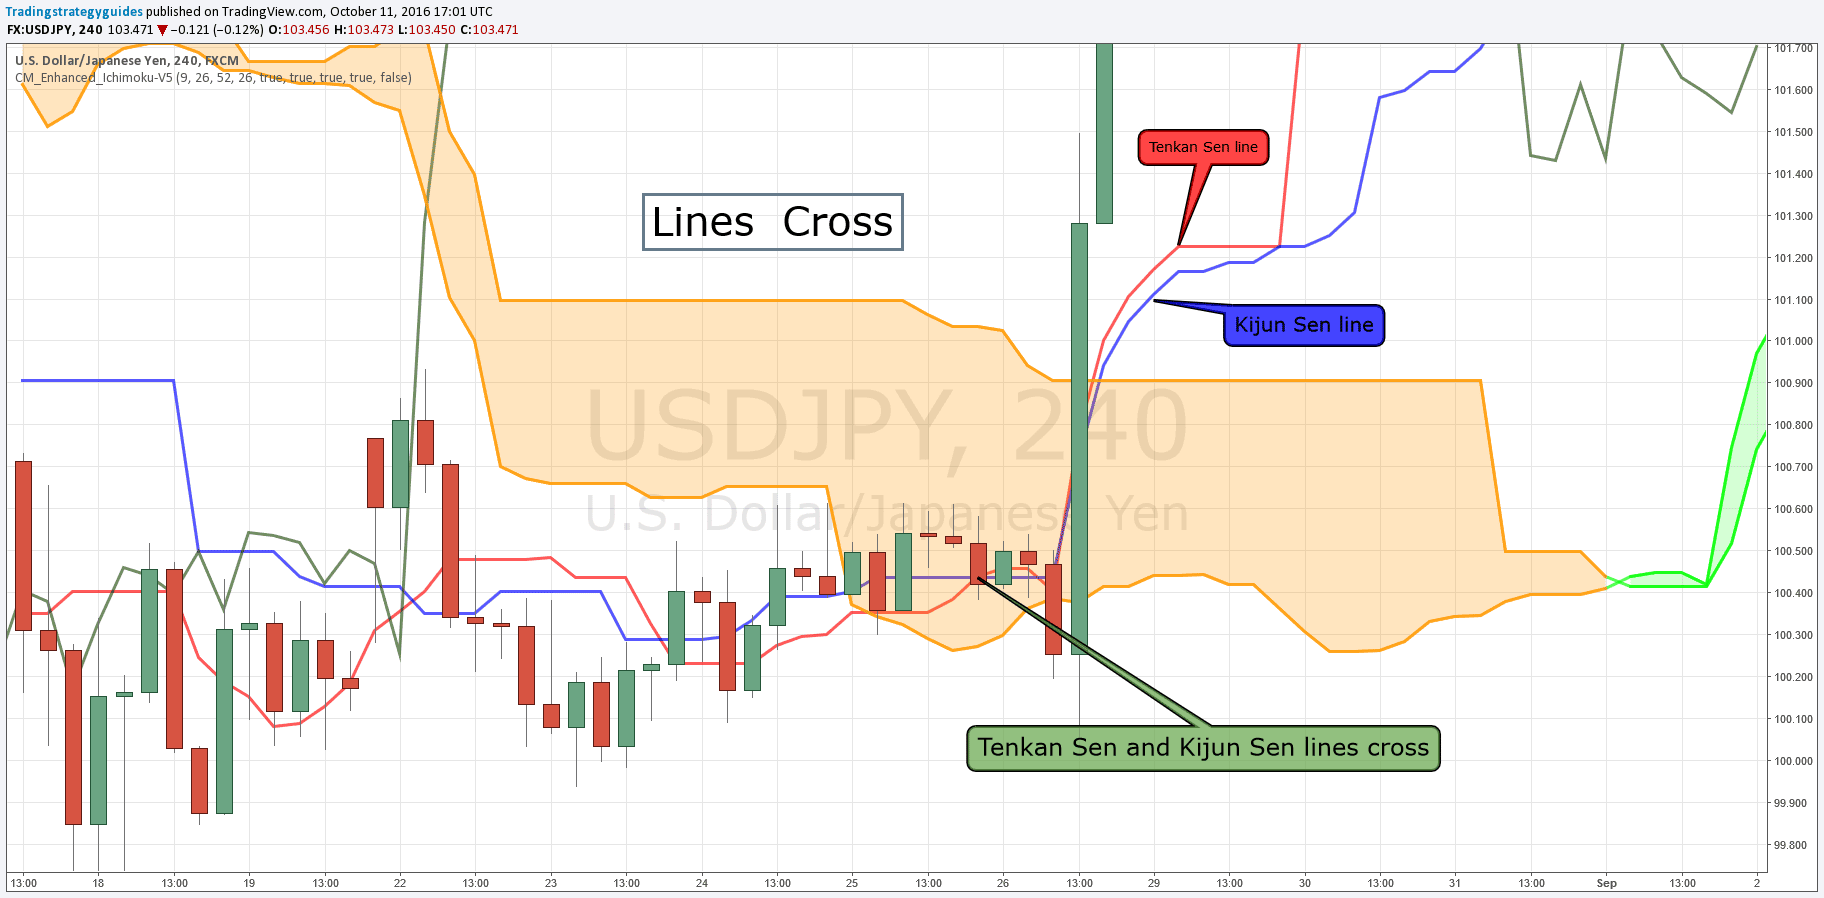
This was used on a four-hour chart, and it’s the best time frame to use because it gives you an excellent overall picture of how the last few days have gone as far for the trend.
In this timeframe, the lines need to cross either in the Kumo, which in the picture above is the orange area, or right above the cloud in this example. This was a buy signal because the trend was bullish while the Tenkan Sen line crossed above the Kijun Sen line in the Senkou span area (Kumo).
Note: If the lines cross below the Kumo area in an uptrend, do not buy/sell. The opposite can also be applied to a downtrend. If the lines cross above the Kumo area in a downtrend, do not sell/buy.
Now, the reason for this is that this would be a weak signal that the trend will keep going up or down. The trade must always be made to go toward the trend.
Recapping our rules using the Trend Following Trading Strategy, these three things must happen to enter a trade using the Ichimoku Indicator.
- Identify the trend. This needs to be an upward or downward trend. The trade must go in the direction of the trend.
- Tenkan Sen line needs to cross the Kijun Sen line.
- When the two lines cross, they need to cross in one of these two specific areas. The first place would be in the Kumo area, and the second will depend on whether it’s an upward or downward trend. In an upward trend, they need to cross above the Kumo area. During a downward trend, they need to cross below the Kumo area.
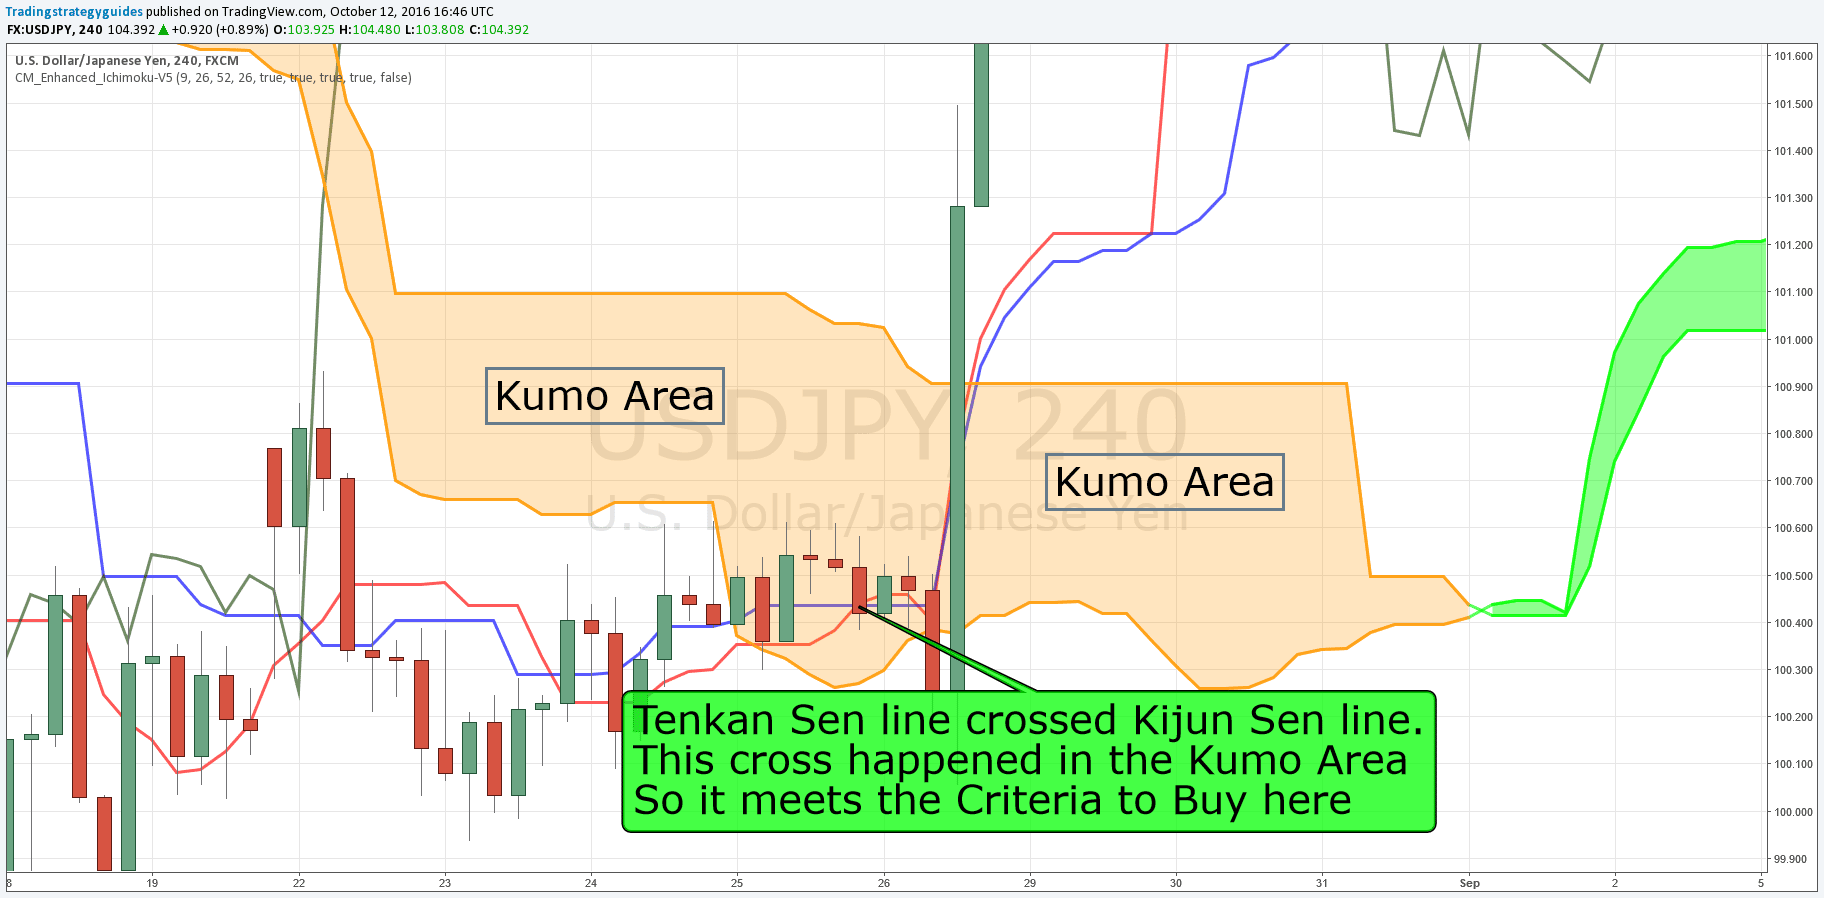
The example above shows that this trade would not meet the criteria if the lines crossed below the Kumo area. However, it crossed in the Kumo area, so it met the requirements.
Note: This is a trend-following strategy. It is to help you identify a trend and identify that the trend will keep going either upward or downward.
Step #3: Determining an Entry Point Using the Trend Following Trading Strategy
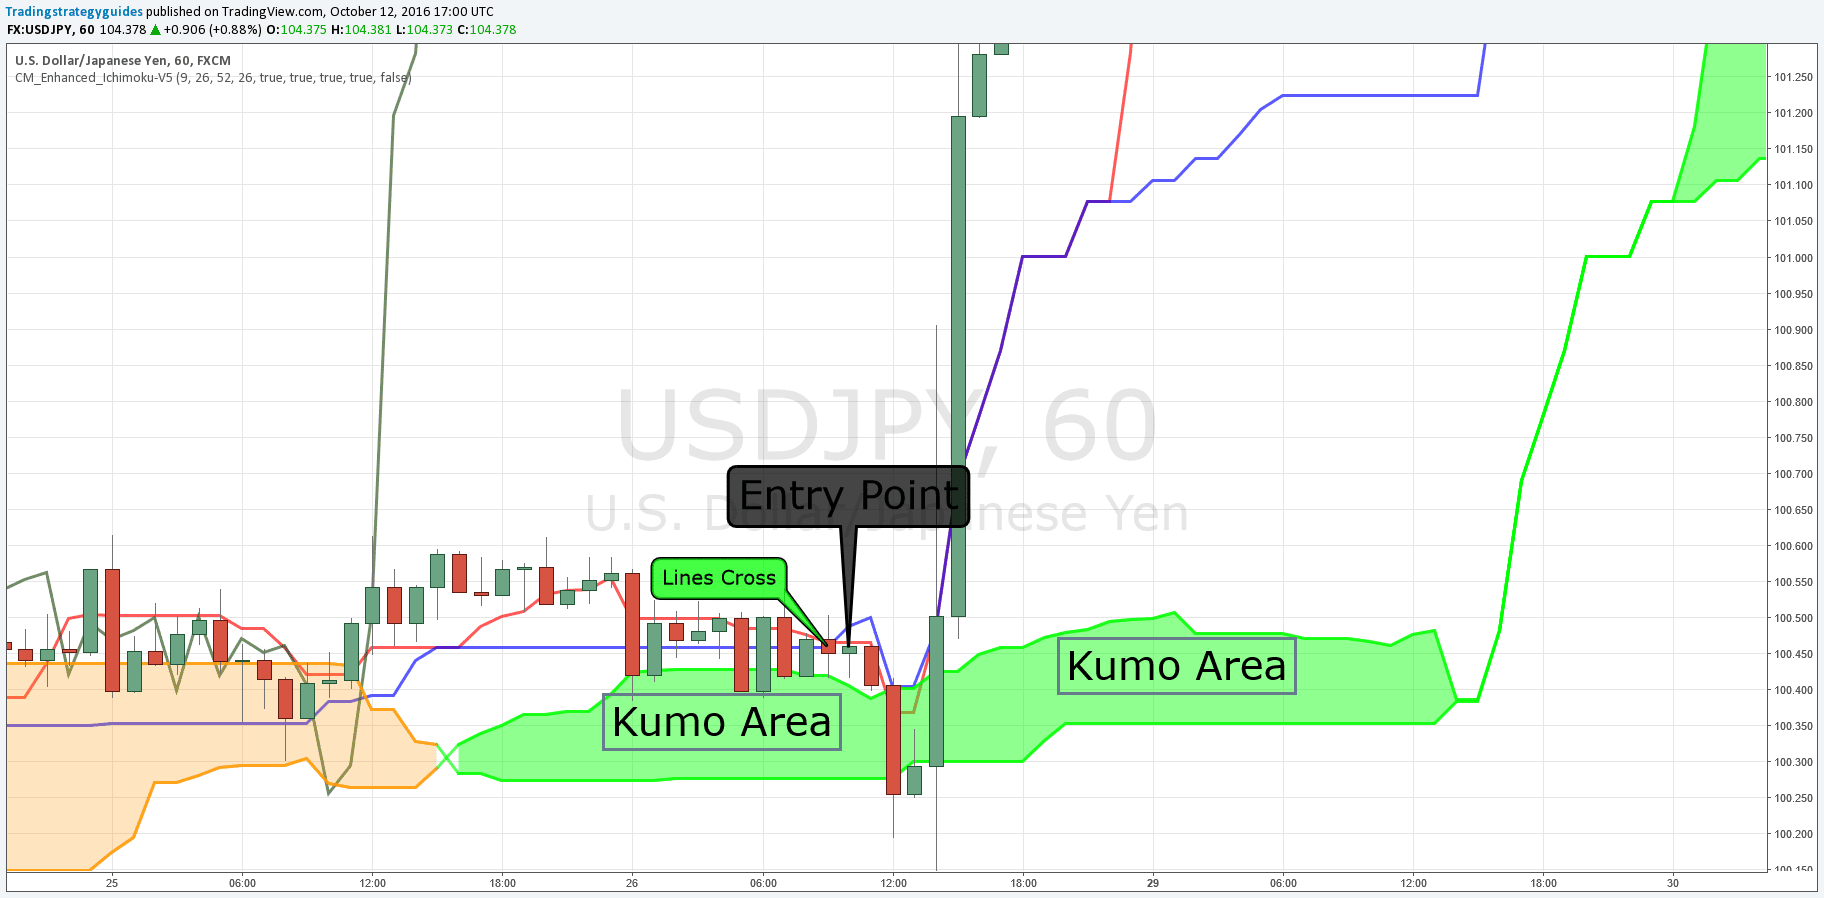
Determining an entry point should be very easy to do now. This is because once the Tenkan sen line crossed with the Kijun sen line either in the Kumo or just above or below the 4-hour time frame.
Now, simply drop down to a 1-hour time frame chart and enter the trade. You may check other time frames, but there is no need since you have already followed the rules to enter the trade on the four-hour time frame. This is just to give you a better perspective on where you are entering.
Step #4: Stop Loss Point
Stop loss is always essential to have in case the trade goes in the wrong direction and you are now stuck in a pickle whether to end the trade early or end it too late and lose it all!
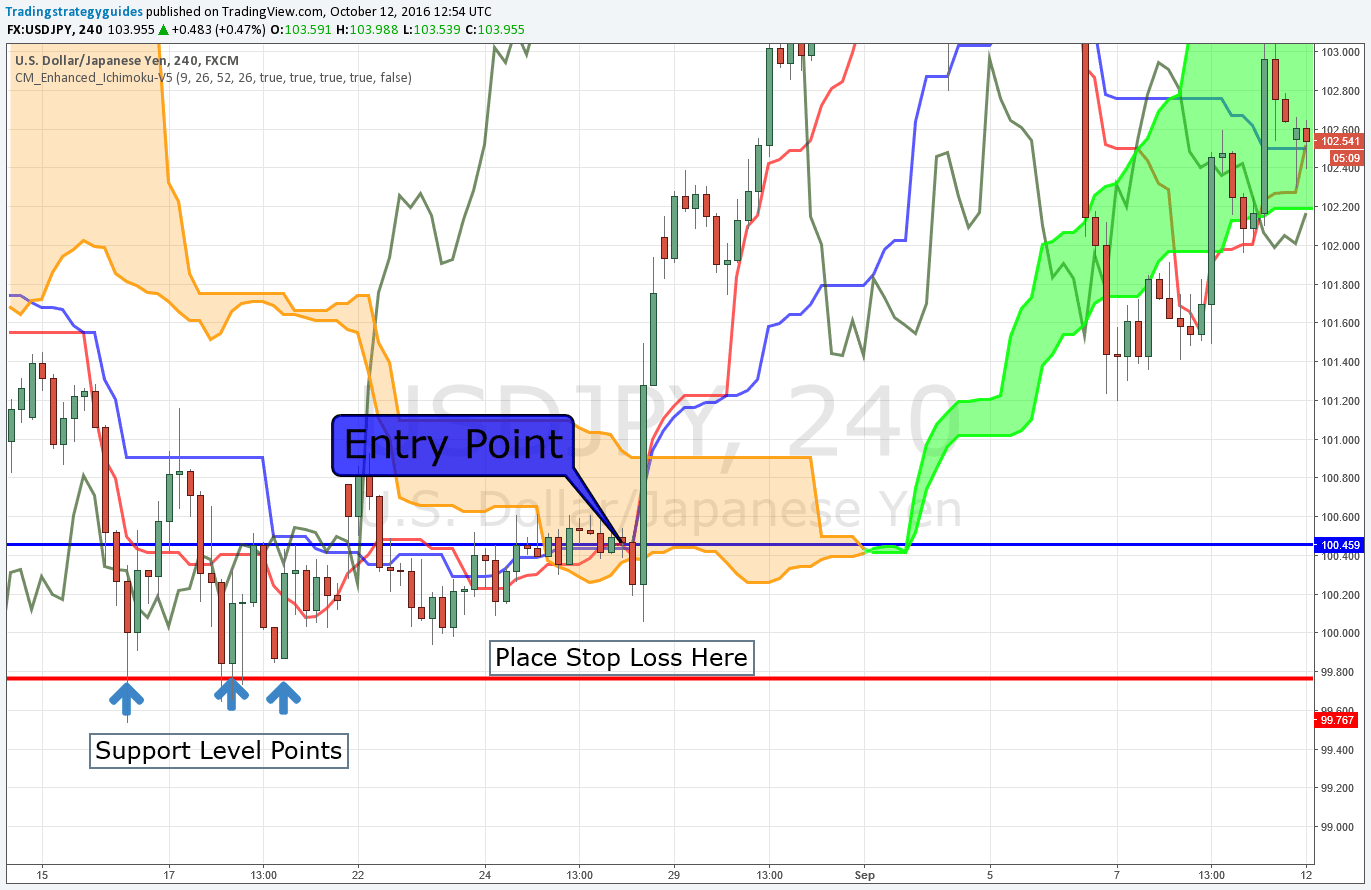
So, we need a stop loss to help us out. Do this on the 4-hour time chart to see when the last areas of support or resistance were.
There need to be two or more points of resistance or support. In the example below, you see that there were support levels. Now, in this example, it will go just below them.
Step #5: Exit Strategy
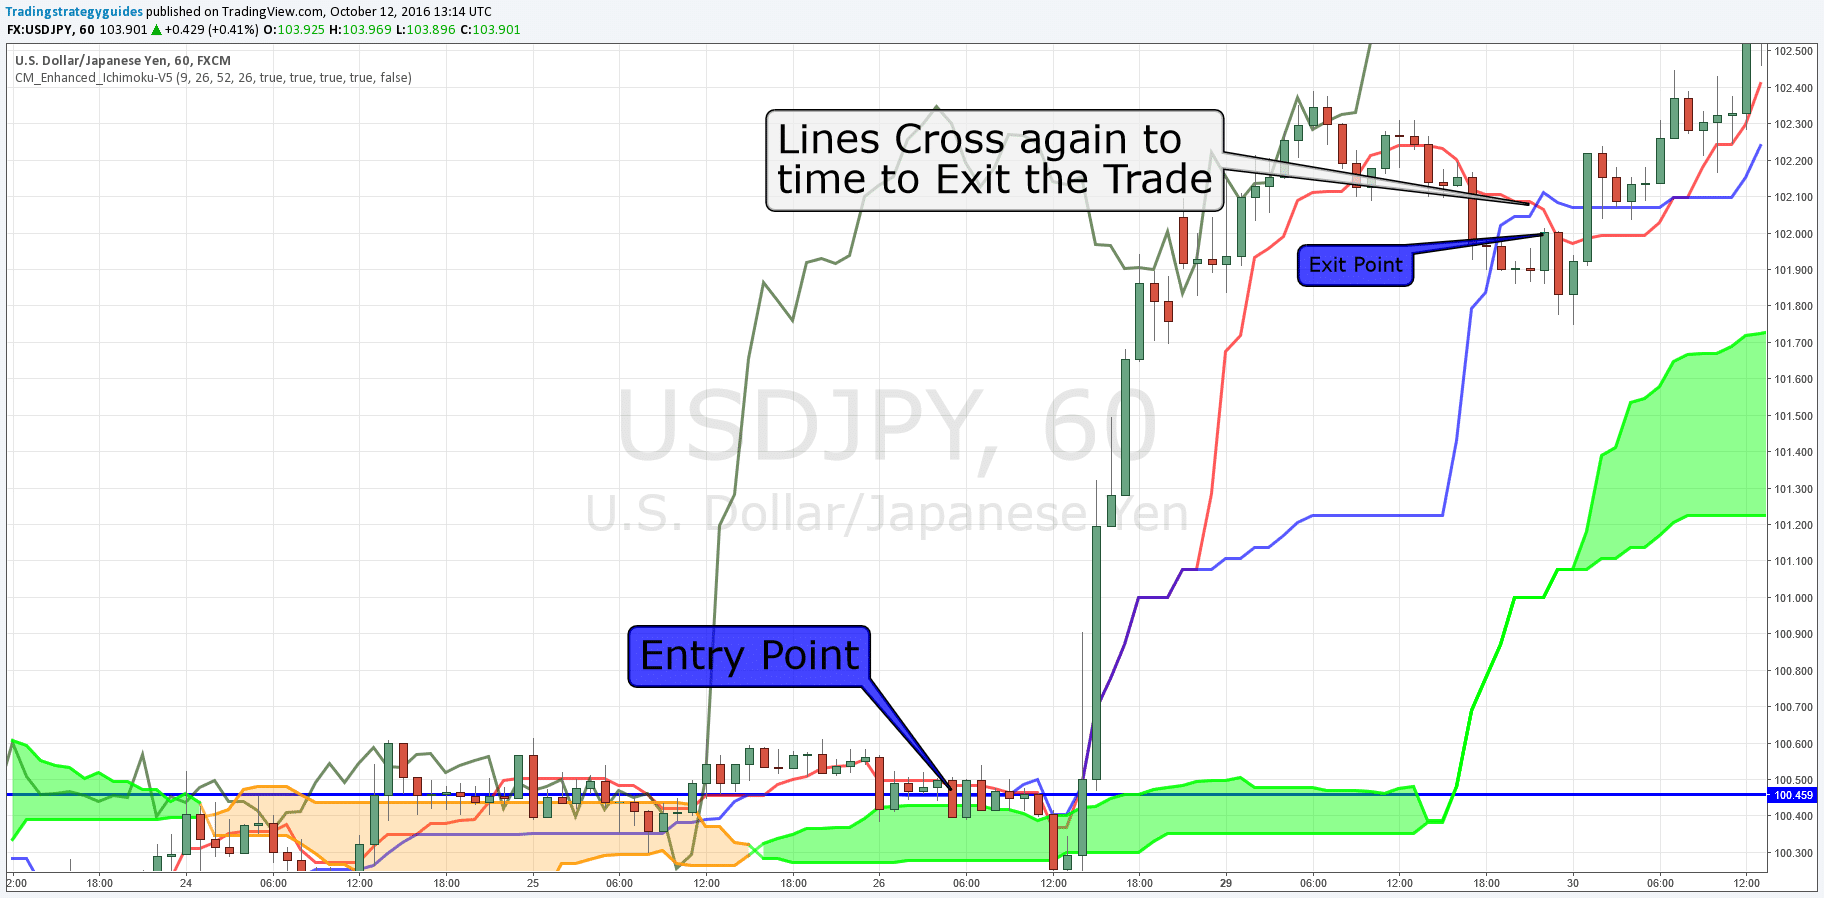
The exit strategy using the Trend Following Trading Strategy will wait until the trend starts moving in the wrong direction and the lines cross again. Monitoring this in the 1-hour time frame is recommended to get the most accurate reading for this particular strategy.
The reason for this is that the trend is most likely coming to an end. Moreover, the trend can come back down, but once the lines cross over again, it is time to exit the trade.
As you can see in the example, the trend was slowly going back down. In the rules of this strategy, you will exit the trade if the lines cross over again.
So, a trade maybe 2 hours, 10 hours, 3 days, or even a week! It depends on what the chart tells you and if it continues to follow the rules of the strategy.
Ichimoku Trend Following Trading Strategy Video
Conclusion: Ichimoku Trend Following Trading Strategy
The Ichimoku Trend Following Trading Strategy only uses this one indicator. That makes you focus on this indicator and does not make you keep checking others to see what they are telling you.
It may initially seem complicated with all the different colored lines, clouds, and so on. However, when you break it down with this simple strategy, it makes it so much easier to understand.
Make sure you remember to risk no more than 2% of your account! No matter how confident you are, you should always follow this to maximize your account.
Also, feel free to read my personal trading plan reviewed by Kimm Krompass.
Thank you for reading the Trend Following Trading Strategy that uses the Ichimoku Indicator to help you gain a massive amount of pips at a time!
Please leave a comment below if you have any questions about this Trend Following Trading Strategy!
Check Out This A Special Offer For Our Premium Ichimoku Course

Enjoy
90% Off
Ichimoku Ninjas Premium Course
Ichimoku Trading Strategy PDF Download
If you found this strategy intriguing, then I am offering you something very special.
Here’s a complete, FREE Ichimoku Cloud Strategy PDF report on this strategy. This will include a more detailed approach and information and a vast amount of examples.

Go ahead and check it now while it is completely free. This is to complete the Ichimoku trading system package.
Trend Following Trading Strategy Info-graphic Download
Please share this trading strategy below and keep it for your own personalized trading strategy! Thanks, traders!





whether this strategy is also works in equity shares?
Sure does!
Hi ! Can we use this strategy for crypto currency.
Yes, you sure can!
I have concerns about intraday trading because of hours required every day. Can “Trend Following Strategy” be used for swing trading where it is not necessary to stayed glued to the screen? Thanks.
I was recommended this website by my cousin. I am not sure whether this post is written by him as no one else know such detailed about my problem. You are incredible! Thanks!
Thank you for providing me with these article examples. May I ask you a question?
Hey There. I found your blog using msn. This is a very well written article. I will make sure to bookmark it and come back to read more of your useful information. Thanks for the post. I will definitely return.