Parabolic SAR Moving Average Strategy — Win More Trades With This Profitable Reversal Technique

In this article, you are going to read about the Parabolic SAR Moving Average Strategy that teaches you how to use a parabolic SAR (Stop And Reversal) indicator, along with two moving average trading strategies to catch new trends on the reversal. This moving average and Parabolic SAR trading strategy will show you how to use the parabolic SAR indicator effectively and how you can add this trading system to your daily trading techniques.
The Parabolic SAR (PSAR) is an indicator favored by technical traders that captures reversal signals. The Parabolic SAR (Stop and Reverse) was developed by J. Wells Wilder. Wilder was a mechanical engineer best known for his technical analysis developments. He has also developed the DMI (Directional Movement Index), the RSI (Relative Strength Index), and other indicators dear to technical analysts today.
Hopefully, by the end of the article, you will have the right parabolic trend formula, learn what a crossover is, find out buy signals, the best moving average crossover for swing trading, best moving average crossover for day trading, and the best moving average crossover for scalpers. Also, read the hidden secrets of moving average.
Parabolic SAR Moving Average Strategy — Greatest Reversal Trading Strategy
The strategy uses a dynamic trading tool that is used by many professional traders of every market (Forex, Stocks, Options, Futures). It is best used when the market is trending. If the market is choppy, the market is moving sideways, this tool does not particularly work at its best. Take a look at the Rabbit Trail Strategy if you are interested in trading sideways markets.
This was developed by Welles Wilder when he introduced this into his book in 1978 that was titled, “New Concepts in Technical Trading Systems.”
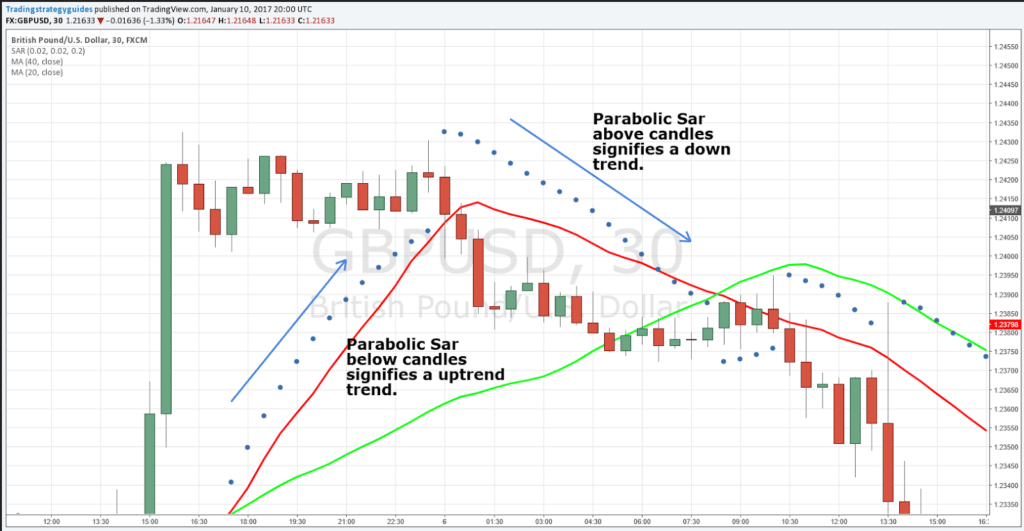
What this tool basically does is helps traders determine when the current trend will end, or when it is about to end. The way it shows you this is by placing dots that show up above or below the price candle. They appear above or below the current candle for a specific reason. If the dot is above the candle it will be a SELL signal or downtrend.
However, if the dot is below the candle this can be a signal to BUY or an uptrend. When the change occurs (the dot goes from below to above the next candle) this indicates a potential price reversal may be happening.
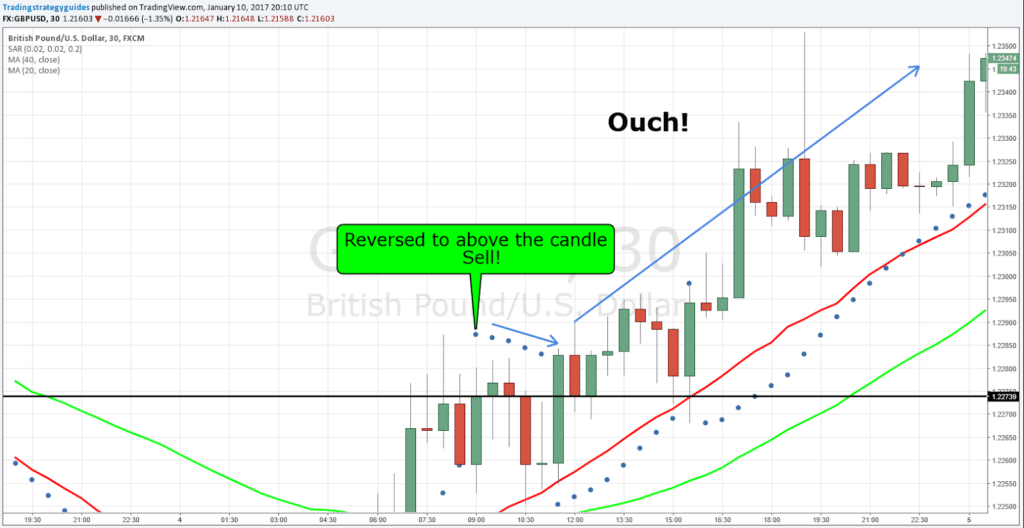
Some may think why not just trade the dots? When it reverses, just make an entry at that price. Technically you could, trade a reversal trading strategy like this and might win some, but this is a very risky way to trade the parabolic SAR indicator. Your results would probably be too inconsistent. You need other tools to validate a reversal trading strategy.
As you can see above, if you simply just trade the dots this will frequently happen.
This is why we use the parabolic SAR indicator and two moving averages to determine an entry point. The parabolic SAR moving average strategy will help verify that a reversal is in fact occurring. Here is another strategy called The PPG Forex Trading Strategy.
The combination of these indicators will give you accurate trend reversal setups.
This strategy can be used on any time frame on your chart. So day traders, swing traders, and scalpers are all welcome to use this type of strategy.
Here are the indicators you need to apply on your chart to use this trading strategy:
- Parabolic Sar strategy: Default Settings
- 40 Length Moving Average= Green color in our example
- 20 Length Moving Average= Red color in our example
What does the Parabolic SAR Indicator calculate?
The parabolic SAR indicator is used to track price changes and trend reversals over time. In order to calculate today’s Parabolic SAR, you will need to know the most extreme price (EP), the acceleration factor (AF), as well as the most recent PSAR. You will also need to determine whether there is currently an uptrend or a downtrend.
In simple terms, if the pair is trading under the PSAR you should sell. If the pair is trading above the PSAR you should buy. There are many ways to trade this indicator. You can trade it with additional indicators or on multiple/different time frames. Nathan Tucci wrote an article in May 2012 that illustrates how the PSAR can be incorporated into a trading strategy. See that article by clicking here and his Forex Trading System article by clicking here. You can also simply trade the Parabolic SAR for longer terms, trending pairs. For example, let me show you this EUR/USD daily chart:
The “extreme price” will either be the highest high or the lowest low that has occurred within the relevant period. Every time a new EP is established, the trend will be updated. The acceleration factor (which begins at 0.02) will increase by 0.02 for each of the first ten times that the EP has been updated (creating a functional AF “ceiling” of 0.20).
The Parabolic SAR (PSAR) calculation is:
- PSAR= Prior PSAR + Prior AF (Prior EP – Prior PSAR); for uptrends
- PSAR= Prior PSAR –Prior AF (Prior PSAR – Prior EP) for downtrends
The difference between the uptrend and downtrend formula is whether the second part of the formula is added or subtracted. It’s important to note, without properly identifying the direction of the current trend, your PSAR calculations will be moving in the wrong direction.
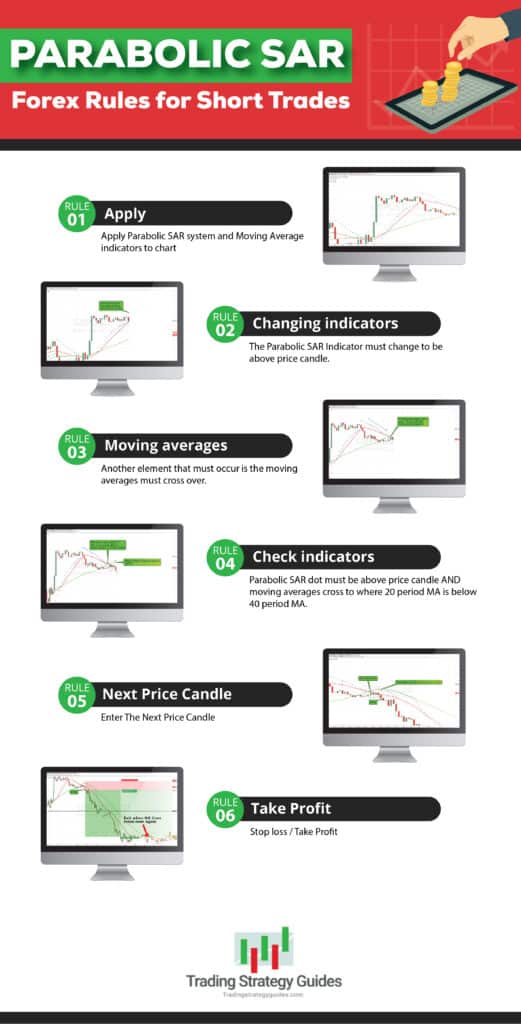
Parabolic SAR Forex Rules for Short Trades
Rule #1 — Apply Parabolic SAR system and Moving Average indicators to chart
You can choose different colors for the moving averages. The 20 period moving average is Red and the 40-period moving average is Green in this example.
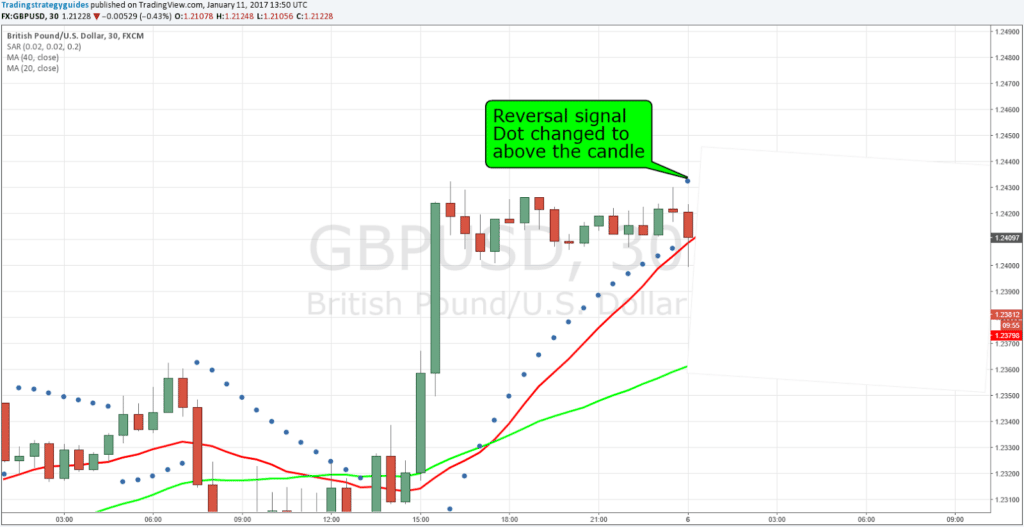
Rule #2 — The Parabolic SAR Indicator must change to be above price candle.
Notice how the dots were below the price. The parabolic stop and reversal (SAR) formula showed us that the price stalled out for a few hours and then the dot appeared above the candle.
This is a sign that a reversal may be forming.
Like what you are reading so far?
Why Not Grab the Free Parabolic SAR full Report 100% free! Click here to Get the strategy guide PDF report now
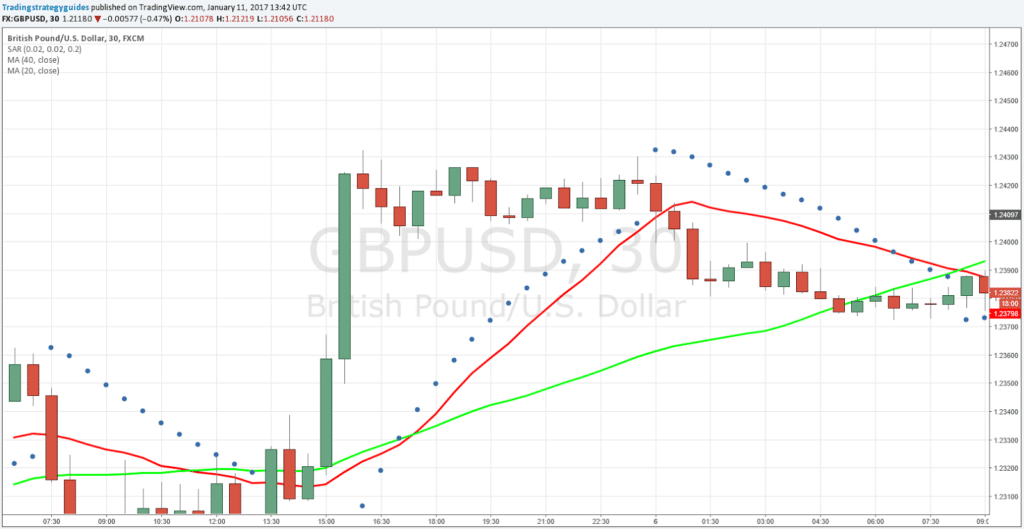
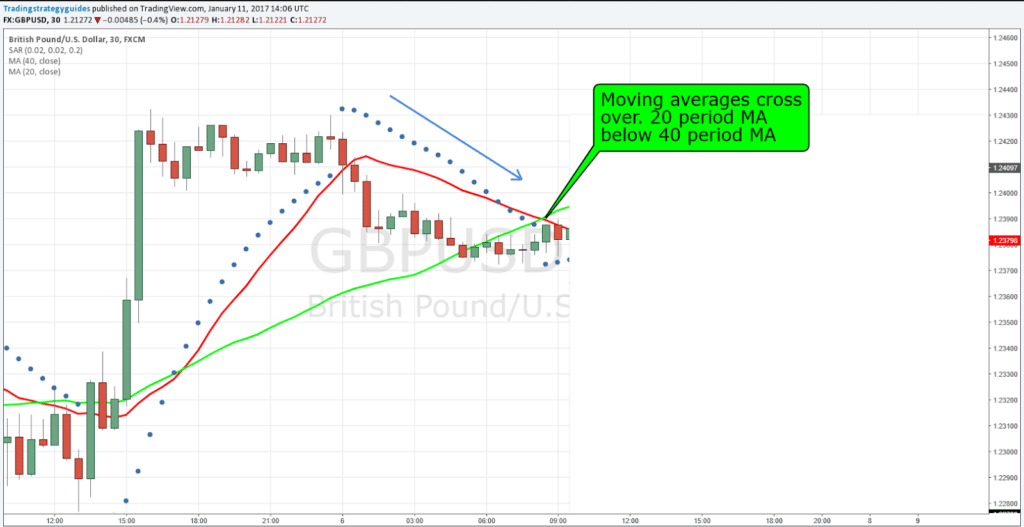
Rule #3 — Another element that must occur is the moving averages must cross over.
In a short trade, the 20 period moving average will cross and go below the 40 periods moving average.
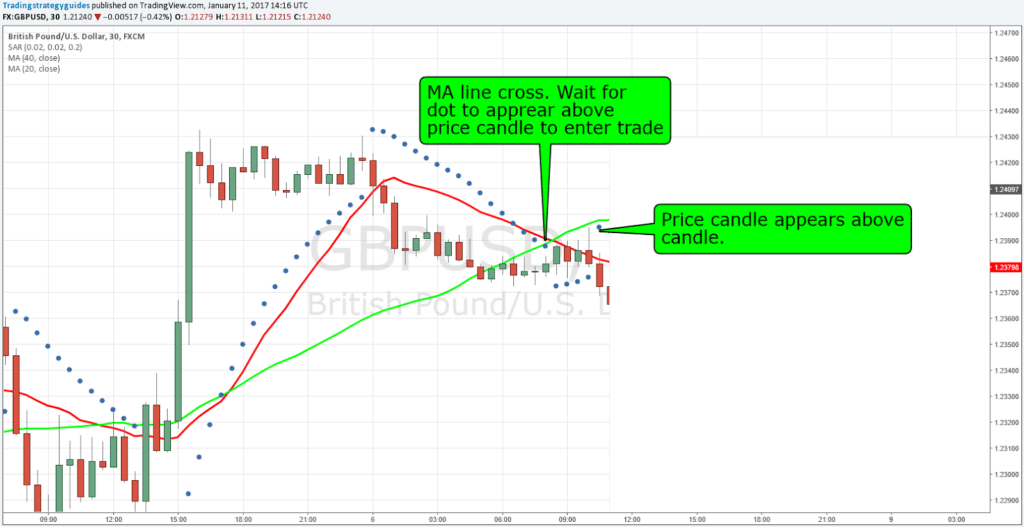
So now the 20 period moving average is below the 40 period moving average. However, something occurred that is notable. The dot then appeared below the price candle.
Since the moving averages are telling us that a downtrend is most likely going to occur, we will wait until the dot appears again above price candle to validate this reversal and enter a trade.
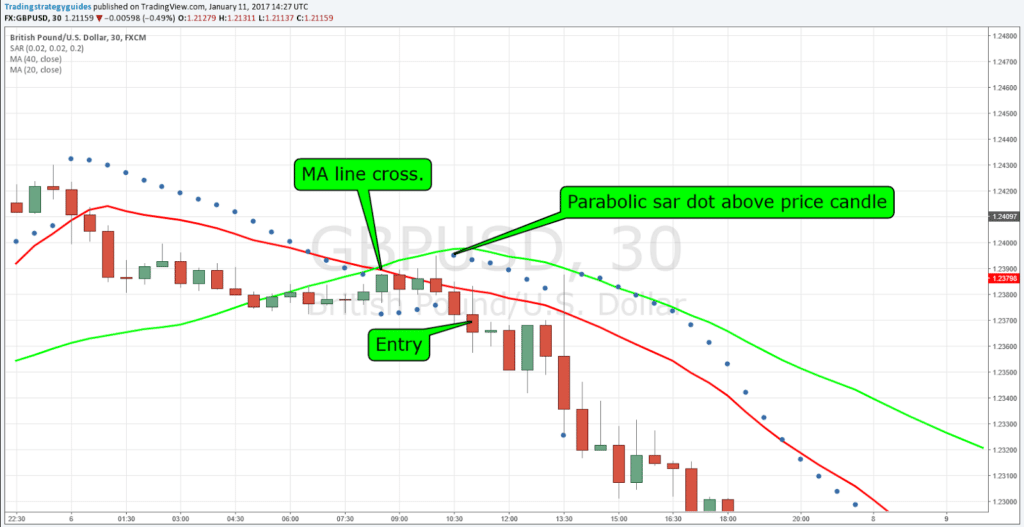
Rule #4 — Parabolic SAR dot must be above price candle AND moving averages cross to where 20 period MA is below 40 period MA.
Note** One of these elements may occur before the other. The reversal dot can appear before the MA lines cross. Or the Moving averages can cross before the reversal candle. As long as there are both elements, the entry criteria are met.
Rule #5 — Enter The Next Price Candle…
Enter (SELL) the very next price candle after the dot appears above the candle. You can see on our chart where we entered the trade. Waiting for one candle after makes sense because this proves to us that this reversal is strong. The moving averages are supporting the downtrend + the dot is signifying a downtrend.
Rule #6 — Stop loss / Take Profit
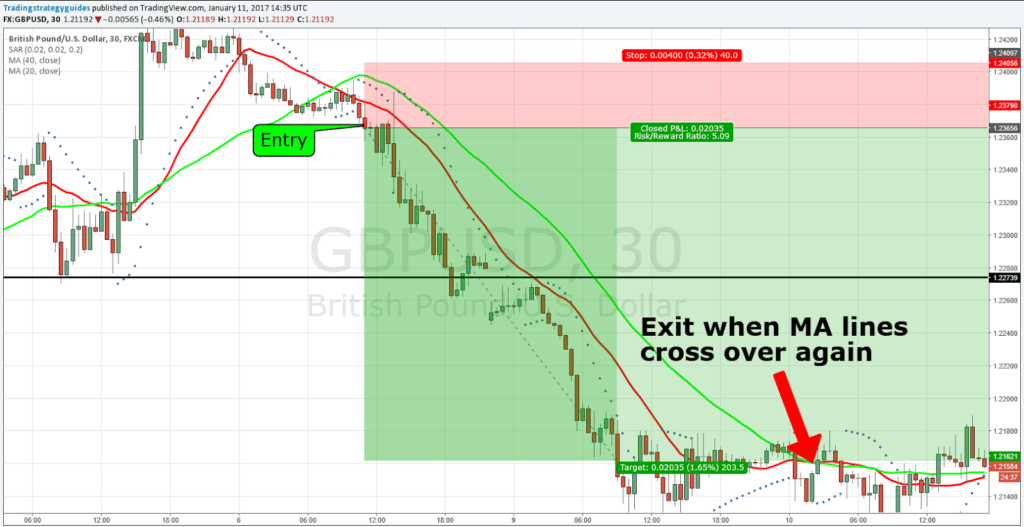
The stop loss you will place 30-50 pips away from your entry. Always look for prior resistance or support to determine a stop loss. In our example, a stop loss was placed 40 pips from entry.
Your exit criteria are when the 20 and 40-period lines cross over again. OR when the dot reverses appears at the bottom of the candle.
This trade would have been a +203 pip profit using the MA cross exit approach. Not too bad.
Some will get out of the trade when the dot appears below the price candle. If that was the case, in this example, you would have got +32 pips instead. Still not bad, but +203 pips sounds a lot better.
So basically you can use either exit strategy. This trade the downtrend was very strong so we stayed in until the MA lines cross. Determine where you are in a trade. If you are up +100 pips and the dot changes to reversal consider getting out then and taking your profit.
Note** Scalpers should not be using a 30 to 50 pip stop with this strategy. Consider your rules and adjust accordingly. A 5-10 pip stop may be more appropriate on that low of a time frame. If you like this strategy and have a stop you think works best, leave us a comment below and tell us what you think!
Rules for Long Entry.
Rule #1- Apply indicators to chart
Rule #2- Dot must change to be below price candle. This is a sign that a reversal may be happening.
Rule #3– Another element that must occur is the moving averages must cross over.
In a long trade, the 40 period moving average will cross and go below the 20 period moving average.
Rule #4- Dot must be below price candle AND moving averages cross to where 20 period MA is above 40 period MA.
Note** One of these elements may occur before the other. The reversal dot can appear before the MA lines cross. Or the Moving averages can cross before the reversal candle. As long as we have both elements the entry criteria is met.
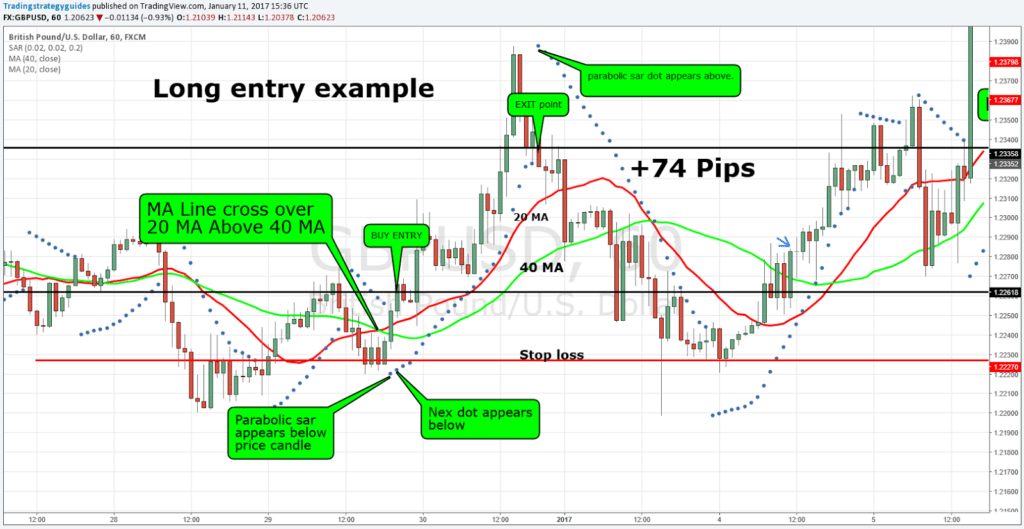
Rule #5- Enter Next Price Candle. Enter the very next price candle after the dot appears below candle + MA lines cross and 20 period MA is above 40 period.
Rule #6- Stop loss / Take Profit
The stop loss you will place 30-50 pips away from your entry. Always look for prior resistance or support to determine a stop loss.
Your exit criteria in the example below were when the dot appeared above the candle.
This would have been a nice +74 pip profit trade using this strategy.
Conclusion
As stated the Parabolic SAR Moving Average Strategy can be used with any time frame. However, you should always check different time frames and look at what the market is currently doing. No strategy can give you a 100% win ratio so always be placing your stops at the appropriate areas. I would recommend practicing both short and long trades with this moving average trading strategy.
Thank you for reading!
Please leave a comment below if you have any questions about Parabolic SAR Moving Average Strategy!
Also, please give this strategy a 5 star if you enjoyed it!
[ratings]
Like this Strategy? Grab the Free PDF Strategy Report that includes other helpful information like more details, more chart images, and many other examples of this strategy in action!
Tap on the E-Book Cover Below to get your copy of this Free strategy today.
Please Share this Parabolic SAR Trading Strategy Below and keep it for your own personal use! Thanks Traders!






Excelente artículo, lo probaré. Bendiciones.
Looks like a good strategy. Will give it a try.
Thank you guys for these good strategies…so once i make say a sell entry and the dot appears below the candle but the the 20MA is still below the 40MA can i still ride comfortably in the trade if i want to push my winners???
very very thanks sir iam happy
Glad to help!
Thanks for this interesting Strategy. I will try it very soon.
Best Regards
Let us know your results! Thanks!
Hey Guys thanks for the good strategies and the explanations it is very helpful to the struggling traders out here
That is our goal. Thanks for the positive response!
Hi great information on parabolic SAR. So where do I get the tool on my trading platform which is Metatrader 4.??
The Parabolic SAR tool comes standard with the MT4 platform. Do a quick search in the indicators section and you should find it there.
Which time frame is the best to use with this parabolic strategy?
I personally like using this strategy with the one hour chart. If you go down to even a one minute chart, however, you will see that there trade opportunities everywhere as well. They are much quicker trade and you will want to have a smaller stop loss than a 30-50 pip stop.
Hi,
Is it possible to send you a picture of a chart?
Yes, if you are having questions and need us to clarify, email us at info@tradingstrategyguides.com
Its not possible to keep an eye on stocks all the day.
Is there any way from where I can get list of stocks that have crossed EMA20 and EMA40.
I personally love trailing stops as once I am in the money I hate to lose it. I have a hard time using and trusting the higher time frames because of this. The lower charts are more for the newbies thou in my opinion as scalping is way more profitable. Swing trading to me is for those that can afford big loses and don’t want to be on their computer all the time. Very profitable if once again you have an 80% win rate and keep to a decent stop loss.Trading this way should be your goal. Its also very smart of you to demo until you have achieved an 80% win loss record and are always putting in a correct stop loss. Congrats for taking the best first step…demoing. If you do these two things you will beat the market in time, if you are not doing stop losses, you seriously should shut shop, not kidding, exception, your a great trader that knows how to hedge. Do not let a streak interfere with your trading, you will lose your account. I had 50 great trades in a row and then BAM one losing trade with no stop loss just hoping the market would turn around. Lost my account. Now for my trailing stop strategy. Whatever your lot size, multiply by 10 and at 3X that size take a 1.5 pip trail stop. If you get to 1.5 X that then go up on your trail stop by .5 or a 2 pip trail stop. Hopefully you can get a huge trail stop built up and really make some money on one trade. I wouldn’t let the trail stop go below the 20 MA, certainly not the 40 MA. So to simplify on a 10K account you would use a lot size of 1. 1 X 10 = $10 X 3 = $30 put in your 1.5 trail stop. $30 X 1.5 = $45 raise to a 2 pip trail stop. At $60 raise to a 2.5 trail stop……. Good luck. Following this you will guarantee yourself a lot of small gains and often end up with a few huge gains, with very few loses following Trading strategy Guides strategies and using trail stops. This is by far my favorite and most recommended strategy to use.
lol 80% win rate