Best Stochastic Trading Strategy: Day Trade 15M Stochastics
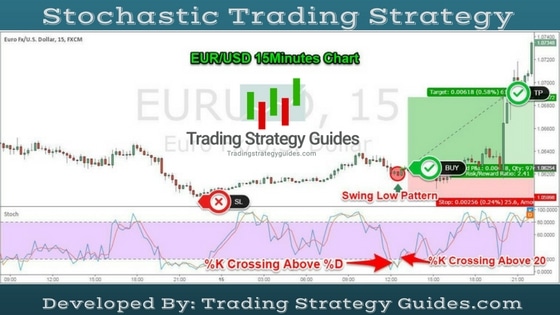
Day trading with the best Stochastic Trading Strategy is what we’ll discuss today. As the name suggests, this is a stochastic strategy suitable for day traders. The stochastic strategy is similar to the Day Trading Price Action – Simple Price Action Strategy.
The only difference this time around is that we incorporate a technical indicator into this strategy. Namely, the stochastic indicator. This is the best Stochastic trading strategy because you can identify market turning points with accurate precision.
Warning! This can turn you into a modern sniper elite trader. The Stochastic indicator will only make you pull the trigger at the right time. A modern sniper elite trader only pulls the trigger on a trade when he is certain he can pull a winning trade.
Our team at Trading Strategy Guides is developing the most comprehensive library of Forex trading strategies. Our goal is to help turn your trading around.
Our favorite time frame for the Best Stochastic Trading Strategy is the 15-minute chart. This is because we have taken the time to backtest the best Stochastic Trading Strategy.
We also tested the 15-minute TF over and over again. If you’re a day trader, this is the perfect strategy for you. The stochastic strategy evolved into being one of the best stochastic strategies.
Despite the stochastic indicator being a very popular indicator among traders, they have been using it the wrong way. Our team at Trading Strategy Guides.com interprets the charts and the indicators in an unorthodox way. At the same time, it’s very productive.
Day trading might not be your thing, but perhaps you’re interested in trading on higher time frames, like the daily chart. Don’t panic! We have your back. Our favorite MACD Trend Following Strategy is the best trend-following strategy. For every Forex strategy, we make sure we leave our own signature and make it simply the best. You can also read our best Gann Fan Trading Strategy.
Now…
Before we move forward, we must define the indicators you need for day trading with the best Stochastic Trading Strategy and how to use stochastic indicator.
The only indicator you need is the:
Stochastic Indicator: This technical indicator was developed by George Lane more than 50 years ago. There is a reason why this oscillator survived for so many years.
It is because it continues to show consistent signals even in these current times.
Without further ado, let’s move straight to the point and:
- Define what the Stochastic indicator is;
- How to use Stochastic indicator;
- What are the Stochastic indicator settings;
What is the Stochastic Indicator – Explained for Beginners
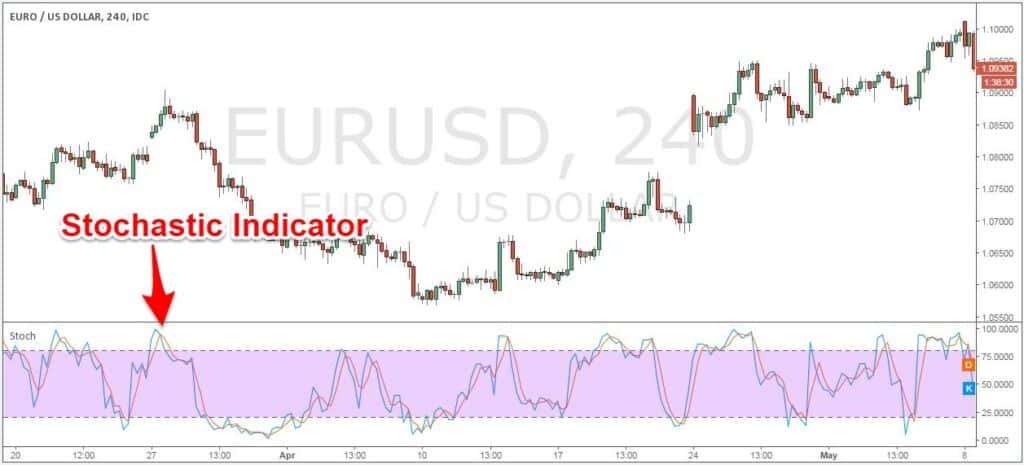
The Stochastic indicator is a momentum indicator that shows you how strong or weak the current trend is. It helps you identify overbought and oversold market conditions within a trend. The stochastic indicator should be easily located on most trading platforms.
The Stochastic indicator looks like this:
After extensive research and backtesting, we’ve found that this indicator is more suitable for day trading. Indicators, like the MACD indicator, are more suitable for swing trading. You should really check out our amazing MACD Trend Following Strategy. We decided to share this with our trading community recently.
Another reputable oscillator is the RSI indicator, which is similar to the Stochastic indicator. We chose it over the RSI indicator because the Stochastic indicator puts more weight on the closing price. This is the most important price no matter what market you trade.
This strategy can also be used to day trade stochastics with a high level of accuracy.
Does it make sense?
Then, let’s move on…
How to Trade Stochastic
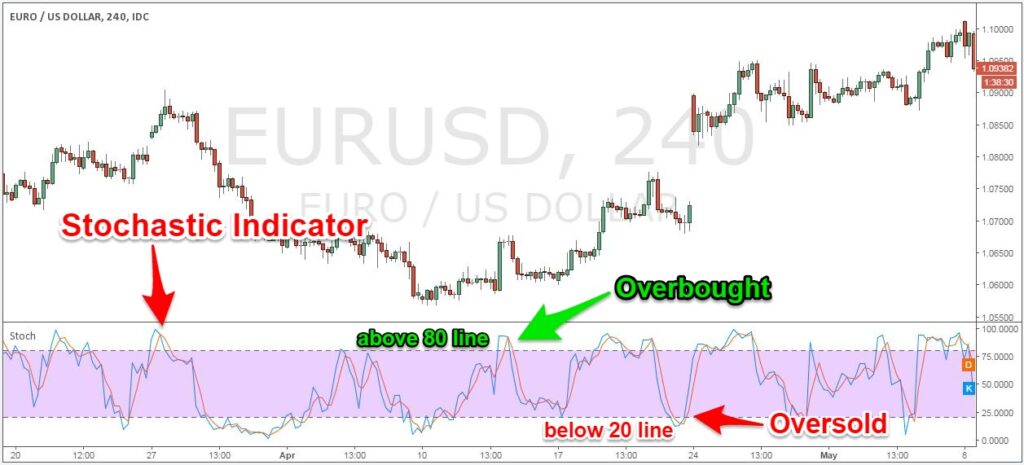
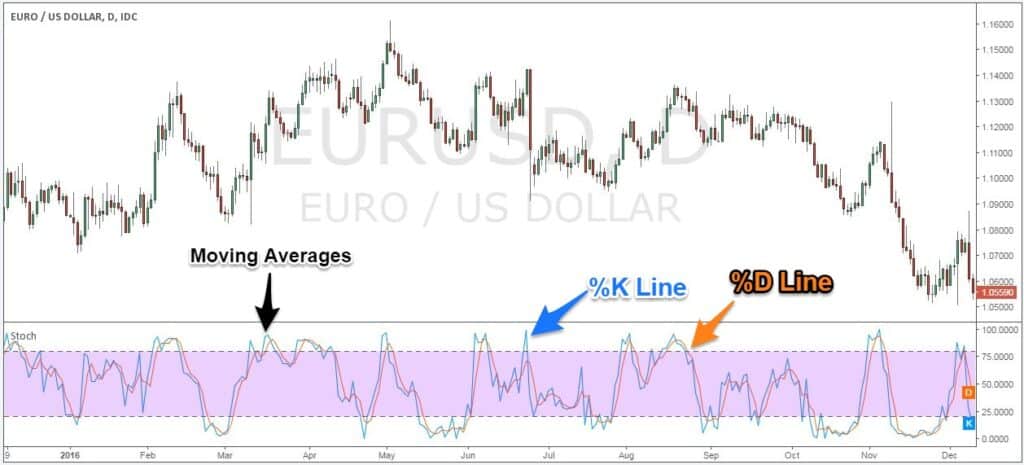
Let me just quickly tell you how to use the stochastic indicator and how to interpret the information given by this amazing tool so you can know what you’re trading. When the stochastic moving averages are above the 80 line, we’re in the overbought territory.
Conversely, when the stochastic moving averages are below the 20 line, we’re in oversold territory.
Please have a look at the chart example below to see how to use the stochastic indicator.
So, how does the stochastic indicator work?
See below:
What is the Formula for the Stochastic Oscillator?
The stochastic oscillator uses a quite complex mathematical formula to calculate simple moving averages:
%K = 100(C – L14)/(H14 – L14)
Where:
- C = the most recent closing price
- L14 = the low of the 14 previous trading sessions
- H14 = the highest price traded during the same 14-day period
- %K= the current market rate for the currency pair
- %D = 3-period moving average of %K
See below where to locate the %D and %K lines:
The mathematical formula behind this method works on the assumption that closing prices are more important in predicting oversold and overbought conditions in the market. Based on this assumption the Stochastic indicator works to give you the best trade signals you can possibly find.
Next…
Let’s see what are the right stochastic oscillator settings you can follow.
See below:
Best stochastic settings for 15 minute chart
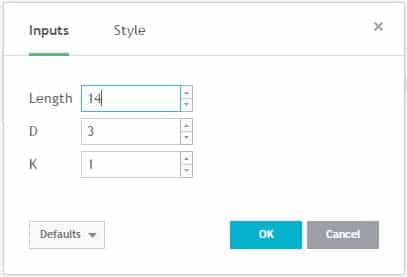
The default settings for the stochastic indicator are 13, 3, and 1.
As you can see below, we will select a length of 14 periods to start.
Now, before we go any further, we always recommend taking a piece of paper and a pen and writing down the rules.
Let’s get started…..
Day Trading Stochastics Strategy
(Rules for a Buy Trade)
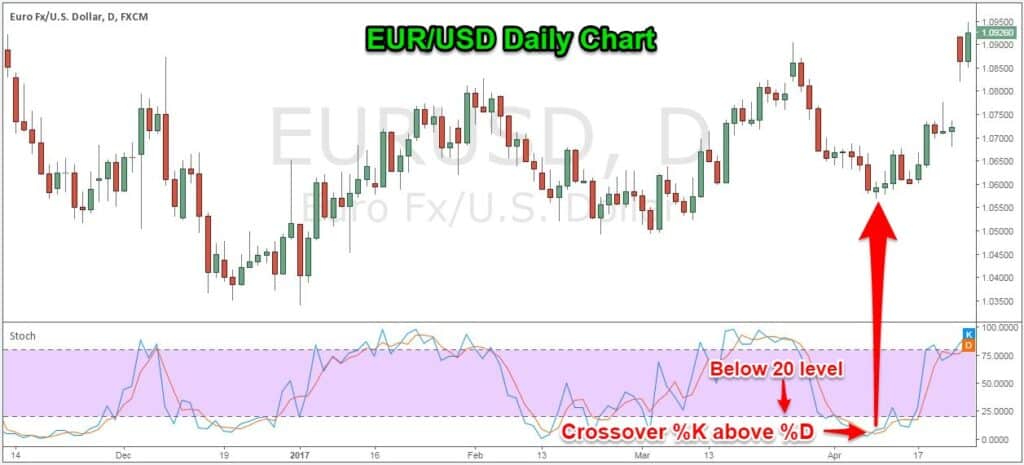
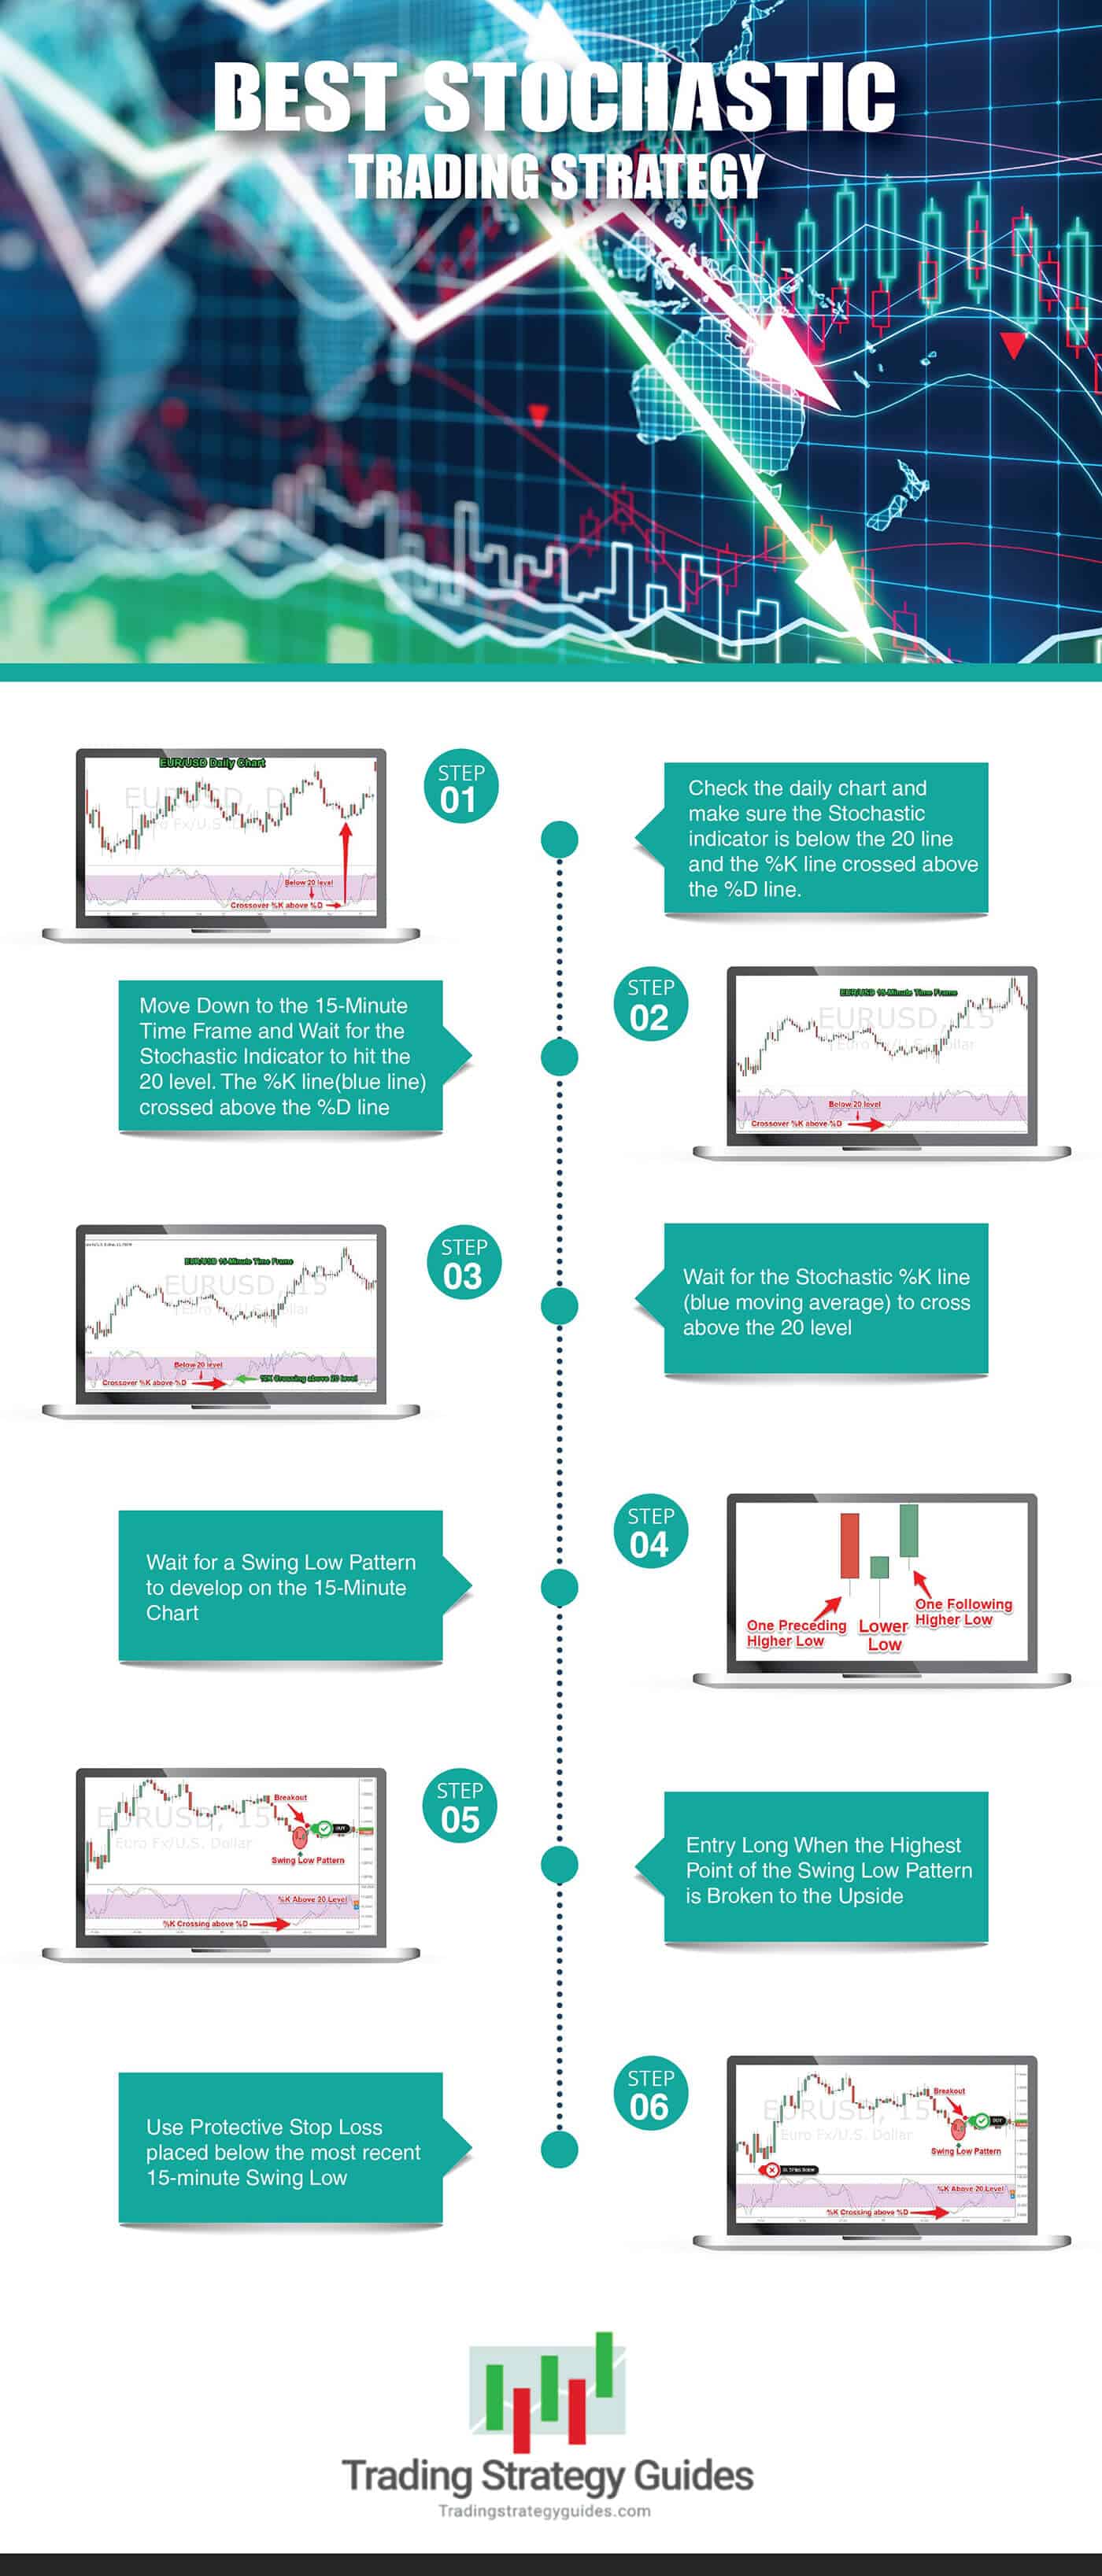
Step #1: Check the daily chart and make sure the Stochastic indicator is below the 20 line and the %K line crossed above the %D line.
We’re day trading, but having in mind the higher time frame sentiment and trend.
This is a crucial part of the strategy because we only want to be trading in the direction of the higher time frame trend. Our team at Trading Strategy Guides.com has put a great deal of time into developing the best guide to Trading Multiple Time Frames – The Key to Successful Trading. The multiple time frame concept is important because it can give you a more robust reading of the current price action and more it can help you better time your entry and exit points.
Note*: On the daily chart, it’s not necessarily for the stochastic moving averages to be below the 20 level. They can be moving away from the oversold territory and the signal can still be valid, but it shouldn’t be above 50 level.
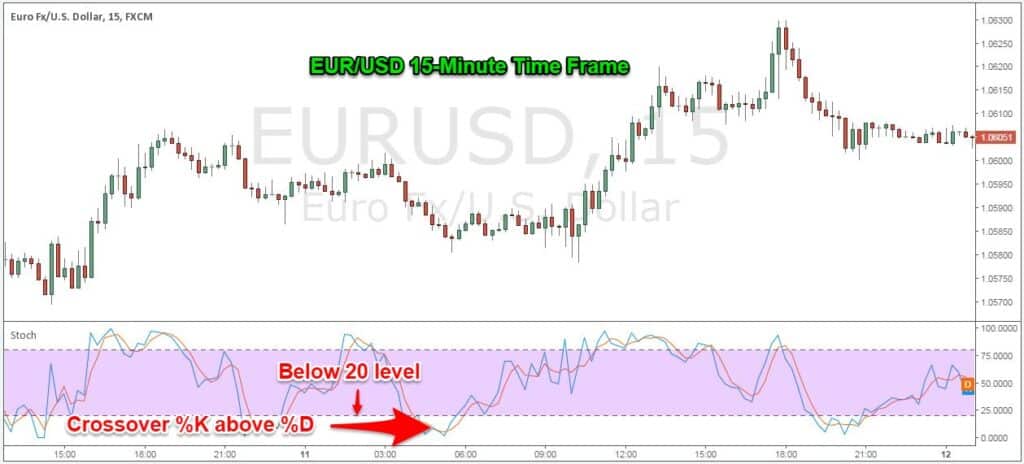
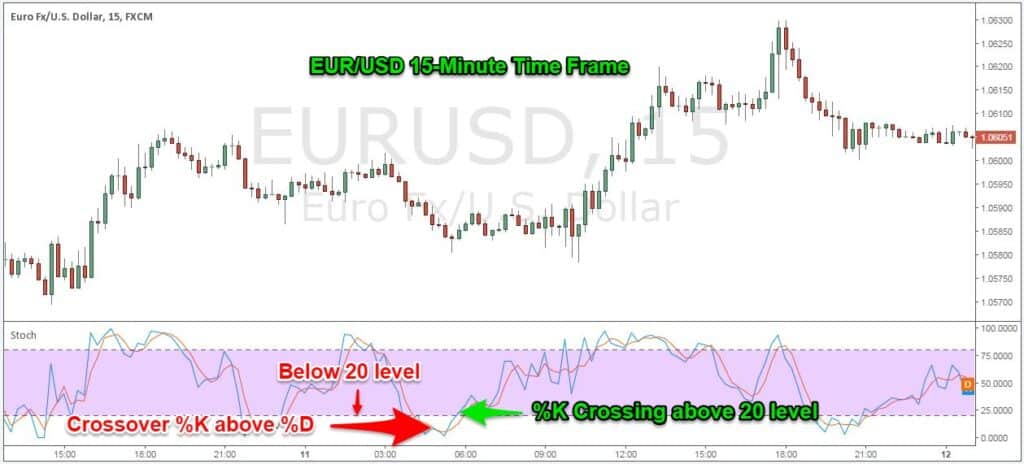
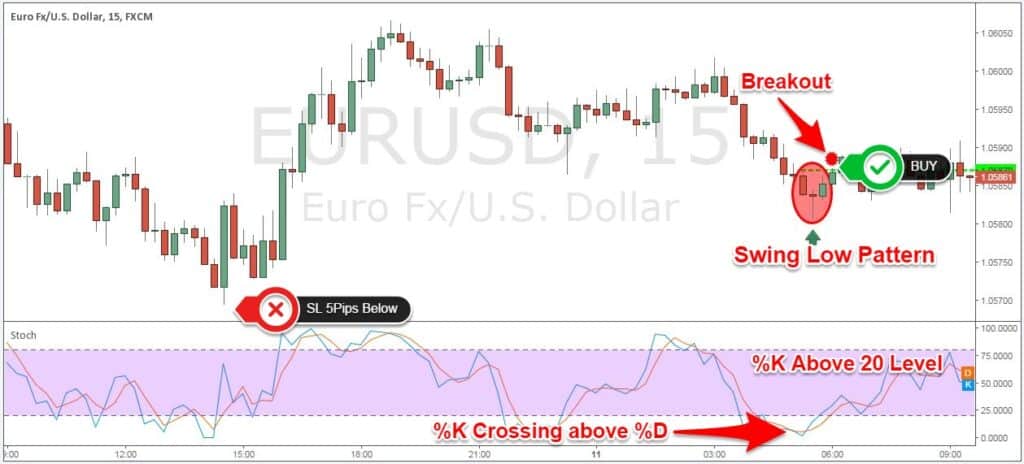
Step #2: Move Down to the 15-Minute Time Frame and Wait for the Stochastic Indicator to hit the 20 level. The %K line(blue line) crossed above the %D line(orange line).
This step is similar to the previous rule, but this time we apply the rules on the 15-minute time frame: wait for the Stochastic indicator to hit the 20 level and the %Kline (blue line) is crossing above the %D line (orange line).
The 15-minute chart is the best time frame for day trading because is not too fast and at the same time not too slow.
See figure below:
It is said that the market can stay in overbought and oversold condition longer than a trader can stay solvent. So we want to take precautionary measures, and this brings us to the next step on how to use the stochastic indicator.
Step #3: Wait for the Stochastic %K line (blue moving average) to cross above the 20 level
We want to trade smarter, right?
Well, because the %k is the fast-moving average it’s enough just to wait for it to cross above the 20 level because the %D line will follow suit. We don’t want to wait for too much either, as this will result in a reduced profit margin.
Right now is the time you should switch your focus to the price action, which brings us to the next step of the best stochastic trading strategy.
Step #4: Wait for a Swing Low Pattern to develop on the 15-Minute Chart
What is a Swing Low Pattern?
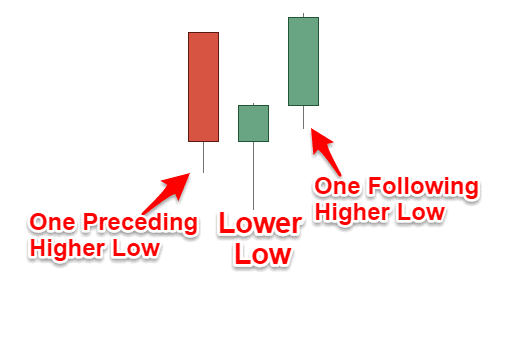
A Swing Low Pattern is a 3-bar pattern and is defined as a bar that has one preceding and one following bar with a higher low. Here is how to identify the right swing to boost your profit.
A visual representation of the Swing Low pattern can be seen below:
So far, so good, but still we haven’t answered the most important question that a trader has:
Day trading stochastics: When to Enter?
This brings us to the next rule of the Best Stochastic Trading Strategy.
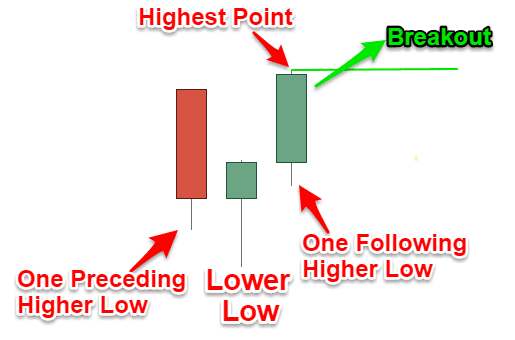
Step #5: Entry Long When the Highest Point of the Swing Low Pattern is Broken to the Upside
Nothing beats an illustration…
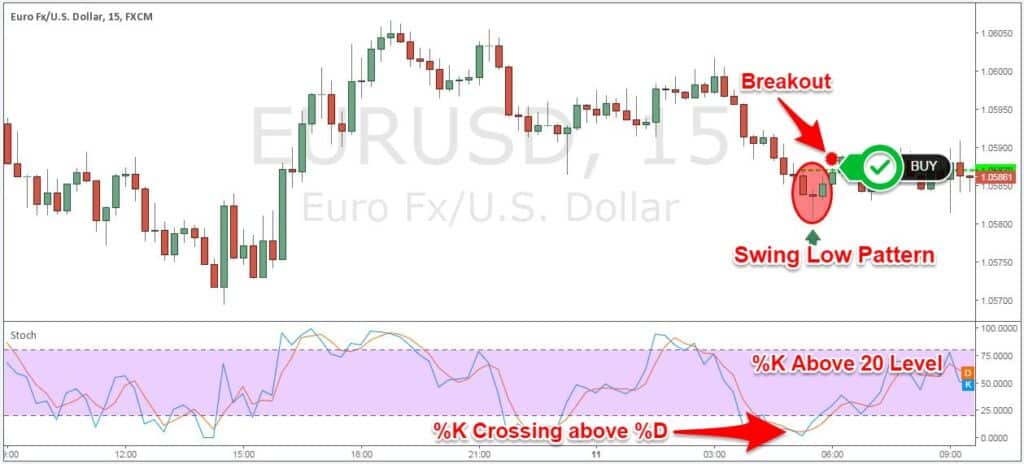
So, after following the rules of the Best Stochastic Trading Strategy, a buy signal is only triggered once a breakout of the Swing Low Patterns occurs.
Let’s turn our focus again to the EUR/USD 15-minute chart presented earlier and see how to use stochastic indicator in combination with the Swing Low Pattern.
See the chart below:
So at this point, your trade is running and in profit.
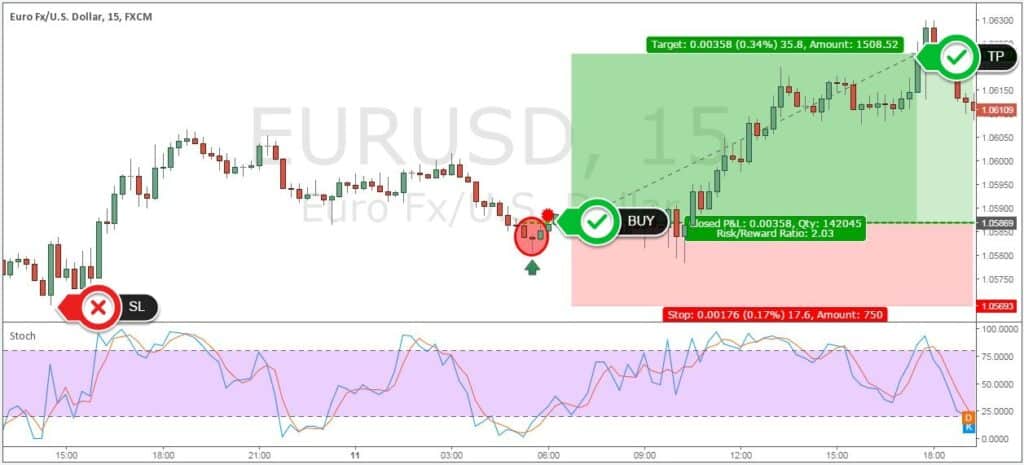
Step #6: Use Protective Stop Loss placed below the most recent 15-minute Swing Low
You want to place your stop loss below the most recent low, like in the figure below. But make sure you add a buffer of 5 pips away from the low, to protect yourself from possible false breakouts.
Step #6: Take Profit at 2xSL
Knowing when to take profit is as important as knowing when to enter a trade. The Best Stochastic Trading Strategy uses a static take profit, which is two times the amount of your stop loss.
See figure below:
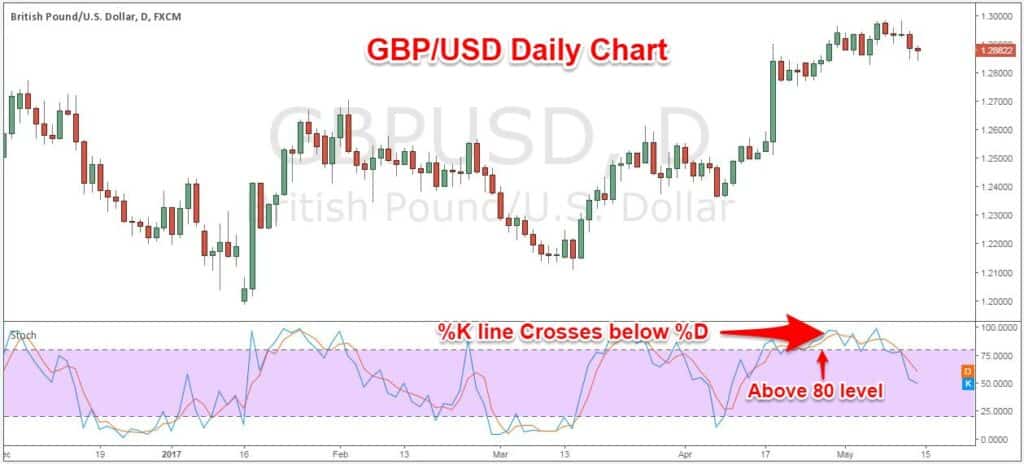
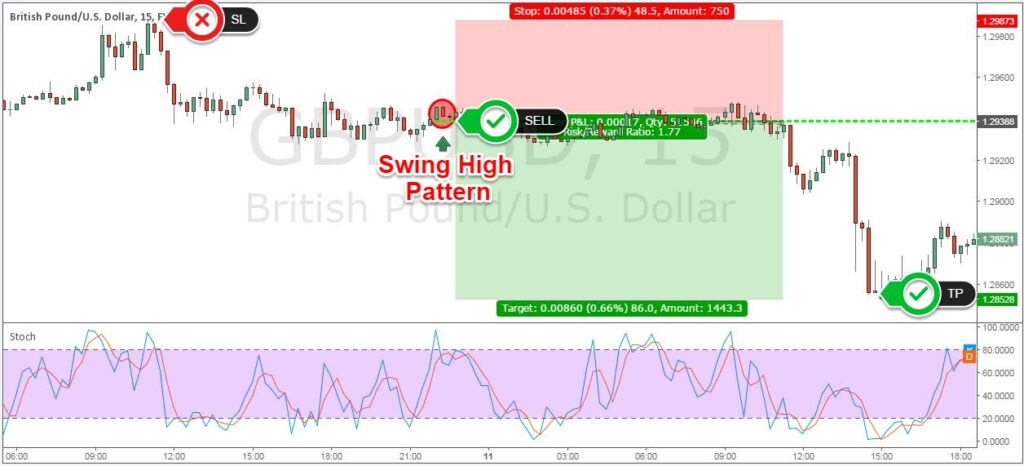
Note** The above was an example of a buy trade using the Day trading with the Best Stochastic Trading Strategy. Use the same rules – but in reverse – for a sell trade. In the figure below you can see an actual SELL trade example using the Best Stochastic Trading Strategy.
We’ve applied the same Step #1 through Step#4 to help us identify the SELL trade and followed Step #5 to trigger our trade (see next figure).
Conclusion — Best Stochastic Trading Strategy:
Day trading with the Best Stochastic Trading Strategy is the perfect combination of how to correctly use stochastic indicators and price action. The success of the Best Stochastic Trading Strategy is derived from knowing how to read a technical indicator correctly and at the same time make use of the price action as well. We also have training for the best short-term trading strategy.
Our team at Trading Strategy Guides.com doesn’t claim to be perfect, but we have a solid understanding of how the market works. For those of you who are not fans of lower time frames, we recommend the “Fibonacci Retracement Channel Trading Strategy” which can be more suitable for your trading style.
Thank you for reading!
Please leave a comment below if you have any questions about the Stochastic Trading Strategy!
Day Trade Stochastics Video
Here is a quick video of the strategy:
Best Day Trading Stochastics Strategy PDF
Please Share this Trading Strategy Below and keep it for your own personal use! Thanks Traders!
Frequently Asked Questions
What is the best stochastic setting for a 1-minute chart?
Common settings for trading stochastics on the 1-minute chart are 5,3,3. Remember, the lower the time frame the less precise the signals are going to be. Always be cautious when trading on low time frames. And always be sure to back test those setting before trading on live accounts!
What is the stochastic indicator and how does it work?
A stochastic indicator is a momentum-based technical analysis tool that compares the current closing price to a range of prices over a specific time frame to determine if the asset is overbought or oversold. It can help traders identify potential trend reversals and market momentum shifts.
What are the best settings for the stochastic indicator for different time frames?
See below for some common settings:
5-minute chart: 8, 3, 3
15-minute chart: 14, 3, 3
30-minute chart: 20, 5, 5
1-hour chart: 9, 3, 3
4-hour chart: 14, 3, 3
Daily chart: 5, 3, 3
REMEMBER!!!! Always backtest the settings before trading on a live account.
How can I use the stochastic indicator to identify potential buy and sell signals in the market?
Buy Signal: When the %K line crosses above the %D line into oversold territory.
Sell Signal: When the %K line crosses below the %D line into overbought territory.
Can the stochastic indicator be used for day trading or swing trading, or is it better suited for longer-term trading?
The stochastic indicator can be used for different trading styles, including day trading, swing trading, and longer-term trading. However, it’s important to adjust the settings and use them in conjunction with other technical analysis tools based on your desired trading style and market conditions.
How reliable is the stochastic indicator in predicting market trends and momentum shifts?
The stochastic indicator is just one tool in a trader’s toolbox and should be used in conjunction with other technical and fundamental analysis methods. While it can provide valuable insights into market momentum and potential trend reversals, it’s important to keep in mind that no indicator or trading strategy is 100% reliable.
How can I incorporate risk management techniques into my stochastic trading strategy to minimize potential losses?
You can incorporate risk management techniques, such as using stop-loss orders and setting risk-reward ratios, into your stochastic trading strategy to minimize potential losses and maximize profits. Also, never trade more than you can afford to lose!
Are there any recommended resources or courses I can take to learn more about using the stochastic indicator and other trading strategies?
There are many resources and courses available for traders to learn more about using the stochastic indicator and other trading strategies, such as online forums, educational websites, and paid courses. It’s important to do research and choose reputable sources to ensure high-quality education. If you are interested in learning more about trading check out What is Trading Beginner’s Guide.




Thoughts, opinions, or feedback on this strategy? We would love to hear! Stochastic Indicator is a fun little indicator to use.
Thank you for this strategy 🙂 I like it because stochastic is my favorite indicator and I cant wait to test it . However,I would like to hear your opinion about implementing this strategy in binary options. Since things are a bit different in binaries, what you think about expiration time ? (on 15min charts)
I absolutely am in line with this question. Trading this strategy on binary with a 5mins chart for 15mins expiry. Would the strategy work?
the only way to know for sure would be to test it.
Thanks for the tweaking of an already great indicator! Couple of questions:
1) Article says to use Default settings of 14,3,3 but in the example box it says 14,3,1 – not a great difference but I want to be sure of the right settings.
2) I have tried a 3-bar Strategy in the past but found it difficult to spot (I missed a lot of them). Do you have or know of a 3-Bar Fractal Indicator that will mark this pattern like the standard 5-Bar Fractal Indicator? I have found only one on line and it was quite expensive to purchase (I am too cheap).
3) Is the Stop Loss placement based on the previous 3-Bar Pattern or is it based on a 5-Bar Pattern?
That is a really good question perhaps we could ask TSG to see if they would make one because they really make great indicators.
To answer your first questions, yes the defaults are 14,3,1. https://uploads.disquscdn.com/images/501f33fabf298ba46ec8ff3566ef6848a6f48849a4bbd1b3fbdfc148ca2b48c1.png See attached Pic of this…. Second, great idea! We have many new indicator ideas currently and we can add this to our list. Its traders like you who keep us motivated to help. Thanks for sharing your idea.
Thanks for this great strategy,Just want to find out if this stochastic settings will work 14,3,2?
We recommend 14,3,1 but if you try it out with 2 let us know how it works for you!
Can we use it on the 1 hour chart? I like the 1 hour chart because one can day trade and swing trade with it, plus one doesn’t have to stare at the charts multiple times during the day
excellent strategy
Thank you am already following you on twitter and facebook
I am also a big fan of the Stochastic indicator but I like to use a faster setting, this is. 5,3,3 This has worked really well for me.
Awesome! Thanks for the feedback. All traders are different so that is perfect if you have had success using those settings
Even on 5m & 2m charts?
I’m also using the same setting and it’s working out perfect.
Thank you Markus!
I think that the settings should be default with this strategy! The NT8 version may look a bit different.
Thanks!
No problem!
We usually stick with the default settings