Ultimate Guide to the Hammer and Shooting Star Strategy

The hammer and shooting star strategy is a price action reversal system designed to capture high-probability market turning points at key structural levels. These single-bar candlestick patterns highlight aggressive price rejection where buyers or sellers completely reverse intra-bar directional momentum. This guide teaches retail and professional traders how to trade both patterns with precise entry, stop-loss, and profit target rules.
- The hammer signals bullish rejection after a downtrend, while the shooting star signals bearish rejection after an uptrend.
- Both patterns require a tail or shadow that is at least two to three times the length of the real body.
- Standalone candles fail frequently; valid setups require key support/resistance, volume confirmation, or moving average alignment.
- Stop losses belong beyond the tip of the tail, anchored with an ATR buffer to avoid stop hunts.
What Is the Hammer and Shooting Star Pattern?
The hammer and shooting star strategy utilizes single-candle price action patterns to identify immediate trend exhaustion and sharp directional rejections. Documented thoroughly in modern technical analysis following Steve Nison’s adaptation of Japanese candlestick charting, these patterns represent extreme shifts in order flow within a single session. A hammer forms during a price decline when sellers drive price lower, only to be completely overwhelmed by buyers before the candle closes. Conversely, a shooting star occurs during an advance when buyers push prices higher, but strong selling pressure forces the bar to close near its open. Traders track these patterns because they visually pinpoint institutional liquidity sweeps and structural rejection levels.
The Market Psychology Behind Hammer and Shooting Star Candles
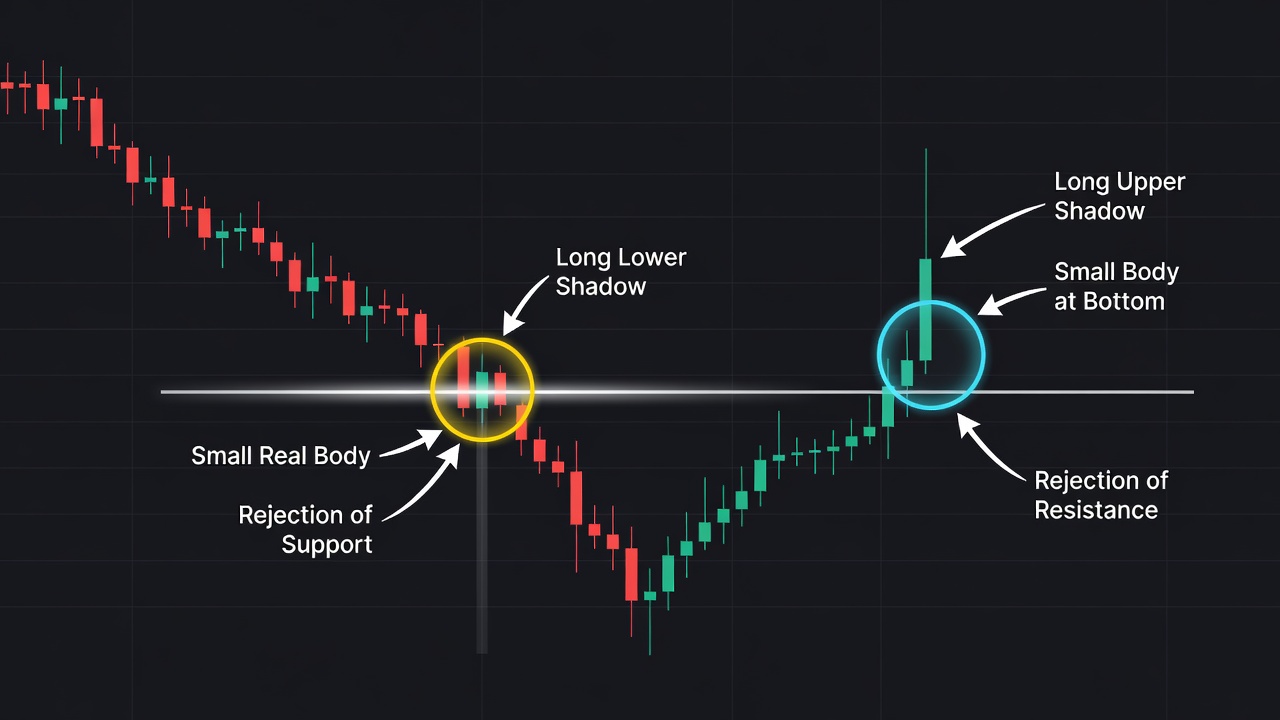
The psychology behind a hammer or shooting star reflects a dramatic shift in market control from aggressive trend followers to trapped counter-trend liquidity. During a hammer candle, short sellers actively push price down to test lower levels, triggering stop losses below market swing points and attracting breakout shorts. However, institutional buyers step in at discounted prices, absorbing all available supply and aggressively bidding price back up into the upper range of the session. This leaves short sellers trapped in losing positions and forces them to cover, fueling an explosive upward move. During a shooting star, enthusiastic long breakout traders buy near the high of the session, only to meet dense institutional supply. Sellers slam the price back down near the session open, trapping late buyers at the absolute high and creating panic liquidation.
How to Identify the Hammer and Shooting Star on a Chart
Identifying valid hammers and shooting stars requires strict visual measurements of the real body, shadow ratio, and overall location relative to the prevailing trend. A valid pattern cannot exist in isolation; it must contrast clearly with surrounding price action.
The Candle Body Size and Color
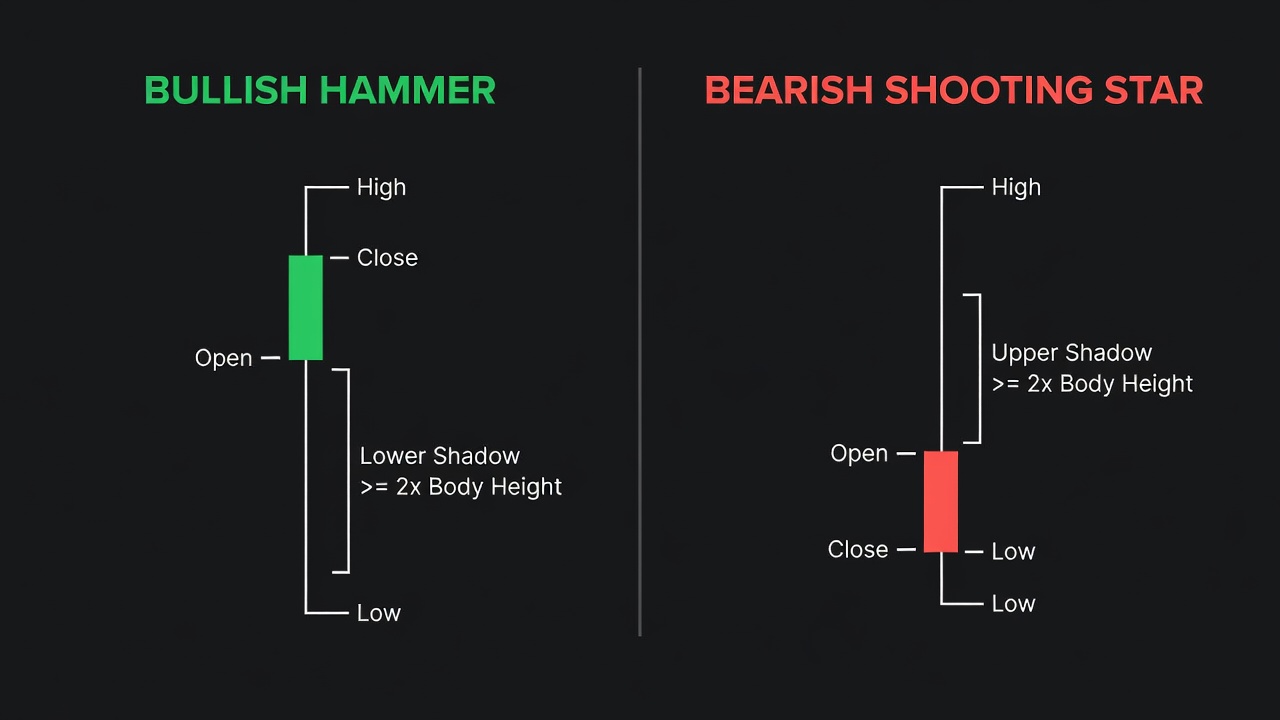
The real body of both candles must be small relative to the total vertical range of the bar. The body should occupy no more than 25% to 30% of the candle’s total height. While body color is secondary, a green (bullish) body on a hammer and a red (bearish) body on a shooting star offer higher probability because they show the winning side retained total control going into the bar close.
The Shadow Ratio and Tail Length
The long wick or shadow must measure at least two to three times the height of the real body. A hammer must feature a long lower shadow with little to no upper shadow, demonstrating that lower prices were sharply rejected. A shooting star requires a long upper shadow with virtually no lower shadow, proving higher prices were forcefully pushed back down.
Location Within Market Structure
Location dictates pattern validity above all visual features combined. A hammer appearing in the middle of a choppy horizontal consolidation is meaningless and should be ignored; it must occur after a sustained downtrend or pullback to support. Similarly, a shooting star must form after a clear advance or rally into key overhead structural resistance.
The Exact Hammer and Shooting Star Setup Criteria
High-probability trades require a strict combination of structural, visual, and contextual rules before execution.
- Clear Prior Trend: The price must display a minimum of 3-5 consecutive candles moving in the direction of the trend (downward for a hammer, upward for a shooting star) or a multi-session directional move.
- Key Structural Level: The candlestick tail must probe and reject an established higher-timeframe support level, prior swing high/low, VWAP, or major moving average.
- Proportional Wick Geometry: The rejection shadow must be at least two times (ideally three times) the length of the real body, with the opposite shadow measuring under 10% of the total range.
- Volume Confirmation: The pattern candle should show higher volume than the preceding three candles, indicating real institutional involvement rather than low-liquidity drift.
- Confirmation Trigger: The subsequent bar must trade past the real body or high/low of the pattern candle to trigger a valid execution.
Conditions that lack any of these criteria must be disqualified immediately.
How Do You Trade the Hammer and Shooting Star? (Entry, Stop Loss, Target)
Trading the hammer and shooting star requires systematic risk management with clear entry triggers, protected stops, and structural targets. Never guess where the bar will close; wait for complete bar formation before placing orders.
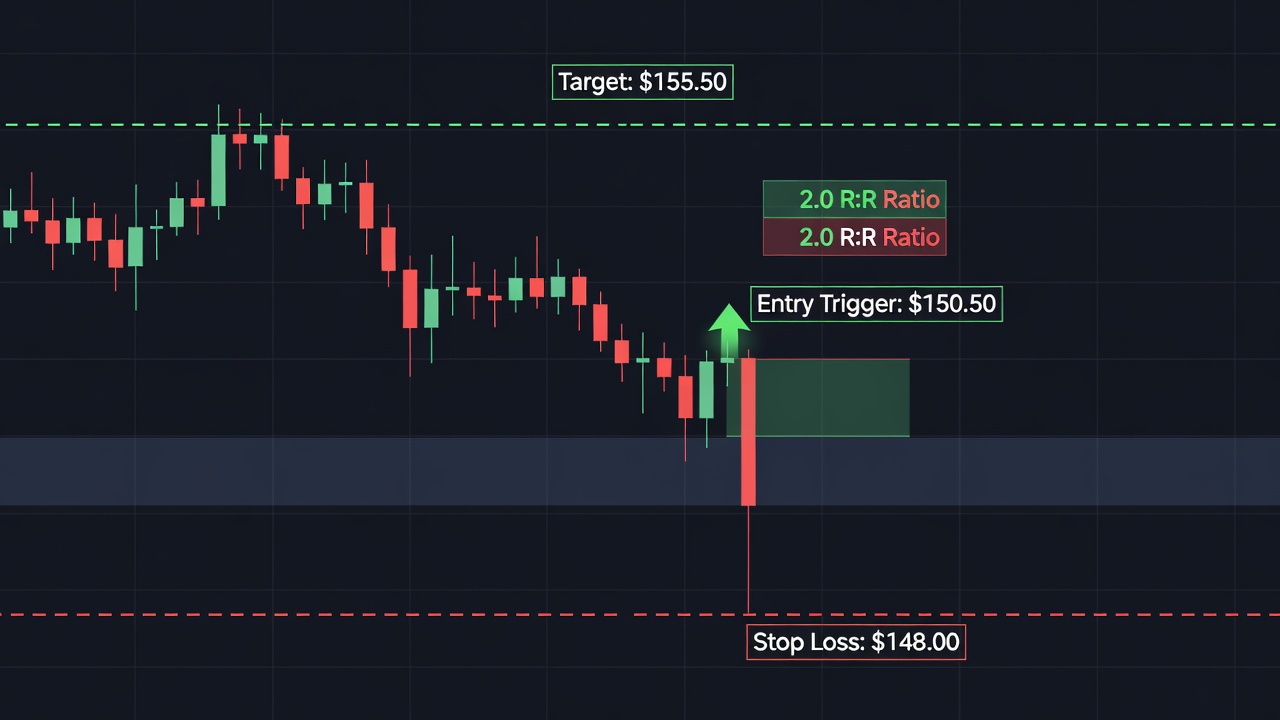
For a hammer setup, place a buy stop order 1-2 ticks above the high of the hammer candle. Alternatively, aggressive traders enter on the market close of the hammer candle, provided it closes near its high. Set the stop loss approximately 0.5 to 1 Average True Range (ATR) below the absolute low of the hammer’s lower tail. This buffer prevents premature stop outs caused by market volatility and liquidity hunts. Establish profit targets at the next key resistance zone or prior swing high, aiming for a minimum 2:1 Reward-to-Risk ratio.
For a shooting star setup, place a sell stop order 1-2 ticks below the low of the shooting star candle. Position the stop loss 0.5 to 1 ATR above the highest point of the upper shadow. Place profit targets at key support levels or prior swing lows. If the distance to the nearest structural target yields less than a 1.5:1 R:R, pass on the trade regardless of how clean the candle looks.
Free For Traders
Know The EXACT Moment A Stock Hits Support Or Resistance
Real-time alerts fire the instant a stock approaches a critical level. Completely free.

Hammer and Shooting Star Trade Example: Step-by-Step
This step-by-step walk-through demonstrates how to execute a high-probability trade using a hammer candlestick at key support.
Consider a 1-hour chart on a liquid asset where the price drops sharply over eight consecutive bars from $165.00 down to $150.00. As seen in the annotated chart above, this $150.00 area aligns perfectly with a major daily horizontal support zone established three weeks prior. On the ninth bar, aggressive selling pushes the price down to $148.50, sweeping liquidity below the prior daily low.
Buyers rapidly enter the market at this discounted level, absorbing sell orders and driving the hourly price back up to close at $150.80, forming a classic hammer candle with a small green body and a $2.30 lower shadow. Total volume on this hammer candle spikes to 250% of the 20-period volume moving average, signaling heavy institutional buying involvement.
To execute the trade, you set a buy stop order at $151.00 (just above the hammer high) with a stop loss at $147.80 (0.7 ATR below the $148.50 low), risking $3.20 per unit. The profit target is set at $157.40, just below the prior hourly swing resistance level, offering a $6.40 gain per unit. Two bars later, the buy stop triggers as price surges upward. Within four hours, momentum carries the market directly into the $157.40 target, securing a clean 2.0 R:R return.
Hammer and Shooting Star Across Different Timeframes
Pattern performance and signal reliability vary significantly depending on whether you trade intraday, daily, or weekly timeframes. Higher timeframes filter out random market noise and reflect genuine institutional order flow.
On 1-minute to 15-minute intraday charts, hammer and shooting star candles occur frequently but produce high failure rates due to high-frequency trading noise and micro-liquidity sweeps. When trading intraday, pair these candles strictly with session VWAP, opening range highs/lows, or major daily levels.
The 1-hour, 4-hour, and Daily timeframes deliver the highest win rates for price action swing traders. A daily hammer or shooting star represents an entire session of price discovery and institutional rejection, making its signal immensely influential. Weekly patterns are rare, but when they form at multi-month structural support or resistance, they frequently launch macro trends lasting several quarters.
Hammer and Shooting Star vs. Doji: Key Differences
While hammers, shooting stars, and dojis all feature long shadows, their body positions and underlying psychology differ fundamentally.
Hammer and Shooting Star Characteristics
Hammers and shooting stars feature a small real body positioned at one extreme end of the candlestick range. This indicates clear, asymmetric directional rejection. One side attempted a breakout, failed completely, and surrendered control to the opposing side before the session closed.
Doji Characteristics
A Doji features an virtually non-existent real body where the open and close price are nearly identical. The real body sits near the middle of the range in a classic Doji, signaling total market indecision and equilibrium rather than sharp rejection. While a Doji shows buyers and sellers are tied, a hammer or shooting star proves one side decisively won the intra-bar battle.
Best Confluences to Stack With Hammer and Shooting Star Signals
Stacking structural confluences with candlestick signals transforms isolated patterns into a robust trading edge. Never trade a candle pattern in a vacuum without supporting technical evidence.
- Horizontal Support and Resistance: A hammer rejecting a multi-touch horizontal floor or a shooting star rejecting a hard ceiling increases pattern reliability exponentially.
- 50-period and 200-period EMAs: Dynamic moving averages act as strong trend-continuation springboards when combined with rejection candles during pullbacks.
- Volume Spikes: High relative volume on the pattern bar proves institutional traders participated in the rejection rather than retail traders drifting price.
- Fibonacci Retracement Levels: Pattern wicks that align with the 61.8% or 78.6% Golden Ratio retracements identify high-value entry zones.
- Prior Day High/Low Sweeps: Sweeping liquidity above the prior day high (shooting star) or below the prior day low (hammer) traps breakout traders and accelerates reversals.
Common Hammer and Shooting Star Mistakes to Avoid
Avoiding classic execution mistakes protects your capital from false breakouts and choppy markets. Most failed patterns stem from poor context rather than flawed candle anatomy.
- Trading Patterns inside Consolidation Ranges: Entering on a hammer or shooting star that forms inside a tight sideways range leads to constant chop and losses.
- Ignoring the Macro Trend: Taking a hammer against a powerful macro downtrend carries significantly lower probability than trading a hammer during a bullish pullback.
- Placing Stop Losses Exactly at the Tail Extreme: Setting your stop directly on the tip of the wick exposes your order to simple liquidity sweeps before the market moves in your intended direction.
- Entering Before Bar Close: Jumped-the-gun entries often backfire when a potential hammer flattens into a strong bearish bar before the candle officially closes.
- Disregarding Wick Ratios: Misidentifying candles with large bodies and short wicks as hammers dilutes your edge; stick strictly to the 2:1 shadow-to-body rule.
From Find Better Trades
Know Exactly Where The Big Money Steps In
Auto-plots institutional support & resistance zones from pure price action — no more guessing at levels.

Hammer and Shooting Star Strategy Checklist
Filter every potential trade through this binary checklist before placing an order.
- Is there a clear preceding trend or pullback of at least 3-5 candles?
- Is the candlestick shadow/wick at least twice the length of the real body?
- Is the real body located entirely in the upper 25% (hammer) or lower 25% (shooting star) of the total range?
- Does the wick probe and reject an established support/resistance level, prior day extreme, or key EMA?
- Has the candlestick fully closed on the active timeframe?
- Does the trade offer a minimum Reward-to-Risk ratio of 2:1 to the next structural level?
Frequently Asked Questions About Hammer and Shooting Star Strategy
What is the difference between a hammer and a hanging man?
A hammer and a hanging man share identical candle shapes with small real bodies and long lower shadows. The key difference is market context: a hammer appears after a price decline signaling a bullish reversal, whereas a hanging man forms after an advance signaling potential bearish exhaustion.
Is candle color important for hammers and shooting stars?
Candle body color is not mandatory, but a green body for a hammer and a red body for a shooting star increases signal quality. A green hammer body shows buyers managed to push the close above the open, adding momentum to the rejection signal.
Where should you set your stop loss when trading a hammer candle?
Place your stop loss slightly below the lowest point of the hammer’s lower tail. Adding an extra buffer of 0.5 to 1 ATR below the tail low protects your order from market volatility and spread spikes.
Which timeframe is best for trading hammer and shooting star patterns?
The daily and 4-hour timeframes deliver the most consistent and high-probability reversal signals. Lower timeframes under 15 minutes generate excessive noise and false signals due to micro-structure fluctuations.
📈 Want More? Join Our Free Trading Community
- Trading Strategy Guides Telegram — daily strategy tips and market insights
- Find Better Trades Telegram — free trade signals delivered to your phone
- Find Better Trades on YouTube — live trade breakdowns and tutorials