Pin Bar Reversal Strategy: The Complete Guide for Price Action Traders

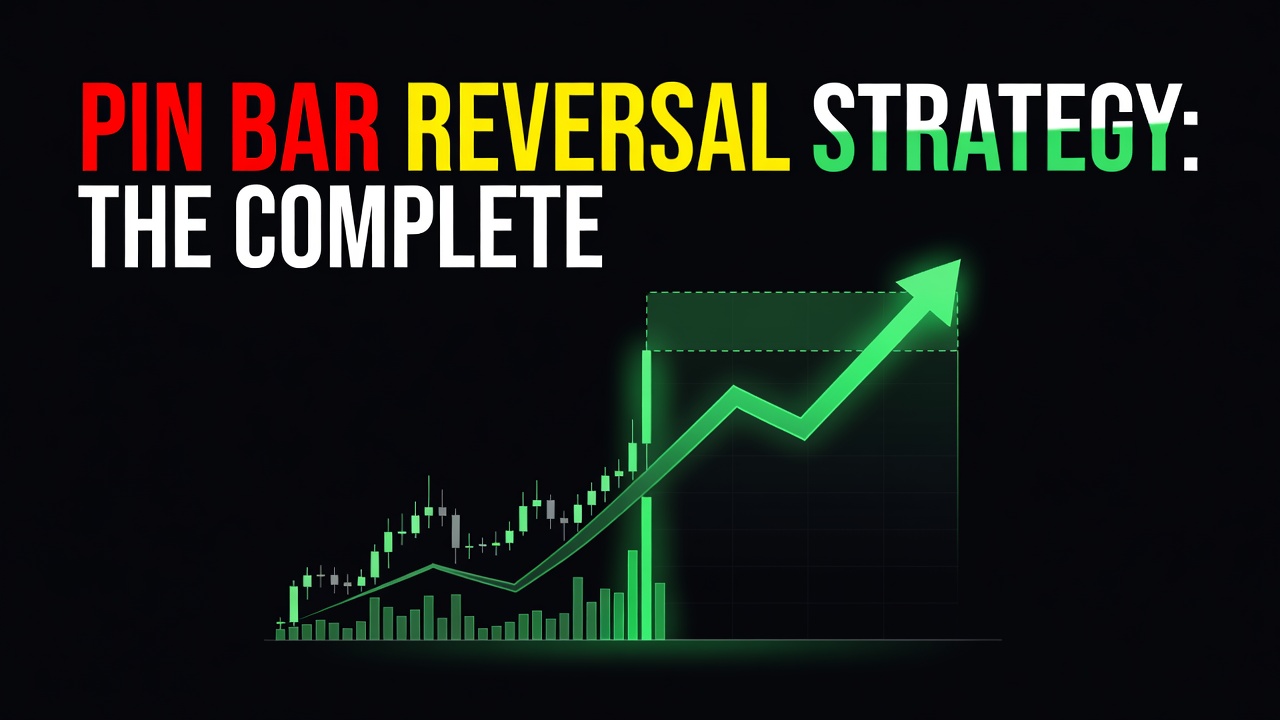
The pin bar reversal strategy is a powerful price action method that identifies sharp market rejections at key technical levels. Short for ‘Pinocchio Bar’, this single-candle setup features a long tail that traps traders on the wrong side of the market before price snaps back aggressively. Master this structure to spot high-probability turning points across forex, stocks, futures, and crypto.
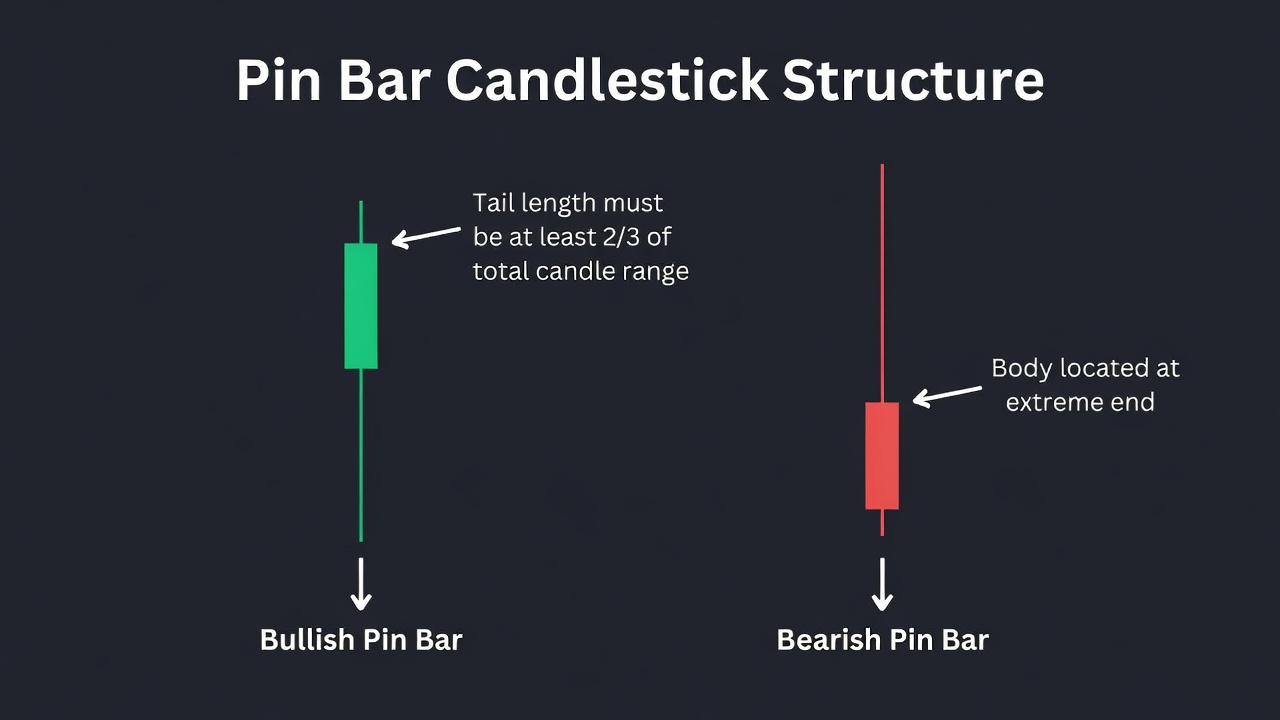
- Anatomy matters: A valid pin bar requires a tail that accounts for at least two-thirds of the candle’s total height.
- Location dictates success: Pin bars traded in isolation fail; they must form at key support, resistance, or trendline confluences.
- Psychology of the trap: The long wick represents a failed breakout where institutional liquidity absorbs retail orders.
- Risk-to-reward edge: Stop losses sit tightly beyond the tail tip, enabling large risk-to-reward ratios on successful reversals.
What Is the Pin Bar Reversal Strategy?
The pin bar reversal strategy centers on reading a single candlestick structure that signals a sudden shift in market control. Martin Pring originally popularized the concept under the name ‘Pinocchio Bar’ because the long wick ‘lies’ to the market by breaking a key boundary before quickly retreating. It appears across all liquid financial charts when price attempts to push past a support or resistance level but gets violently repelled. Instead of guessing where market tops or bottoms form, traders use this visual footprint to enter right as aggressive counter-traders take control. When backed by higher-timeframe market structure, this pattern consistently uncovers high-conviction trade setups.
The Market Psychology Behind the Pin Bar Reversal
Behind every pin bar is a classic liquidity trap designed to punish breakout traders and reward patient capital. As price approaches a visible swing high or low, momentum traders jump on board expecting a sustained breakout. Institutional traders take the opposite side of these breakout orders, using retail buying or selling volume to fill their own large counter-trend positions. As large orders absorb the incoming liquidity, price abruptly turns around and closes near the opening level. Retail breakout traders are instantly trapped in losing positions, and their stop losses fuel the fast continuation move in the opposite direction.
How to Identify the Pin Bar Reversal on a Chart
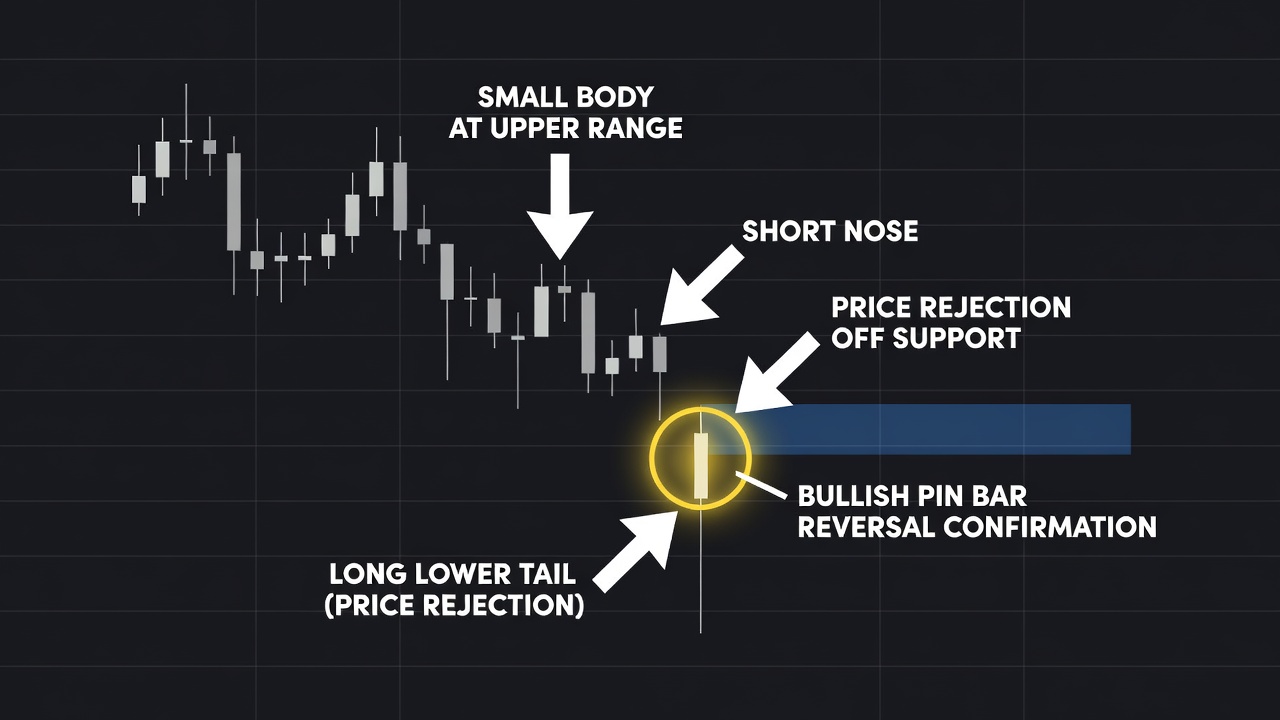
Identifying a genuine pin bar requires auditing the exact proportions of three distinct candle components.
The Long Tail or Wick
The tail is the defining feature of the pin bar and must represent at least 66% to 75% of the total candle length. This long shadow shows the price extreme that was tested and rejected during the candle’s duration. A longer tail relative to surrounding candles indicates a stronger rejection and a more powerful reversal signal.
The Real Body
The body of the pin bar must remain small and sit entirely near one end of the overall candle range. Whether the candle closes red or green matters less than its position relative to the tail. In a bullish pin bar, the body rests at the top end; in a bearish pin bar, it rests at the bottom end.
The Nose
The nose is the small wick protruding from the opposite end of the tail, and it must be tiny or non-existent. A large nose indicates two-sided indecision rather than a clean directional rejection. If the opposite wick exceeds 10% to 15% of the total candle range, the pin bar structure is compromised.
The Exact Pin Bar Reversal Setup Criteria
To maintain a strong statistical edge, every pin bar reversal trade must satisfy five strict visual and structural conditions.
- Timeframe selection: The setup must appear on the 1-hour, 4-hour, or Daily chart, as lower timeframes contain excessive noise.
- Level context: The pin bar must reject a clearly established horizontal support level, resistance level, moving average, or trendline.
- Tail ratio: The lower or upper tail must measure at least two to three times the length of the real body.
- Protrusion: The long wick must visibly poke out past surrounding candle wicks, sweeping resting liquidity.
- Location of body: The real body must close within the top 25% of the candle range for bullish setups, or bottom 25% for bearish setups.
How Do You Trade the Pin Bar Reversal? (Entry, Stop Loss, Target)
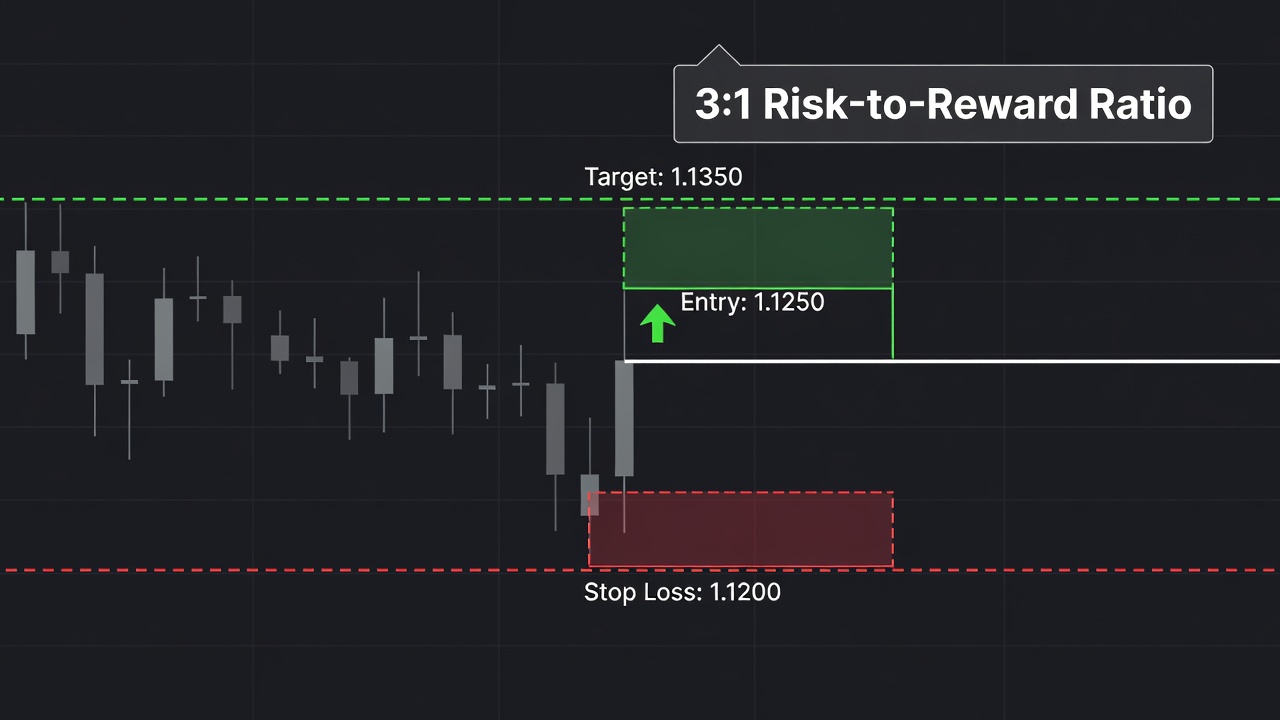
Executing a pin bar reversal requires choosing an entry method that balances fill probability against risk-to-reward optimization. You can enter using a buy/sell stop order placed just past the nose on a momentum breakout, or use a limit order at the 50% retracement level of the pin bar tail to squeeze out higher leverage.
Stop loss placement must be tied to price invalidation by placing it 2 to 5 pips (or 0.5 ATR) past the tip of the tail. If price breaks beyond the tip of the wick, the rejection failed, and the setup is invalidated. Profit targets should be placed at the next major market structure level, such as the previous swing high or key horizontal zone.
A high-quality pin bar trade typically yields a minimum 2:1 or 3:1 risk-to-reward ratio. Taking trades below a 2:1 reward profile degrades long-term expectancy.
Free For Traders
The Options Cheat Sheet Thousands Of Traders Swear By
Calls, puts, spreads — one free download tells you the right options strategy for every market condition.

Pin Bar Reversal Trade Example: Step-by-Step
Let us walk through a step-by-step example on a 4-hour FX chart to demonstrate how to execute this strategy with discipline.
As you can see in the annotated chart above, the market had been in a defined downtrend for several days, pulling back directly into a major horizontal support zone near 1.0800. At this support level, price dropped sharply during the mid-London session, dipping down to 1.0750 before aggressive buyers absorbed the selling pressure.
By the close of the 4-hour candle, price snapped back up to close at 1.0795. The candle printed a long lower tail of 45 pips and a tight real body of just 8 pips, meeting our strict anatomical proportions. The long tail swept liquidity below the previous day’s low before rejecting lower prices.
We placed a buy stop order at 1.0802, slightly above the pin bar high, with a stop loss set at 1.0743 (5 pips below the tail low). Our total risk was 59 pips. We set our profit target at the next major swing resistance at 1.0980, offering a potential gain of 178 pips.
The order triggered on the very next candle. Over the subsequent 24 hours, buyers maintained control, pushing price directly to our profit target. The trade delivered a 3:1 reward-to-risk payoff cleanly.
Pin Bar Reversal Across Different Timeframes
Higher timeframe pin bars carry significantly more predictive weight because they represent sustained order flow over longer periods.
On 5-minute charts, pin bars print frequently but fail often due to market noise, spread costs, and algorithmic manipulation. On 1-hour and 4-hour charts, pin bars balance frequent trading opportunities with reliable signal strength, making them ideal for swing and day traders. Daily and Weekly pin bars offer the highest win rates and cleanest follow-through, often signaling structural trend shifts that last for weeks.
Pin Bar Reversal vs. Doji: Key Differences
While both patterns feature long wicks, their structural meaning and trading implications are vastly different.
Pin Bar Reversal
A pin bar is a decisive directional rejection signal characterized by asymmetrical wicks and an offset real body. The long wick on one side and small body on the opposite end show clear domination by one party after an initial push. It signals an immediate directional edge.
Doji Candlestick
A Doji represents total market equilibrium and indecision, featuring virtually equal wicks on both sides and a body centered in the middle. A Doji shows that neither buyers nor sellers could establish control. It requires subsequent candle confirmation before taking a trade.
Best Confluences to Stack With the Pin Bar Reversal
Stacking multiple technical factors exponentially increases the win rate of any pin bar setup.
- Horizontal Support and Resistance: Rejections at multi-touch horizontal levels offer the strongest pin bar foundations.
- Dynamic Moving Averages: Rejections off the 20-period or 50-period exponential moving average (EMA) in a trending market confirm continuation setups.
- Fibonacci Retracement Levels: A pin bar forming at the 61.8% Golden Ratio adds high-precision mathematical confluence.
- Volume Spikes: Abnormally high volume during the pin bar formation confirms institutional absorption of retail liquidity.
- Prior Day High or Low: Liquidity sweeps of previous day extremes followed by a pin bar close trigger massive squeeze moves.
Common Pin Bar Reversal Mistakes to Avoid
Avoiding predictable mistakes is what separates profitable price action traders from amateurs.
- Trading pin bars in mid-air: Taking a pin bar that forms in the middle of a range without key support or resistance confluence guarantees poor win rates.
- Ignoring the overarching trend: Counter-trend pin bars fail far more often than trend-continuation pin bars.
- Accepting stubby wicks: Entering on candles where the tail is less than two-thirds of the total candle length lowers statistical edge.
- Front-running the candle close: Entering a trade before the pin bar candle actually closes leaves you exposed to late shape shifts.
- Placing stops exactly at the wick tip: Setting stops on the exact pip of the tail low often gets you knocked out by spread widening.
From Find Better Trades
Know Exactly Where The Big Money Steps In
Auto-plots institutional support & resistance zones from pure price action — no more guessing at levels.

Pin Bar Reversal Checklist
Run through this binary checklist before executing any pin bar reversal setup.
- Is the pin bar forming at a key support, resistance, EMA, or Fibonacci level? (Yes/No)
- Is the tail length at least two-thirds (66%) of the total candle height? (Yes/No)
- Is the real body located entirely near one extreme end of the candle? (Yes/No)
- Has the candle fully closed on your chart timeframe? (Yes/No)
- Does the setup offer at least a 2:1 risk-to-reward ratio to the first trouble area? (Yes/No)
Frequently Asked Questions About the Pin Bar Reversal
What is the success rate of a pin bar reversal strategy?
A pin bar reversal strategy achieves a win rate between 55% and 70% when traded strictly at major support, resistance, or trend confluence points. Isolated pin bars without technical backdrop perform near random 50% levels. Combined with proper risk management, even a 55% win rate yields high profitability.
Is the color of the pin bar real body important?
The color of the pin bar body is secondary to its location and tail length. However, a bullish pin bar with a green body provides slightly stronger bullish momentum than one with a red body. Focus primarily on wick proportion and rejection level.
How do you enter a 50% retracement pin bar trade?
Place a limit order at the midpoint (50% Fibonacci level) of the entire pin bar candle range from high to low. This entry method narrows your stop loss distance, significantly boosting your risk-to-reward ratio. The trade-off is that aggressive momentum moves might not fill your limit order.
Which timeframe is best for trading pin bar reversals?
The Daily and 4-Hour timeframes offer the most reliable pin bar reversal signals because they reflect substantial institutional order flow. Lower timeframes like the 5-minute or 15-minute contain too much market noise and lower success rates. Stick to higher timeframes for consistent edge.
📈 Want More? Join Our Free Trading Community
- Trading Strategy Guides Telegram — daily strategy tips and market insights
- Find Better Trades Telegram — free trade signals delivered to your phone
- Find Better Trades on YouTube — live trade breakdowns and tutorials