Multi-Timeframe RSI & Bollinger Squeezes: Semi Breakouts


Semiconductor stocks like NVIDIA (NVDA), AMD, and Taiwan Semiconductor (TSM) drive the modern market with extreme volatility and rapid institutional flows. Master using multi-timeframe RSI and Bollinger Band squeezes to trade semiconductor breakouts with high-precision entries that filter out market noise.
By pairing Bollinger Band volatility contraction with multi-timeframe Relative Strength Index (RSI) momentum alignment, traders can catch aggressive directional expansions right before they happen. This strategy solves the biggest problem momentum traders face: buying too late or getting trapped in false breakouts.
Why Using Multi-Timeframe RSI and Bollinger Band Squeezes to Trade Semiconductor Breakouts Works
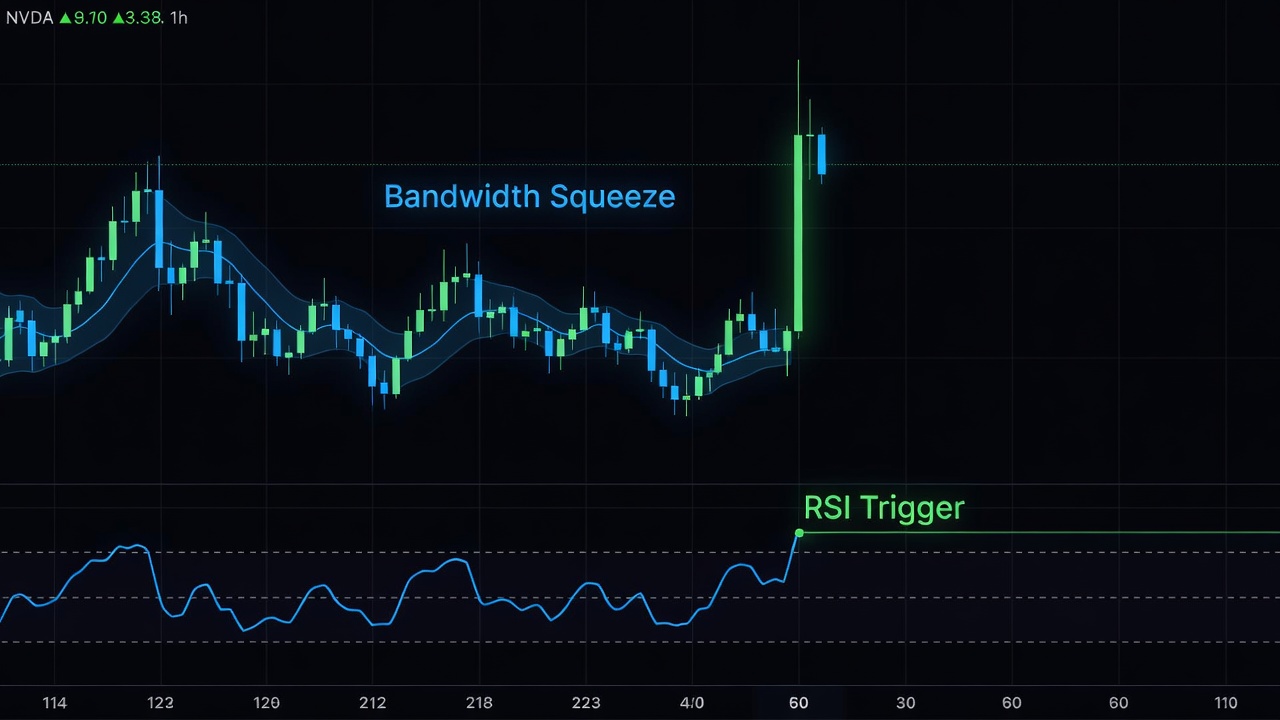
Semiconductor stocks do not move in a straight line forever; they cycle rapidly between periods of low volatility (consolidation) and high volatility (trending expansion). Bollinger Bands measure this expansion and contraction through standard deviation bands plotted around a 20-period simple moving average (SMA).
When price range narrows, Bollinger Bandwidth drops to multi-week lows, creating a classic squeeze. However, a squeeze alone does not tell you which direction price will explode. That is where multi-timeframe RSI analysis becomes essential.
Using RSI across higher and lower timeframes provides the structural context and real-time execution trigger required for consistent wins. Higher timeframes reveal institutional directional bias, while lower timeframes signal immediate momentum expansion.
Understanding Volatility Contraction in Semiconductor Stocks
Semiconductor supply chains and earnings cycles cause tight consolidation phases before massive multi-day runs. During these periods, market makers accumulate positions, compressing historical volatility.
When Bollinger Bands contract inside Keltner Channels or hit historic low bandwidth levels on platforms like TradingView or thinkorswim, energy is coiled. The longer the squeeze lasts in top chip tickers like SOXX, SMH, or NVDA, the more aggressive the eventual breakout will be.
The Power of Multi-Timeframe Alignment
Single-timeframe indicators frequently produce false signals during market choppiness. A 15-minute chart might look oversold while the daily chart is in a roaring uptrend, causing counter-trend traders to get crushed.
Multi-timeframe RSI alignment eliminates low-probability trades by aligning short-term entry momentum with dominant institutional trendlines. When the Daily RSI is bullish and the 1-Hour RSI breaks above 60 out of a squeeze, execution risk drops dramatically.
Step-by-Step Guide: Using Multi-Timeframe RSI and Bollinger Band Squeezes to Trade Semiconductor Breakouts
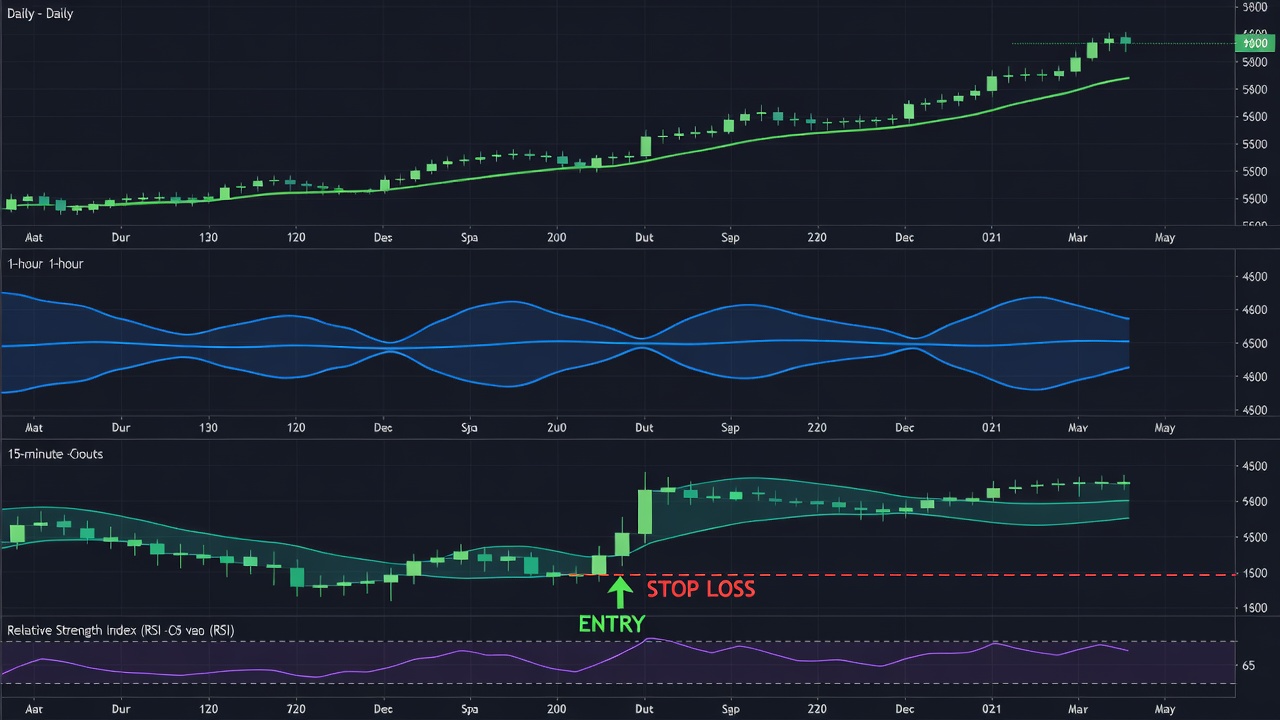
Executing this strategy effectively requires a disciplined rule set across three synchronized timeframes. Follow this step-by-step setup to trade semiconductor breakouts with maximum precision and controlled risk.
- Step 1: Determine Macro Trend on the Daily Chart — Load a Daily chart of your chosen chip stock (e.g., NVDA, AMD, TSM, or SMH). Check that price is above the 50-day SMA and the Daily RSI (14) is holding above 50, indicating a overall bullish regime.
- Step 2: Identify Volatility Compression on the 1-Hour Chart — Switch to the 1-Hour chart and apply Bollinger Bands (20, 2). Look for Bollinger Bandwidth to contract tightly, signifying a volatility squeeze where bands squeeze closer together than they have over the past 20 bars.
- Step 3: Wait for Multi-Timeframe RSI Momentum Confirmation — Verify that the 1-Hour RSI (14) rises out of the 45-55 neutral zone and breaks cleanly above 60 to confirm buyers are taking control prior to the candle closure.
- Step 4: Execute Signal on the 15-Minute Chart — Drop to the 15-Minute execution chart. Enter a long position when a 15-minute candle closes outside the upper Bollinger Band while the 15-Minute RSI crosses above 65 on above-average volume.
- Step 5: Define Risk Limits and Profit Targets — Place your stop loss just below the 20-period SMA on the 1-Hour timeframe (or recent swing low). Calculate initial profit target at 2x your risk (1:2 Risk-to-Reward ratio), trailing remaining equity with the 20 SMA.
Step 1: Establish High-Timeframe Trend (Daily Chart)
Never trade against the primary trend in high-beta semiconductor equities. If the Daily chart exhibits a bearish RSI divergence or trades under its 200-day moving average, avoid taking long volatility squeezes.
Ideally, look for Daily RSI to sit between 55 and 68. This confirms existing momentum without entering extreme overbought exhaustion territory.
Step 2: Identify Volatility Compression (1-Hour Chart)
On the 1-Hour timeframe, measure volatility using standard 20-period Bollinger Bands set at 2 standard deviations. Look for the upper and lower bands to pinch tightly together.
You can also use the Bollinger Bandwidth indicator; when the bandwidth reading drops to its lowest value in 100 periods, the squeeze is primed for expansion.
Step 3: Confirm RSI Momentum Expansion (15-Minute Chart)
Once the 1-Hour squeeze is active, monitor the 15-Minute chart for real-time momentum triggers. Avoid entering inside the squeeze before momentum confirms direction.
A bullish expansion requires the 15-Minute RSI to cross aggressively above 60-65. This confirms that kinetic buying pressure is actively pushing price through resistance levels.
Step 4: Execute Entry, Risk Management, and Stop Loss
Enter the position as soon as a 15-Minute candle closes above the upper Bollinger Band alongside confirmed RSI momentum. Do not guess the breakout before the bar closes.
Position your stop loss strictly beneath the 20-period SMA on the 1-Hour chart or the squeeze consolidation low. If price drops back into the center of the bands, the breakout has failed and exit immediately.
Step 5: Take Profit Scaling Strategy
Semiconductor trends can extend significantly further than expected during momentum phases. Scale out of your position in structural layers to maximize profits.
Sell 50% of your position size at a 1:2 Risk-to-Reward ratio to lock in baseline gains. Move stop loss on remaining shares to breakeven, trailing them along the lower 15-Minute 20 SMA until closed out.
Common Pitfalls When Trading Semiconductor Squeezes
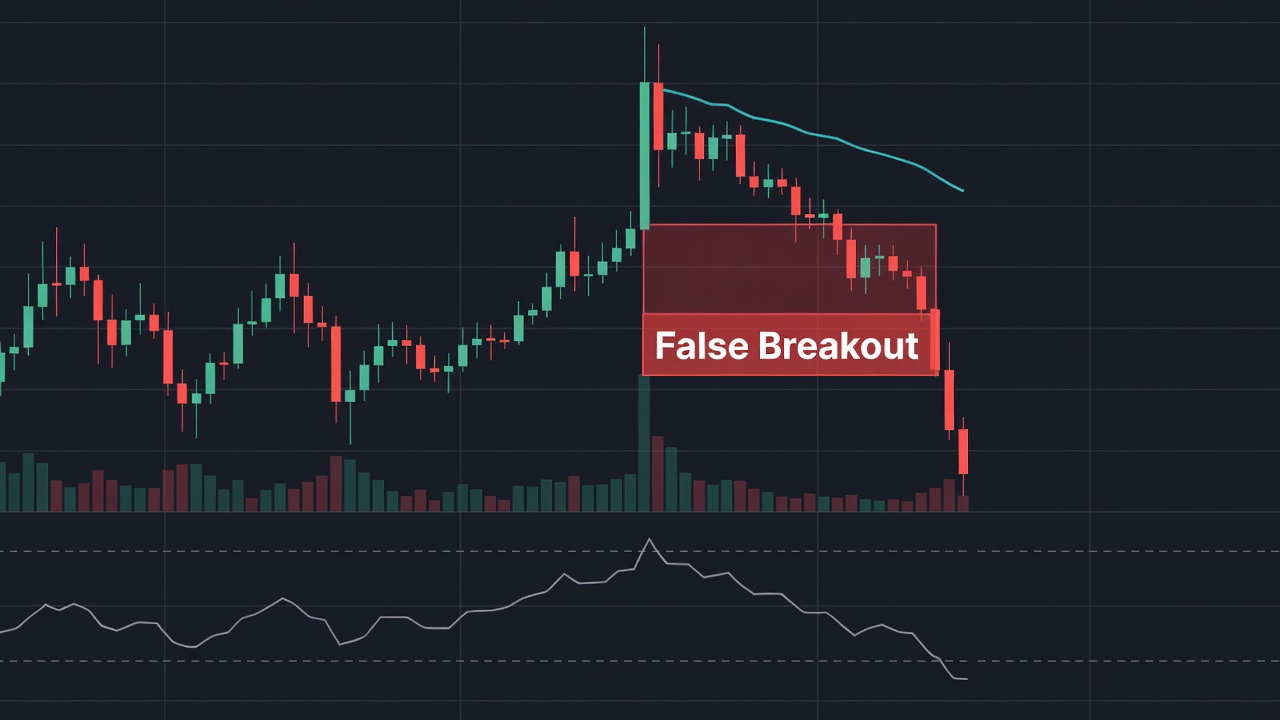
While this strategy offers a high win-rate, trading high-beta technology stocks involves distinct risks. Avoid these common trading errors when applying multi-timeframe setups in active markets.
Trading Fakeouts During Low Volume
Breakouts occurring on below-average volume often result in immediate bull traps. Always check relative volume (RVOL) on MetaTrader or TradingView; breakout candles should show at least 1.5x average trading volume.
If a candle pierces the upper Bollinger Band on weak volume, institutional traders are likely taking profit into short-term liquidity rather than initiating new long positions.
Ignoring Semiconductor Sector Correlation (SOXX / SMH)
Individual semiconductor stocks rarely trade in isolation. If NVDA breaks out from a squeeze, but the VanEck Semiconductor ETF (SMH) is hitting daily resistance, the trade is prone to failing.
Ensure sector funds (SOXX or SMH) mirror the bullish momentum setup before taking isolated equity risk on single tickers.
Misinterpreting Overbought RSI Readings
Novice traders often assume an RSI above 70 means an asset must immediately drop. During explosive semiconductor breakouts, RSI can remain above 70 or 80 for multiple days while price moves exponentially higher.
Do not sell a squeeze breakout simply because RSI crosses 70. Use trailing stops based on price action and moving averages rather than prematurely cutting winning trades.
Frequently Asked Questions
Q: What are the best indicator settings for trading Bollinger Band squeezes on semiconductor stocks?
The optimal settings are standard 20-period Simple Moving Average with 2.0 Standard Deviations for Bollinger Bands, combined with a standard 14-period Relative Strength Index (RSI). For tracking squeeze intensity, add the Bollinger Bandwidth indicator set to 20 periods.
Q: Which timeframes work best for multi-timeframe RSI semiconductor breakouts?
The ideal timeframe combination is the Daily chart for structural market bias, the 1-Hour chart to detect Bollinger Band squeezes, and the 15-Minute chart for fine-tuning entry timing and RSI momentum triggers.
Q: How do you prevent getting caught in false Bollinger Band breakouts?
Filter false breakouts by requiring multi-timeframe RSI confirmation (1-Hour RSI > 60 and 15-Minute RSI > 65) alongside relative volume (RVOL) greater than 1.5x. Never enter inside the squeeze before a candle closes outside the band.
Q: Can this strategy be used for short trades during semiconductor pullbacks?
Yes. For short setups, reverse the rules: ensure Daily trend is bearish, look for a 1-Hour Bollinger Band squeeze, enter when 15-Minute price closes below the lower band, and confirm that 15-Minute RSI crosses below 35-40.
📍 Free Access to Support & Resistance Alerts
Get notified instantly when a stock approaches a critical support or resistance level. Real-time alerts, completely free.

Also from Find Better Trades: Power Index
Oscillator that measures trend conviction at a glance. Only take trades when momentum is heavily in your favor.
📈 Want More? Join Our Free Trading Community
- Trading Strategy Guides Telegram — daily strategy tips and market insights
- Find Better Trades Telegram — free trade signals delivered to your phone
- Find Better Trades on YouTube — live trade breakdowns and tutorials