The Obsidian Pulse: Precision Momentum Swing Trading System

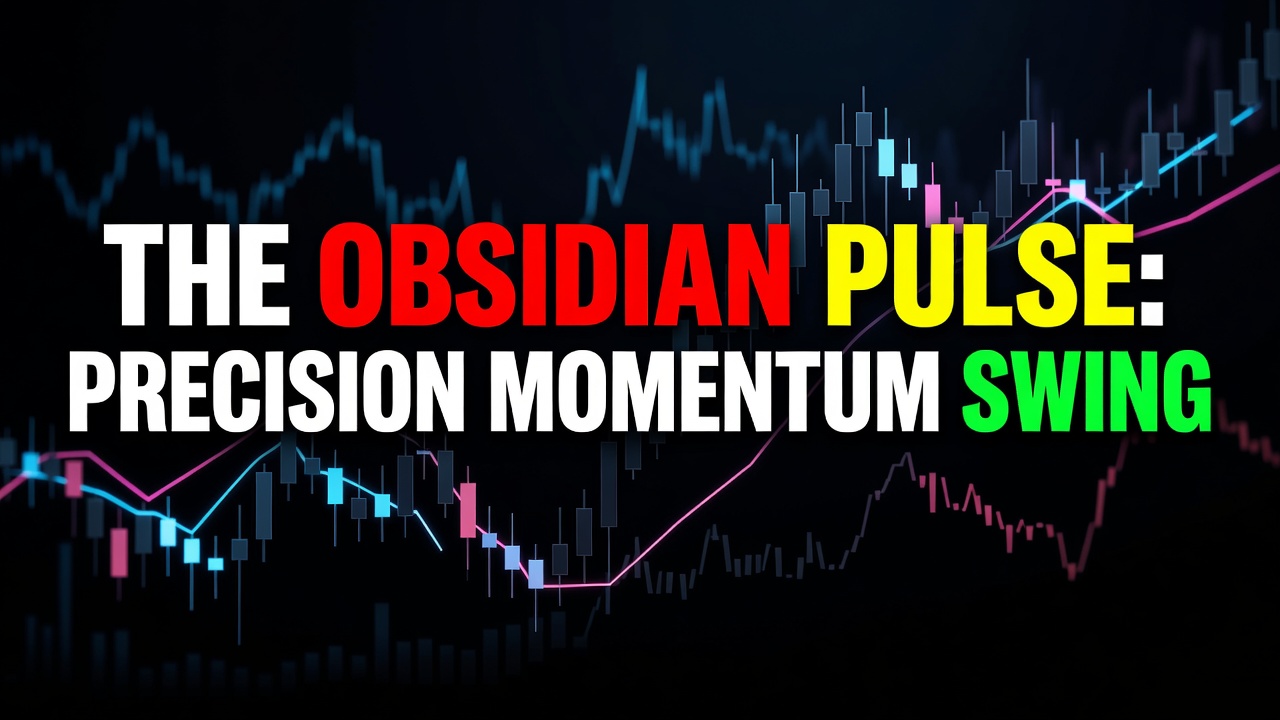
Trading pullbacks inside active directional markets often ends in frustration when shallow retracements turn into violent liquidity sweeps that hunt stops before resuming the main trend. The Obsidian Pulse fixes this structural problem by combining visual trend containment with a sharp velocity threshold to enter exact continuation moves right as institutional sellers run out of gas. Built for active intraday traders on forex pairs, stock index futures, and high-volume crypto assets, this system eliminates subjective guesswork and establishes a rigid visual routine before you open any position.
What Is The Obsidian Pulse?
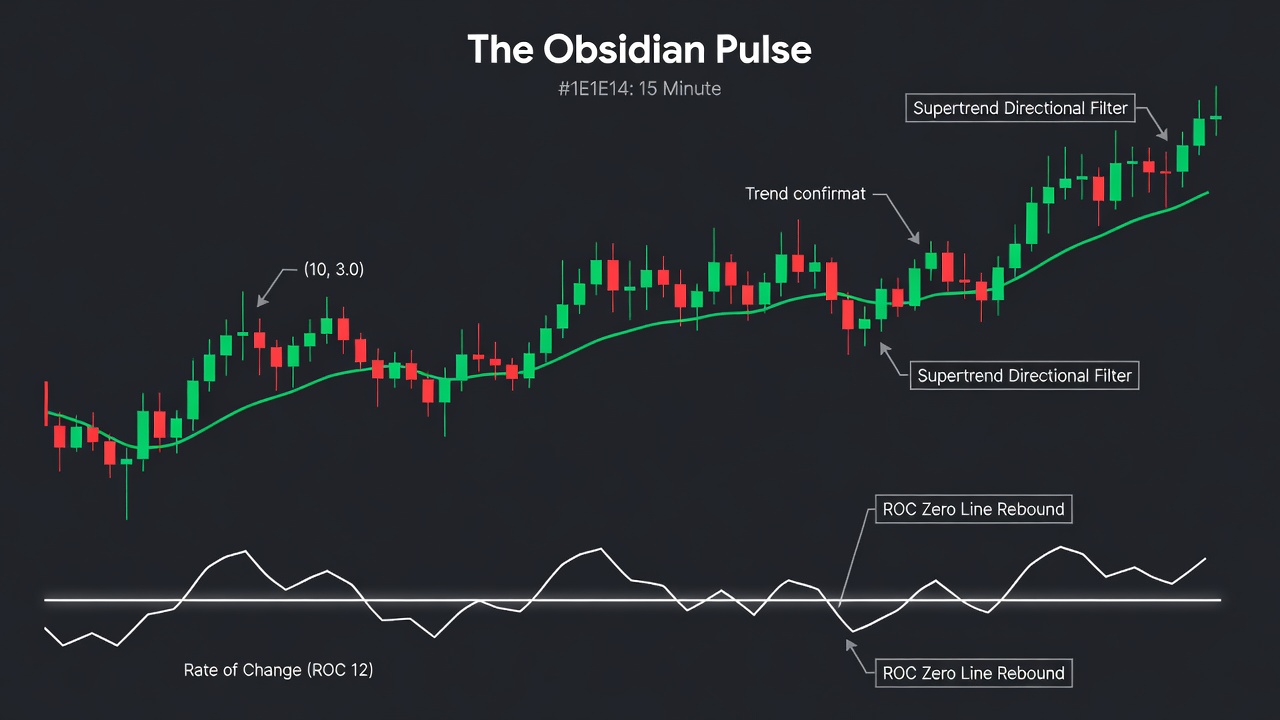
The Obsidian Pulse is a trend-continuation strategy designed to exploit transient momentum exhaustion within strongly established directional moves. By anchoring structural trend direction with a dynamic trailing baseline and confirming velocity recovery through momentum rate shifts, it pinpoints the precise moment passive orders regain control of price. This framework excels on the 15-minute and 1-hour timeframes, serving day traders and active swing traders who demand mechanical confirmation over gut feel.
Indicators You Need
- Supertrend Indicator (Settings: Period 10, Multiplier 3.0): Acts as your master directional filter and dynamic trailing baseline. Long trades are permitted strictly when the Supertrend line prints below price in bright green; short trades require price to remain below a red Supertrend line.
- Rate of Change / ROC (Settings: Period 12): Measures price velocity relative to past bars. You use this oscillator to detect when short-term counter-trend momentum dies out and aligns back with the macro flow.
- Price Action Trigger (Bullish Engulfing or Hammer / Bearish Engulfing or Shooting Star): Serves as the ultimate mechanical execution key, ensuring price confirms the indicator alignment before capital is committed.
- Chart Timeframe: Works best on 5-minute, 15-minute, and 1-hour charts across liquid assets like EUR/USD, NQ futures, and BTC/USD.
The Obsidian Pulse Rules — Step by Step
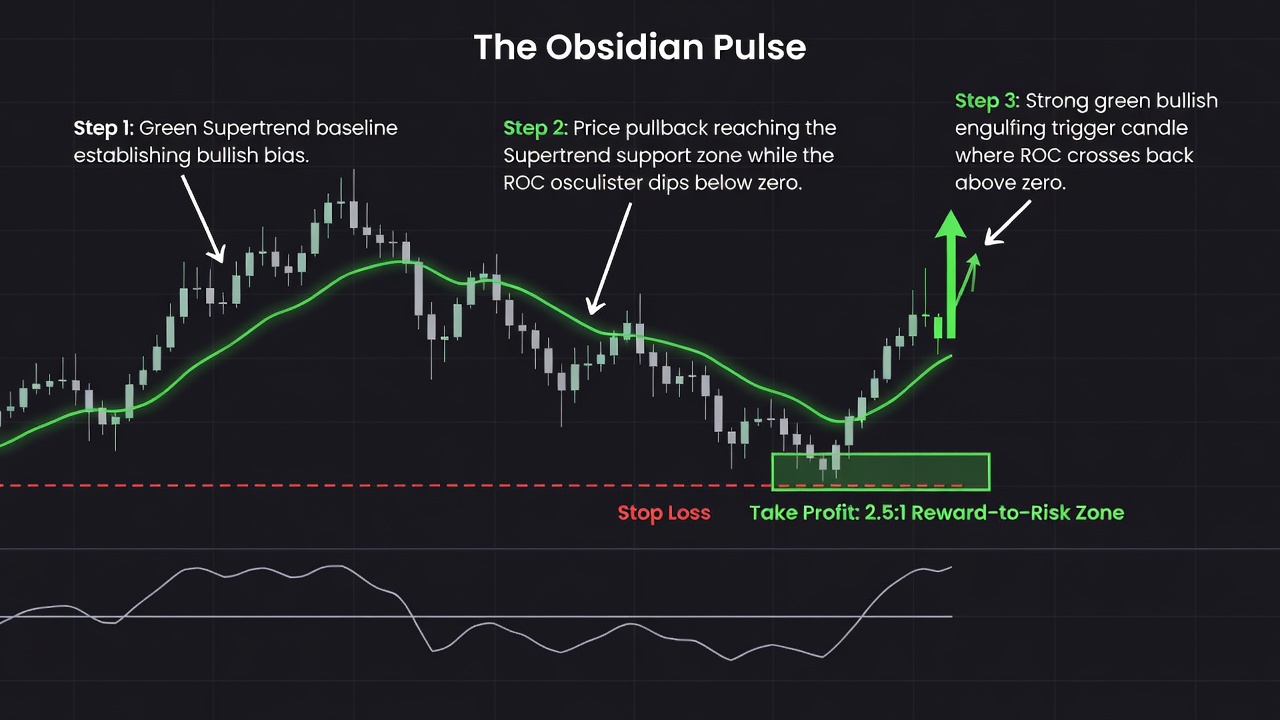
- Step 1: Define Macro Direction (Chart Setup): Load your 15-minute chart with Supertrend (10, 3.0) and ROC (12). First, confirm that the Supertrend line is painted green beneath price, establishing an explicit bullish regime. Price must have logged at least one higher high over the preceding 20 bars to ensure the market is active, not drifting in tight sideways consolidation.
- Step 2: Monitor the Momentum Reset (The Signal): Wait for price to retrace downward toward the green Supertrend baseline. As price pulls back, observe the ROC (12) panel: the oscillator line must cross beneath the zero mark. This drop below zero confirms short-term selling pressure has temporarily pulled momentum away from the primary uptrend without breaking the structural Supertrend support line.
- Step 3: Fire the Execution Trigger (Entry): Watch for a bullish trigger candle (either a crisp pin bar bouncing off the Supertrend line or a full bullish engulfing candle) to close. On that exact candle close, the ROC (12) must cross back above the zero line from below. When both condition criteria match on the close of the candle, place a market buy order at the open of the immediate next bar.
Entry, Stop Loss & Profit Target
Precision execution requires fixed risk controls calculated prior to order entry. Never execute based on estimated levels; calculate precise figures from the trigger candle attributes.
- Long Entry Price: Enter at the open market price of the candle directly following the trigger candle where ROC crossed above zero.
- Stop Loss Placement: Set your hard stop loss 2 to 3 pips (or 2 ticks on futures) below the lower wick of the trigger candle or 3 pips below the Supertrend baseline, whichever value is lower. This gives price breathing room while preserving structural invalidation logic.
- Profit Target Calculation: Calculate your risk distance in pips or points from entry to stop loss. Set Target 1 at a strict 2.0x Risk-to-Reward ratio (2R). Alternatively, set Target 2 at 3.0x R or trail your position behind the Supertrend baseline until price closes on the opposite side of the line.
- Risk Metrics: Expect an average win rate between 58% and 64% when adhering to trend alignment rules, producing strong positive expectancy over 50+ trade samples.
Common Mistakes to Avoid
- Jumping the Signal Before Candle Close: Entering mid-candle while the ROC fluctuates above zero leads to premature fills. Always wait for the trigger bar close to lock in the signal.
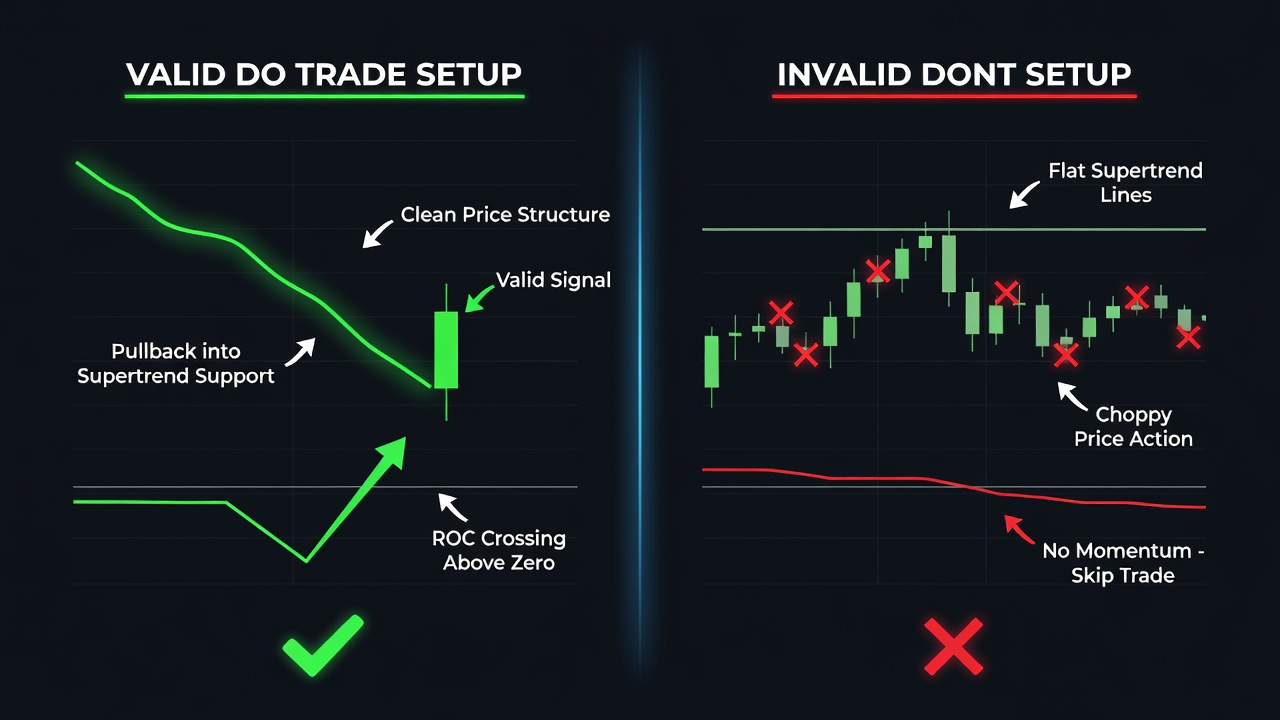
- Trading in Flat or Compressed Baseline Environments: When the Supertrend line moves horizontally for extended periods, the market is in balanced consolidation. Skip all trades until a clear directional slope emerges.
- Ignoring High-Impact News Events: Momentum signals fail rapidly during major economic releases like NFP or FOMC rate decisions. Clear all open positions or abstain from entries 30 minutes before and after Tier-1 news announcements.
- Moving Stop Losses to Breakeven Too Early: Moving your stop loss to entry before price covers at least 1.5R distance frequently causes getting wicked out on normal market retests before the real move takes off.
- Counter-Trend Chasing: Taking short setups while the Supertrend remains green under price destroys statistical edge. Trade exclusively in the direction of the active baseline visual indicator.
Quick Reference Checklist
- Is the Supertrend (10, 3.0) line displaying the correct color for your trade direction (Green for Long, Red for Short)?
- Is price currently trading above the green Supertrend line (for Longs) or below the red line (for Shorts)?
- Has the market created a clean swing structure rather than a flat sideways range over the last 20 bars?
- Did the ROC (12) oscillator successfully cross to the opposite side of the zero line during the pullback phase?
- Has a definitive structural trigger candle (Engulfing or Pin Bar) closed in the direction of the primary trend?
- Did the ROC (12) cross back across the zero line on the exact close of the trigger candle?
- Is your calculated Stop Loss positioned safely beyond structural support or the Supertrend line?
- Does your profit target yield a minimum Reward-to-Risk ratio of 2:1 before key market resistance levels?
Frequently Asked Questions
Q: What is the optimal timeframe for trading The Obsidian Pulse?
A: The 15-minute timeframe offers the ultimate balance between trade frequency and clean signal quality. However, the exact rules apply cleanly to 5-minute charts for scalpers and 4-hour charts for swing traders.
Q: Can I trade this system on crypto assets like Bitcoin or Ethereum?
A: Yes. Because crypto markets exhibit strong momentum trends and sharp mean-reverting pullbacks, The Obsidian Pulse captures crypto swing expansions reliably. Stick to high-liquidity trading pairs to minimize slippage.
Q: What should I do if ROC crosses zero but the candle shape is weak?
A: Pass on the trade. The strategy requires both indicator momentum alignment and price action confirmation. A small, indecisive doji candle indicates lack of aggressive institutional buying, making the setup high risk.
Q: How do I manage trades if price stalls near 1.5R?
A: If price stalls near a major historical key level or high-volume node before hitting your 2R target, lock in risk by moving your stop loss to 0.5R or scaling out half of your position size to secure realized gains.
Free For Traders
One Clear Arrow. Every High-Probability Setup. Free.
The Fusion Indicator combines multiple signals into a single buy/sell arrow on TradingView so you never miss a move.

From Find Better Trades
Only Trade When Momentum Is HEAVILY In Your Favor
The Power Index oscillator measures trend conviction at a glance — it filters out weak, choppy action so you only take the strong moves.

📈 Want More? Join Our Free Trading Community
- Trading Strategy Guides Telegram — daily strategy tips and market insights
- Find Better Trades Telegram — free trade signals delivered to your phone
- Find Better Trades on YouTube — live trade breakdowns and tutorials