The Cobalt Sniper: High-Probability Reversals With HMA & MFI

When retail traders chase breakouts, institutional desks run stops to acquire liquidity at wholesale prices. The Cobalt Sniper turns this exact dynamic into your primary edge by tracking where big players sweep liquidity and combining that footprint with volume-backed momentum resets. Built specifically for active day traders and nimble swing traders on 5-minute to 1-hour timeframes, this system strips away the lag of traditional trend indicators to deliver rapid, surgical entries before mainstream momentum moves kick off.
What Is The Cobalt Sniper?
The Cobalt Sniper is a momentum-reversal system designed to capitalize on false breakouts and failed liquidity runs at critical market structure levels. It exploits the brief exhaustion window created when smart money runs key swing highs or lows, absorbing retail stops before violently reversing price direction. This approach gives day traders and aggressive swing traders an institutional footprint entry with tight, well-defined risk parameters.
Indicators You Need
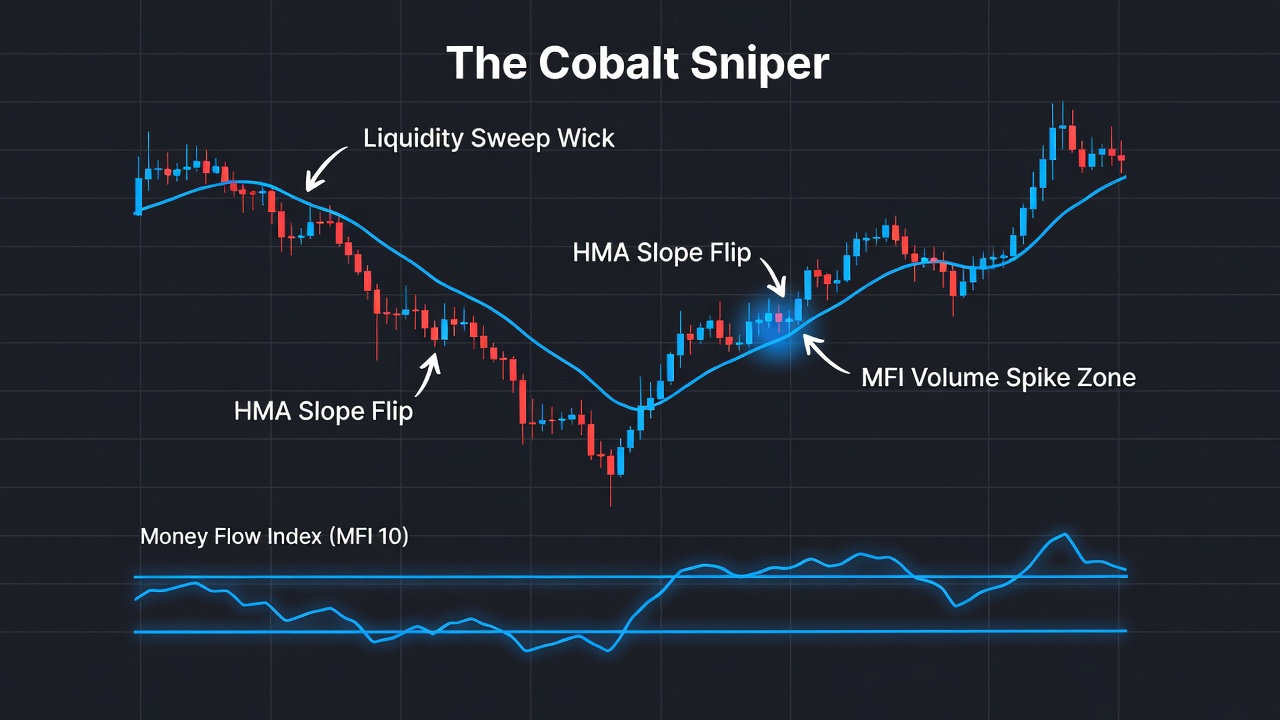
- Hull Moving Average (HMA 21): Set to a 21-period calculation length; this acts as your directional filter and structural pivot trigger by changing slope far faster than a standard EMA without sacrificing smoothing.
- Money Flow Index (MFI 10): Set to a 10-period length with key fixed boundaries at 25 (oversold) and 75 (overbought); this measures both price speed and volume intensity to confirm genuine institutional flow rather than low-volume head-fakes.
- Price Action Liquidity Sweeps: Unfiltered price structure focusing on previous session highs, previous session lows, or distinct equal highs/lows on your trading timeframe.
- Timeframes: Optimized primarily for the 5-minute, 15-minute, and 1-hour charts across Forex pairs, equity indices, and liquid crypto pairs.
The Cobalt Sniper Rules — Step by Step
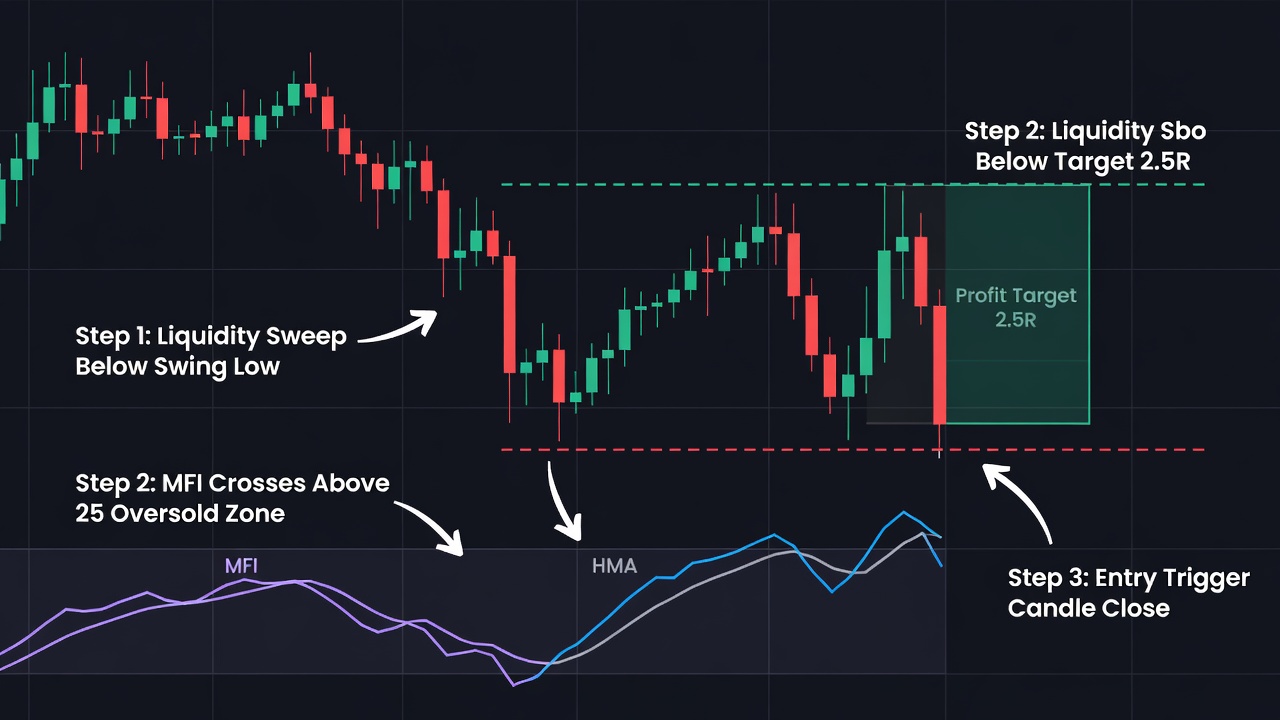
- Chart Setup and Structural Sweep: Mark the most recent key swing high or low on your chart. Price must push beyond this level to sweep liquidity (creating a sharp wick past the structure) while the 21 HMA is still showing the prior trend direction (red for long setups, blue for short setups).
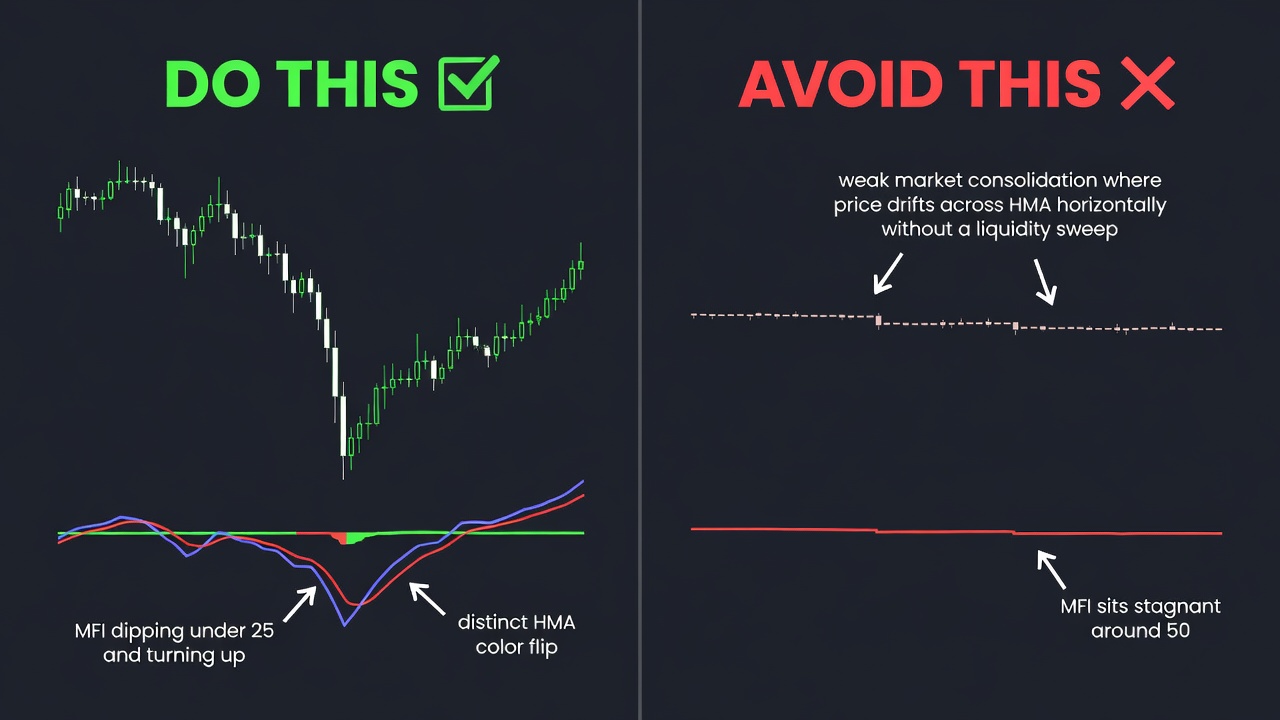
- MFI Volume Reset Signal: As the liquidity sweep occurs, watch the 10 MFI indicator. For a long entry, MFI must dip below 25 (or touch it) and begin hooking upward. For a short entry, MFI must push above 75 (or touch it) and begin hooking downward. This confirms that volume exhaustion has occurred at extreme prices.
- Surgical Trigger Candle: Enter the market immediately upon the close of the first candle that causes the 21 HMA line to flip its slope direction (turning from red to blue for a long trade, or blue to red for a short trade) provided the entry candle itself closes in the direction of the expected move (e.g., a bullish candle close for a buy).
Entry, Stop Loss & Profit Target
Execute your market order instantly at the open of the next bar following your trigger candle close. Never front-run the candle close; wait until the HMA slope lock is finalized on the bar completion. Placing entries early before the bar closes invites unnecessary stop-outs when price wicks against you at the last second.
Place your stop loss exactly 3 to 5 pips beyond the extreme tip of the liquidity sweep wick (the high or low formed during Step 1). This ensures your trade thesis is invalidated only if the market creates a genuine structural breakdown rather than a temporary probe.
Set your primary take profit target using a fixed 2.5:1 reward-to-risk ratio relative to your initial stop distance. Alternatively, scale out 70% of your position at 2.0R and trail the remaining 30% behind the 21 HMA until the indicator changes slope against your position. Typical setups deliver an average risk-to-reward profile ranging from 2:1 up to 3.5:1.
Common Mistakes to Avoid
- Taking Trades in Flat HMA Markets: Avoid entries when the 21 HMA is moving sideways horizontally; the system requires a clear prior angle and an aggressive slope flip to work effectively.
- Ignoring Market Structure Context: Entering off arbitrary MFI readings in the middle of a range without a clear liquidity sweep of a major swing high or low drastically reduces win rate.
- Front-Running the Trigger Close: Entering mid-candle before the current bar closes can lead to false signals if price pulls back and un-flips the HMA slope prior to the candle completion.
- Trading High-Impact News Releases: Executing during non-farm payrolls or rate decisions creates slippage that invalidates tight structural stop loss placements.
- Neglecting MFI Oversold/Overbought Thresholds: Skipping Step 2 and taking HMA color changes without the MFI hitting 25 or 75 limits your edge to simple moving average crosses rather than volume-confirmed reversals.
Quick Reference Checklist
- Is price sweeping a clear, obvious swing high or swing low on the chart?
- Did the sweep wick clean out equal highs/lows or previous session extremes?
- Is the 10 MFI currently coming out of extreme zones (below 25 for buys, above 75 for sells)?
- Has the 21 HMA line officially changed slope and color on bar close?
- Did the trigger candle close firmly in your intended trade direction?
- Is your stop loss set 3 to 5 pips beyond the liquidity sweep extreme point?
- Does the distance to the next major technical hurdle allow at least a 2:1 risk/reward target?
Frequently Asked Questions
Q: Can I trade The Cobalt Sniper on daily charts for swing trading?
A: Yes. The underlying principles of liquidity sweeps and volume-backed momentum shifts work across all timeframes. When trading the daily chart, increase your stop loss buffer from 3-5 pips to 15-20 pips to account for higher structural volatility.
Q: What if MFI reaches 24 but doesn’t quite hit 25 on a long trade?
A: Readings between 20 and 26 are acceptable if the price action displays a violent rejection wick off key structure. However, strictest discipline requires MFI reaching 25 or below to ensure true institutional volume involvement.
Q: Why use Hull Moving Average instead of a standard 20 EMA?
A: Standard EMAs suffer from significant lag, requiring price to move significantly far from the structural pivot before changing direction. The Hull Moving Average uses weighted calculations to reduce lag drastically while maintaining curve smoothness, getting you into the move earlier with tighter risk.
Q: How do I handle trades when the profit target is hit during overnight sessions?
A: Always set limit orders for your profit targets directly with your broker at the time of trade execution. Do not rely on manual management during off-hours, as liquidity thinness can lead to fast spikes and missed exit points.
Free For Traders
Know What To Trade BEFORE The Opening Bell
The Big Dipper Dashboard hands you curated high-probability setups every single morning — free.

From Find Better Trades
When The Coil Is Ready To Explode, You’ll Know
Auto-maps ascending, descending, and symmetrical triangles with breakout alerts the moment price escapes the pattern.

📈 Want More? Join Our Free Trading Community
- Trading Strategy Guides Telegram — daily strategy tips and market insights
- Find Better Trades Telegram — free trade signals delivered to your phone
- Find Better Trades on YouTube — live trade breakdowns and tutorials