Hammer and Shooting Star Strategy: Complete Trading Guide


The hammer and shooting star strategy is a price action trading method that utilizes single-bar reversal candlesticks to identify key turning points at major market extremes. A hammer signal indicates a bullish rejection of lower prices after a markdown, while a shooting star indicates a bearish rejection of higher prices after a markup. This guide teaches traders how to isolate high-probability setups, manage risk precisely, and avoid common false breakouts using structural confluence.
- Hammers form at trend lows with long lower wicks that show aggressive buyer absorption of lower prices.
- Shooting stars form at trend highs with long upper wicks showing heavy seller rejection of higher prices.
- Wick length must measure at least two to three times the height of the real body for valid confirmation.
- Location dictates validity; a standalone candle without structural key level support yields low win rates.
- Risk management relies on placing stops beyond the tip of the tail plus a volatility buffer like ATR.
What Is the Hammer and Shooting Star Strategy?
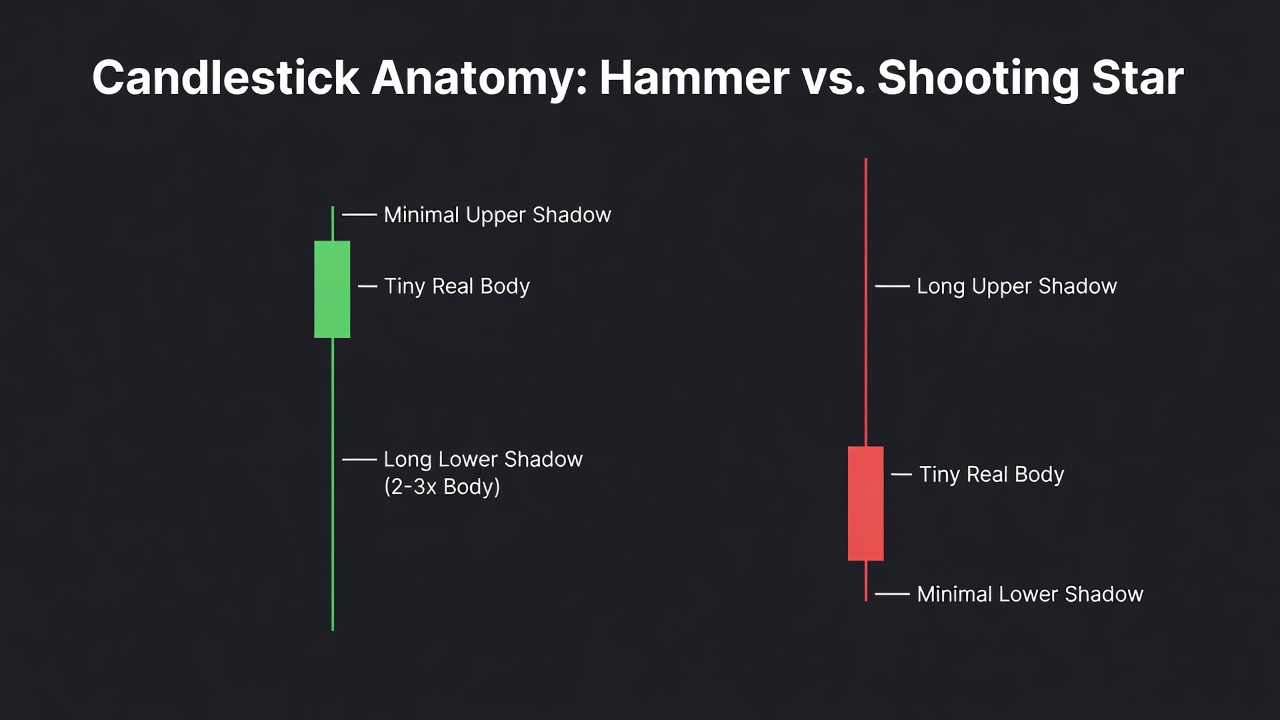
The hammer and shooting star strategy focuses on identifying single-candle price action reversals at key structural levels on a chart. First popularized in Western technical analysis via Steve Nison’s landmark introduction of Japanese candlestick charts, these patterns represent rapid shifts in order flow balance. A hammer candle features a tiny body at the top of its range and a long tail extending downward, occurring after a prolonged down leg. Conversely, a shooting star features a tiny body at the bottom of its range and a long tail extending upward, forming after a sustained up leg. Institutional traders monitor these shapes because they reveal where liquidity pools were swept and aggressively rejected. Without surrounding market structure, these single bars are meaningless noise, but when anchored to key technical levels, they form high-probability entry signals.
The Market Psychology Behind Hammer and Shooting Star Candles
Every hammer and shooting star represents an aggressive trap where market orders exhaust themselves into heavy passive limit orders. In a hammer setup, short sellers press price to new local lows, creating a fresh bearish breakout that entices breakout traders to jump in short. However, institutional buyers step in at lower prices, absorbing all selling pressure with massive limit buy orders and driving price rapidly back up into the candle’s opening range. By the time the candle closes, early short sellers are trapped in underwater positions, forcing them to buy back to cover. In a shooting star, the inverse occurs: enthusiastic buyers push price to new local highs, running into a wall of institutional supply. The sharp drop back down into the close leaves late buyers trapped with long positions, setting off a cascade of stop-loss selling as price breaks lower.
How to Identify the Hammer and Shooting Star on a Chart
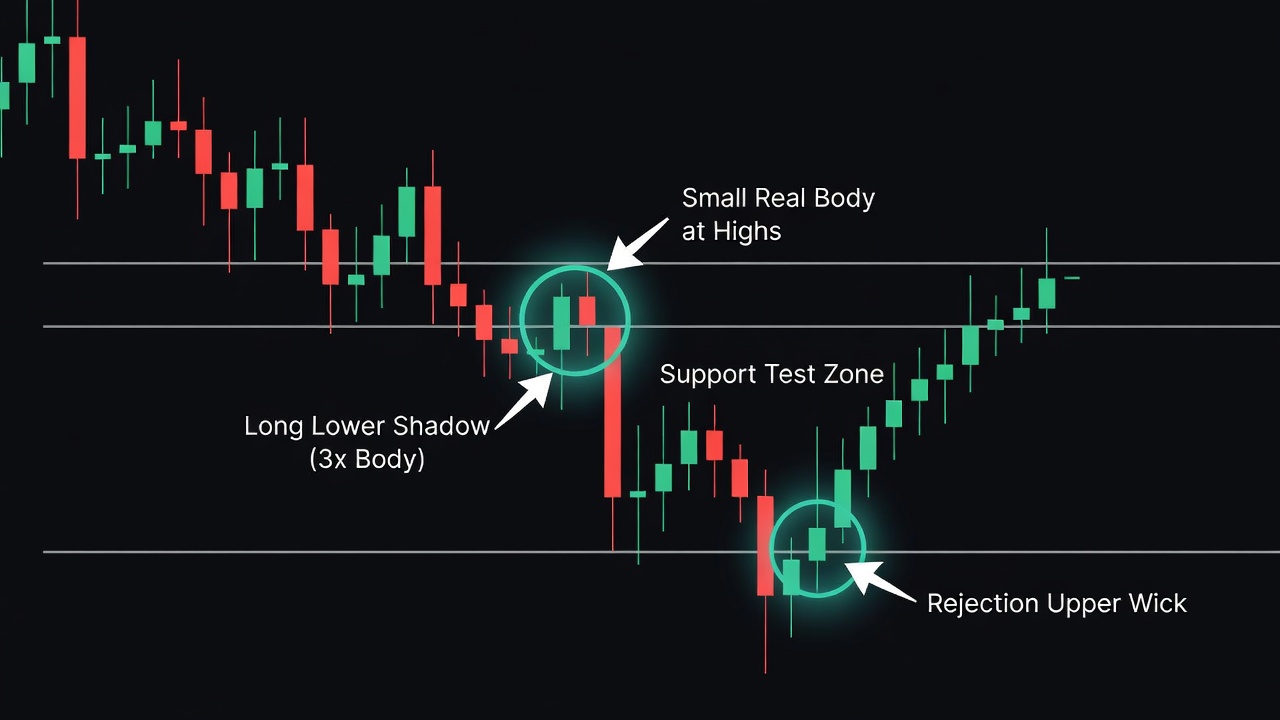
Visual precision is required when identifying valid hammer and shooting star patterns on your price charts. A visual approximation is never sufficient; you must evaluate strict geometric ratios relative to the surrounding price context.
Upper and Lower Wick Ratios
The rejection wick must measure at least two to three times the vertical height of the candle’s real body. For a hammer, the lower shadow must dominate the structure while the upper wick remains tiny or non-existent. For a shooting star, the upper shadow must extend significantly upward while the lower wick stays negligible.
Real Body Size and Position
The real body must sit squeezed tightly at one extreme of the candle’s total range. On a valid hammer, the open and close must reside within the top 25% of the bar’s full high-to-low range. On a valid shooting star, the real body must reside entirely within the bottom 25% of the total bar range.
Candle Color Significance
While body color is secondary to wick length, a matching color adds strong statistical confirmation to the setup. A green (bullish) body on a hammer confirms that buyers pushed price all the way back above the open, showing total dominance. A red (bearish) body on a shooting star proves sellers forced price below the open before the bar closed.
Contextual Placement
A single bar only becomes a valid pattern when it stands directly against an established prior trend. A hammer must follow a clear sequence of lower lows or a sharp impulse move down into major support. A shooting star requires a visible rally or multi-bar push up into key resistance before forming.
The Exact Hammer and Shooting Star Setup Criteria
Executing this strategy successfully requires every trade to clear a strict rulebook before placing an order.
- Timeframe Selection: Focus primary execution on the 1-hour, 4-hour, or Daily timeframes where market noise is minimal.
- Prior Trend Requirement: The setup requires a clear directional push of at least 3 to 5 consecutive candles leading directly into the pattern bar.
- Wick-to-Body Ratio: The rejection shadow must be at least twice the size of the real body, with minimal opposite shadow.
- Key Level Confluence: The tail of the candle must test and reject a higher-timeframe support or resistance level, supply/demand zone, or major moving average.
- Volume Expansion: The volume bar accompanying the trigger candle should exceed the 20-period volume moving average, confirming institutional participation.
How Do You Trade the Hammer and Shooting Star? (Entry, Stop Loss, Target)
Trading the hammer and shooting star effectively requires systematic execution across entry, risk placement, and profit targets. Reckless execution on market orders without defined exit rules will destroy your statistical edge over time.
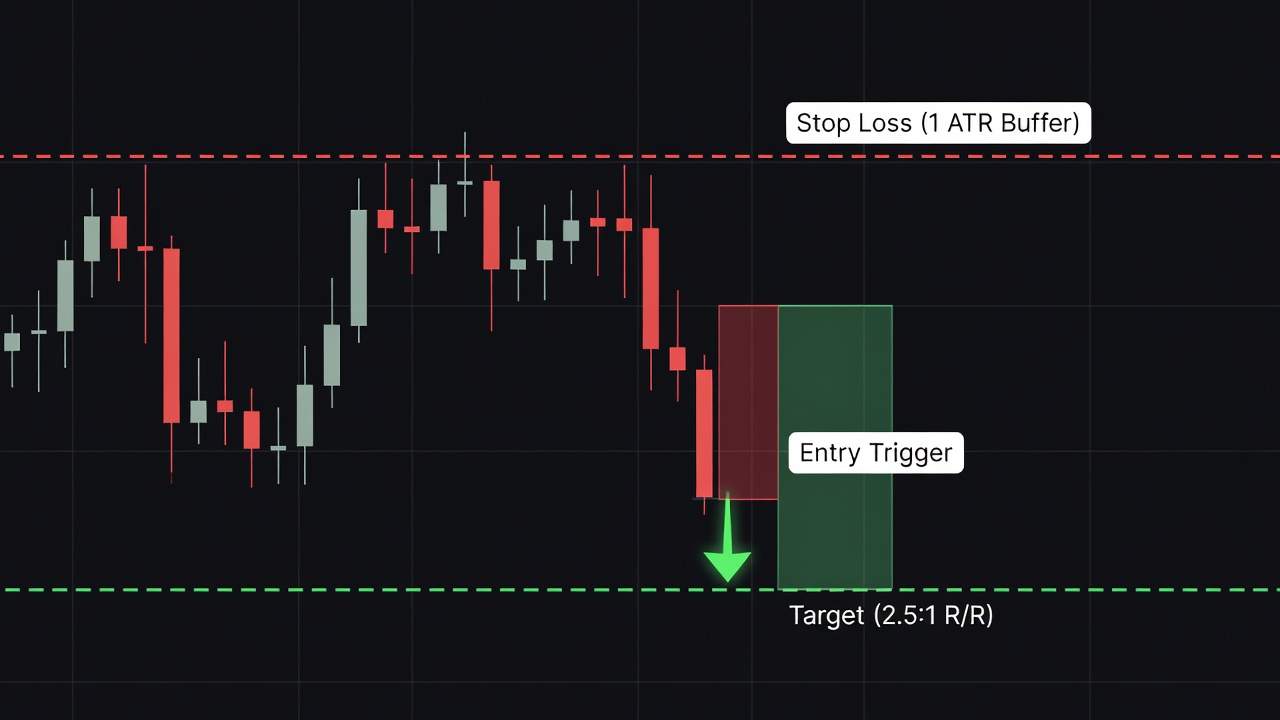
Entry Mechanics: You have two robust options for entry. The aggressive method enters on the market open of the bar immediately following the completed pattern candle. The conservative method places a stop-entry order slightly beyond the extreme of the pattern bar (above the hammer’s high for long, or below the shooting star’s low for short), triggering only when momentum confirms in your direction.
Stop Loss Placement: Never place your stop loss directly at the wick extreme, as market noise will regularly run those obvious levels. Instead, anchor your stop loss exactly 1 Average True Range (ATR) beyond the absolute high of the shooting star wick or the low of the hammer wick. This buffer protects your trade against structural sweeps before the real expansion unfolds.
Profit Targets and R:R: Set your initial target (TP1) at the nearest key swing high or swing low on your chart, securing a minimum 2:1 Reward-to-Risk ratio. Set a secondary target (TP2) at a major higher-timeframe liquidity level or run a trailing stop behind consecutive swing points to capture extended trends.
Free For Traders
Know The EXACT Moment A Stock Hits Support Or Resistance
Real-time alerts fire the instant a stock approaches a critical level. Completely free.

Hammer and Shooting Star Trade Example: Step-by-Step
Let us walk through an end-to-end execution of a shooting star trade setup on a 1-hour chart. The market had been in a strong intraday rally over six consecutive sessions, pushing price straight into a major daily resistance zone that previously sparked an aggressive selloff. As price touched the resistance level, buying momentum suddenly stalled, forming an extended upper wick.
Step 1: Pattern Identification. As you can see in the annotated chart above, the 1-hour candle formed a textbook shooting star directly at the multi-week resistance level. The upper wick was three times longer than the small red body, which closed in the lower 20% of the bar’s range. Volume on this candle spiked to 1.5 times the 20-period volume average, indicating institutional distribution.
Step 2: Strategy Execution. We placed a sell-stop order two pips below the low of the shooting star bar to confirm downside continuation. Our stop loss was set 1 ATR (18 pips) above the upper wick tip to shield against volatility spikes. Risk was capped at exactly 1% of total account equity.
Step 3: Outcome and Management. The next bar broke below the shooting star low, triggering our short entry. Price immediately broke down toward the first logical support level at the previous daily swing low. Within four hours, price reached our target zone, yielding a clean 3.2:1 Reward-to-Risk payoff before consolidating.
Hammer and Shooting Star Across Different Timeframes
The visual clarity and reliability of hammers and shooting stars scale directly with the timeframe you analyze. Understanding timeframe nuances prevents getting whipsawed by lower-timeframe noise.
Intraday Charts (5-Minute to 15-Minute): On lower timeframes, hammers and shooting stars occur frequently, but high noise levels lead to numerous false signals. These bars often reflect temporary order flow imbalances rather than major institutional shifts. Only trade them on low timeframes if they align directly with higher-timeframe key levels during peak market session hours.
Intermediate Charts (1-Hour to 4-Hour): The 1-hour and 4-hour charts offer the ideal sweet spot for swing traders and day traders alike. Noise is filtered out, yet trade opportunities remain frequent enough to compound returns quickly. Rejection wicks on these timeframes represent genuine institutional liquidity absorption.
Macro Charts (Daily and Weekly): Daily and weekly hammer and shooting star candles are among the most reliable signals in technical analysis. When a daily candle closes with a massive rejection tail at a multi-month structural level, major market trends often pivot for weeks or months. Reward-to-risk potential is highest here, though setups take longer to form.
Hammer and Shooting Star vs. Inverted Hammer and Hanging Man: Key Differences
Traders often confuse these four single-candle patterns because they share structural geometries with subtle structural variations. Knowing how location and wick direction alter market context is vital.
Hammer vs. Hanging Man
While both patterns share identical geometry—a tiny body with a long lower wick—their market context makes them completely opposite signals. A hammer appears at the end of a downtrend and signals a bullish reversal upward. A hanging man appears at the end of an uptrend, warning that selling pressure is beginning to overwhelm buyers despite the bullish location, signaling potential top distribution.
Shooting Star vs. Inverted Hammer
Both patterns feature a tiny body squeezed at the bottom with a long upper wick, but context changes their entire meaning. A shooting star forms after an uptrend at key resistance, serving as a powerful bearish reversal trigger. An inverted hammer appears at the bottom of a downtrend, signaling that buyers attempted an aggressive push that failed to hold, but nevertheless proved buying interest is returning to the market.
Best Confluences to Stack With Hammer and Shooting Star Candles
Trading isolated candles is a path to poor win rates; stacking structural confluences creates an institutional edge.
Horizontal Support and Resistance: Aligning a hammer lower wick or shooting star upper wick with a historical multi-touch horizontal boundary increases signal win rates dramatically by ensuring high-density limit order participation.
50 and 200 EMAs: Dynamic moving averages act as strong trend continuation boundaries; a hammer bouncing off a rising 50 EMA in an uptrend offers an exceptionally high-probability pullback trigger.
Session VWAP (Volume Weighted Average Price): Institutional traders baseline fair value using VWAP; a shooting star rejecting VWAP from above indicates aggressive institutional shorting pressure.
Volume Spikes: High relative volume on the pattern candle confirms that smart money actively defended the price level, absorbing all opposing retail liquidity.
Prior Day High/Low Sweeps: When a hammer sweeps beneath the prior day’s low before closing firmly back above it, it executes a classic liquidity run that traps breakdown sellers.
Common Hammer and Shooting Star Mistakes to Avoid
Mastering this setup requires eliminating structural trading mistakes that drain trader capital.
- Trading signals in middle-of-nowhere consolidation rather than waiting for price to interact with key support or resistance boundaries.
- Entering on active, unclosed candles before the period finishes, only to watch the rejection wick disappear before the close.
- Ignoring the overarching trend context by taking bullish hammers during aggressive higher-timeframe downtrends without major structural backing.
- Placing stop losses directly at the wick tip without adding an ATR buffer to protect against secondary liquidity sweeps.
- Accepting setups with stubby wicks where shadow length fails to meet the minimum 2:1 ratio relative to real body size.
- Failing to account for high-impact economic news releases that can invalidate technical price patterns in seconds.
From Find Better Trades
Know Exactly Where The Big Money Steps In
Auto-plots institutional support & resistance zones from pure price action — no more guessing at levels.

Hammer and Shooting Star Checklist
Run through this binary checklist before executing any hammer or shooting star setup.
- Is the pattern candle fully closed on your charting platform?
- Is the rejection wick at least two times larger than the real body?
- Is the real body located within the outer 25% boundary of the total candle range?
- Is the candle anchored directly to a major support, resistance, or moving average level?
- Does the setup provide at least a 2:1 Reward-to-Risk ratio to the first logical target?
- Is your stop loss offset by at least 1 ATR beyond the extreme wick tip?
Frequently Asked Questions About Hammer and Shooting Star Candles
Which candle color is better for a hammer pattern?
A bullish (green) body provides stronger confirmation for a hammer pattern than a bearish body. While both show rejection of lower prices, a green body proves buyers managed to push price higher than where the session opened. However, lower wick length and key level placement remain far more critical than color alone.
What is the success rate of a shooting star pattern?
The standalone success rate of a shooting star pattern hovers around 50%, but jumps significantly when combined with key structural levels. When stacked with higher-timeframe resistance, declining volume on the approach, and a volatility-based stop loss, historical backtests show success rates exceeding 65% with favorable risk-reward ratios.
Can you trade hammers and shooting stars on a 5-minute chart?
Yes, you can trade them on a 5-minute chart, but false signals occur far more frequently due to market noise. Lower timeframes require strict confluence with daily/4-hour levels and execution exclusively during high-volume market opens to maintain profitability.
Where should I place my stop loss on a hammer trade?
Place your stop loss approximately 1 ATR (Average True Range) below the lowest point of the hammer’s long lower wick. Setting your stop directly on the tip leaves you vulnerable to market spread widening and secondary liquidity sweeps before the intended move takes off.
📈 Want More? Join Our Free Trading Community
- Trading Strategy Guides Telegram — daily strategy tips and market insights
- Find Better Trades Telegram — free trade signals delivered to your phone
- Find Better Trades on YouTube — live trade breakdowns and tutorials