Complete Guide to Hammer and Shooting Star Candlestick Trading

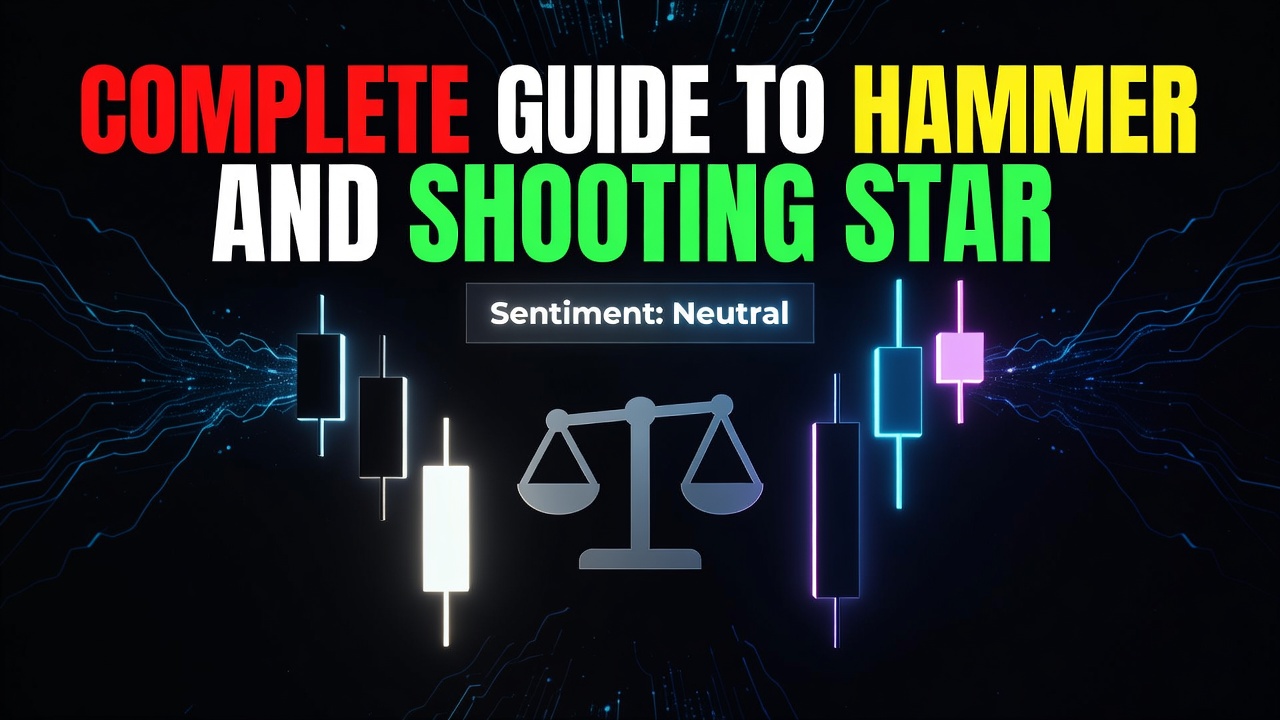
The hammer and shooting star strategy is a single-candle price action trading framework designed to spot structural trend reversals at key market levels. A hammer forms during a markdown phase when sellers push price sharply lower before aggressive buyers step in to force a close near the session high. Conversely, a shooting star occurs during a markup phase when buyers drive price to new highs before sellers overwhelm the market and force a close near the low.
- Hammer candles signal bullish rejection of lower prices following an established downtrend.
- Shooting star candles signal bearish rejection of higher prices following an established uptrend.
- The shadow (wick) of both patterns must be at least twice the height of the real body.
- Location dictates validity; a hammer or shooting star inside a consolidated range offers zero statistical edge.
- Execution requires pairing these candle signals with confluent technical anchor points like support/resistance, VWAP, or moving averages.
What Is the Hammer and Shooting Star Pattern?
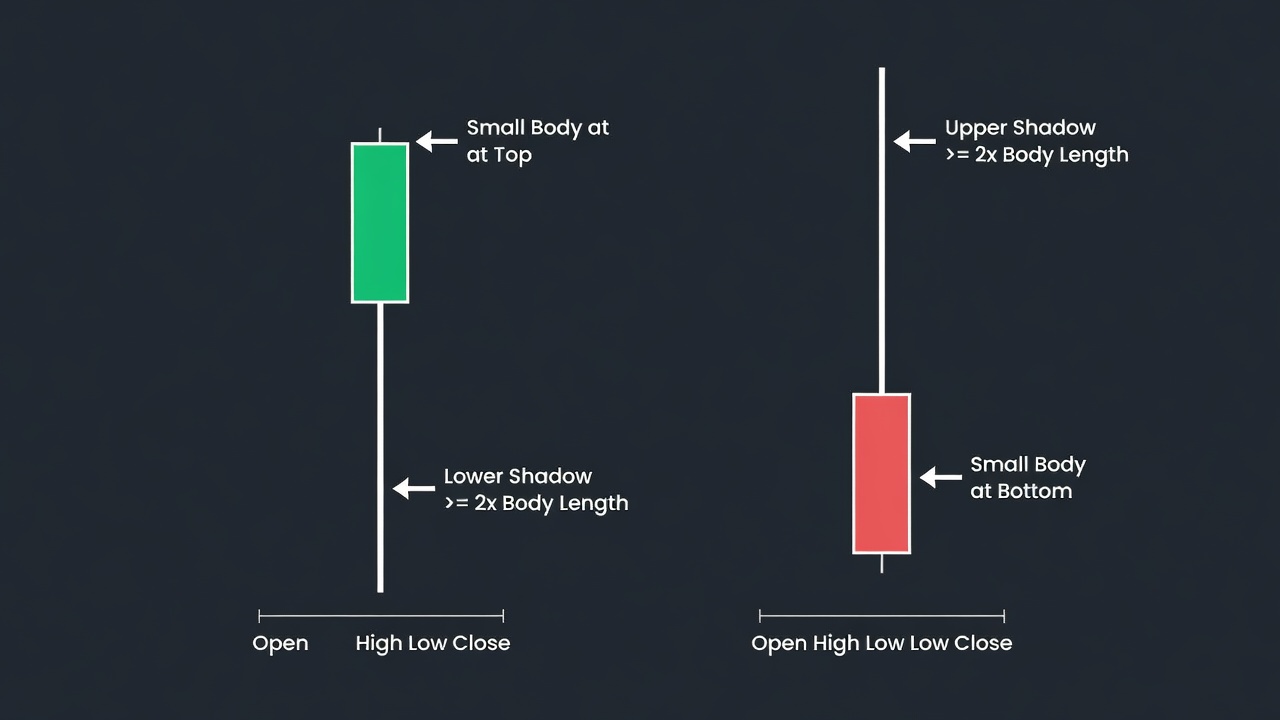
The hammer and shooting star are single-bar price action patterns that signal immediate liquidity rejections and sharp shifts in market control. Documented formally in Japanese rice trading literature centuries ago and popularized in Western technical analysis by Steve Nison, these candlestick shapes isolate the exact moment aggressive market participants exhaust their momentum. A hammer features a small real body positioned at the top of the price range with a long lower shadow, while a shooting star features a small real body at the bottom of the price range with a long upper shadow. Both patterns are visual representations of a failed auction where one side of the order book ran out of market orders, allowing the opposing side to completely reverse intrabar momentum.
The Market Psychology Behind Hammer and Shooting Star Candles
Every hammer and shooting star tells a story of trapped traders and sudden order flow imbalances. To understand why these candles work, you have to look past the chart drawing and analyze the underlying order execution. Take a hammer candle in a downtrend: sellers are comfortably in control, driving the market lower to initiate new short positions and triggering stop-loss sell orders beneath prior swing lows. But at the bottom of that extended move, institutional limit buy orders absorb the selling volume. As market sell orders run out, buyers launch an aggressive counter-attack with market buy orders, forcing price all the way back up to close near the open. Every short trader who entered on the breakdown is suddenly trapped in a losing position, creating a short squeeze that fuels the subsequent rally. The shooting star works identically in reverse, trapping breakout buyers at high prices who are then forced to sell as price crashes back down to the bar’s open.
How to Identify the Hammer and Shooting Star on a Chart
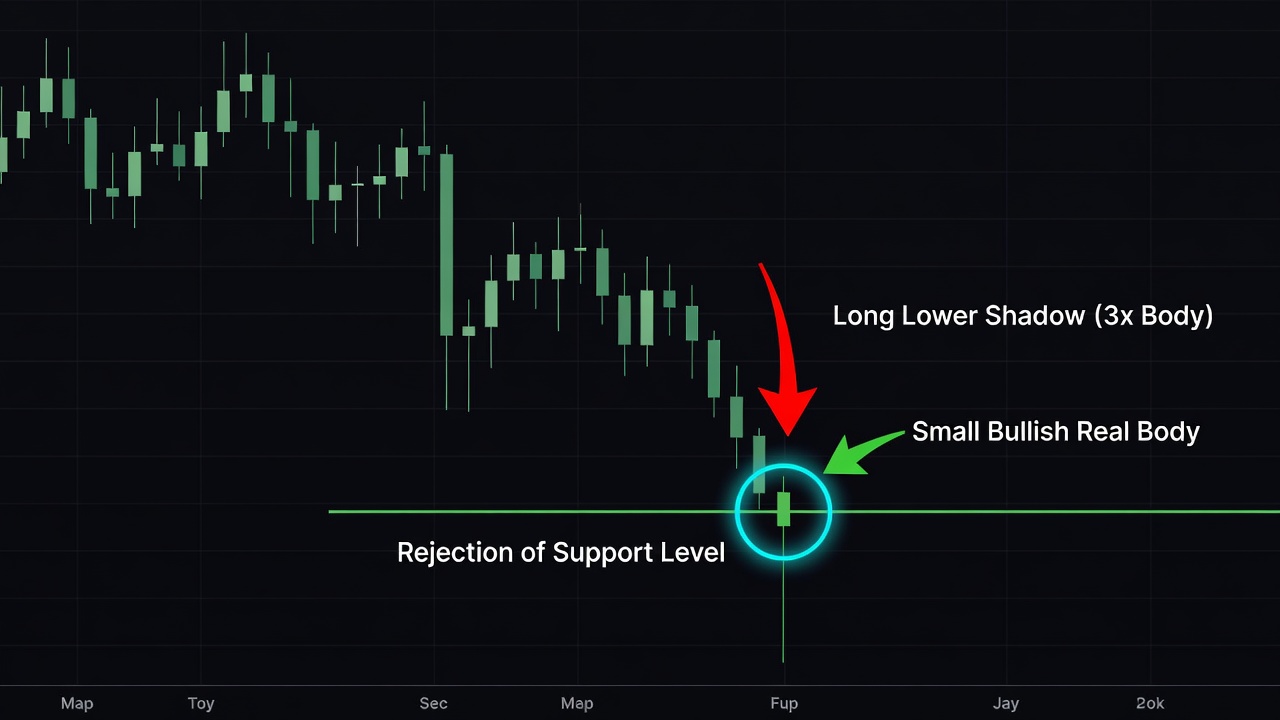
Accurate pattern recognition requires strict quantitative rules rather than visual guessing. Most retail traders fail with price action because they label every single small-bodied candle with a long wick as a hammer or shooting star. You need strict dimensional metrics to verify structural integrity.
The Real Body Dimension
The real body must occupy no more than 30% of the candle’s total vertical range. The body represents the net distance between the opening and closing prices. A small body indicates that despite high volatility during the bar’s session, the market closed near where it opened. While a green (bullish) body on a hammer and a red (bearish) body on a shooting star offer slightly higher statistical follow-through, body color is secondary to the shadow length and location.
The Shadow Ratio
The primary wick (rejection tail) must be at least two to three times the length of the real body. For a hammer, this long lower shadow proves that sellers attempted a significant push lower but were completely turned back. For a shooting star, the long upper shadow proves that buyers pushed price aggressively higher before being overwhelmed by supply. The opposing shadow (the nose) should be minimal or completely non-existent.
Prior Trend Context
A hammer must follow a clear series of lower lows, and a shooting star must follow higher highs. Isolated candles in sideways chop are meaningless noise. A hammer requires a preceding bearish swing of at least three to five bars to prove market displacement before the rejection occurs. Likewise, a shooting star requires a preceding bullish swing to ensure there is actually a trend to reverse.
The Exact Hammer and Shooting Star Setup Criteria
Do not trade a single candle pattern in isolation; enforce a mandatory checklist before entering any position.
- Contextual Trend: The market must show an established trend over the prior 3 to 10 bars (a sequence of lower highs/lows for a hammer; higher highs/lows for a shooting star).
- Timeframe Selection: Focus on 1-Hour, 4-Hour, or Daily charts for high-probability swing trades. Intraday timeframes below 15-minutes generate excessive false signals due to order flow noise.
- Proportional Anatomy: The tail wick must measure at least 2x the vertical height of the real body, and the real body must sit entirely in the upper 30% (hammer) or lower 30% (shooting star) of the total bar range.
- Key Structural Location: The tip of the wick must test and reject a major high-higher timeframe support or resistance zone, key moving average, or market profile value area.
- Volume Spike: The volume on the signal candle should be noticeably higher than the 20-period volume moving average, confirming institutional participation during the rejection.
How Do You Trade the Hammer and Shooting Star? (Entry, Stop Loss, Target)
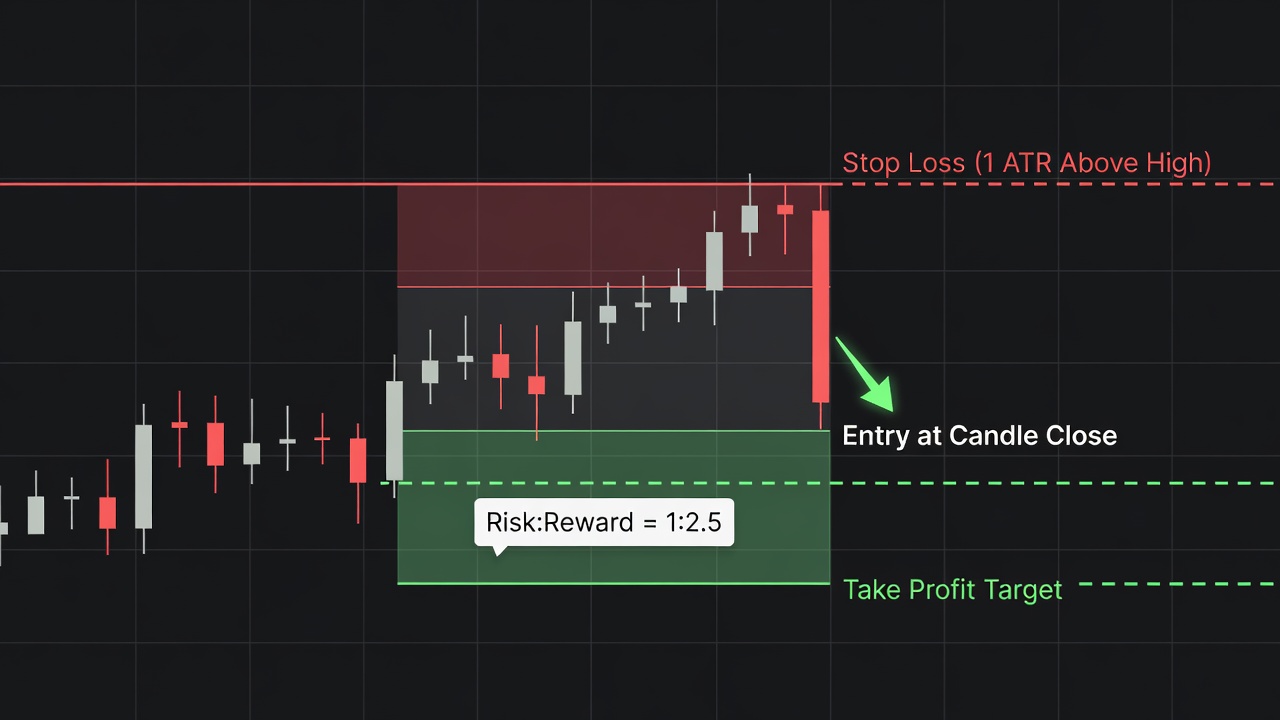
Precision execution separates profitable price action traders from account-blowers. When you spot a valid hammer or shooting star, you have two primary entry methods: a direct market entry on the close of the signal candle, or a limit entry on a 50% retracement of the candle’s wick. The limit entry grants a tighter stop loss and superior risk-to-reward ratio, though you risk missing fast-moving market explosions.
Your stop loss placement must always be anchored beyond the extreme wick of the pattern. For a hammer trade, set your stop loss 1 Average True Range (ATR) or 3-5 pips/ticks below the lowest point of the lower shadow. This gives the trade breathing room in case of a secondary liquidity sweep while protecting you if the rejection fails completely. For a shooting star, place the stop 1 ATR or 3-5 pips/ticks above the extreme high of the upper shadow.
Establish profit targets based on opposing key structural levels rather than arbitrary monetary goals. Set Target 1 at the nearest prior swing high (for hammers) or swing low (for shooting stars), where counter-trend orders typically sit. Set Target 2 at a major higher-timeframe liquidity level or run a trailing stop using a 20-period exponential moving average (EMA). Always ensure the distance from entry to Target 1 provides a minimum Risk-to-Reward ratio of 1:2.
Free For Traders
Know What To Trade BEFORE The Opening Bell
The Big Dipper Dashboard hands you curated high-probability setups every single morning — free.

Hammer and Shooting Star Trade Example: Step-by-Step
Let us walk through a real-world institutional short trade using a shooting star setup on the 4-Hour timeframe.
Assume the market has been climbing steadily over several days, making a series of higher highs and higher lows. Price approaches a major daily resistance level that previously acted as a distribution zone three weeks prior. As price enters this zone, retail buyers aggressively jump into breakout long positions, anticipating a major continuation.
As you can see in the annotated chart above, the 4-Hour bar opens and immediately surges past the prior high. However, the move runs straight into institutional sell orders parked at resistance. Within two hours of the bar’s open, sellers crush the breakout, dragging price lower. The bar closes near its absolute low, forming a textbook shooting star with a small red real body and an upper shadow measuring three times the body’s height. Volume on the bar spikes 40% above the 20-bar average.
You execute a short position immediately upon the 4-Hour bar closing. Your entry price fills at 150.00. You calculate 1 ATR (0.80 points) and set your stop loss above the shooting star’s high wick at 152.30, risking 2.30 points per unit. You identify the primary swing low support level at 143.10 as your profit target, offering a potential gain of 6.90 points. This yields a mathematically sound 1:3 Risk-to-Reward profile. Over the next six bars, price breaks down violently as trapped buyers liquidate, reaching your take-profit target for a clean, fully executed win.
Hammer and Shooting Star Across Different Timeframes
The core geometry of the hammer and shooting star stays identical across timeframes, but signal reliability changes dramatically. Higher timeframes require significantly more capital to create a candle print, making daily and weekly signals vastly more dependable than intraday equivalents.
On 1-minute and 5-minute charts, hammers and shooting stars appear constantly. Most of these lower-timeframe prints are the product of minor market-maker spread adjustments or algorithmic noise rather than true structural shifts. If you trade them without higher-timeframe alignment, you will suffer severe slippage and low win rates.
On the 1-Hour and 4-Hour charts, these patterns strike an optimal balance between signal frequency and reliability. They clearly reflect multi-session order flow battles and offer clean, actionable swing trade entries with manageable risk parameters. On the Daily and Weekly charts, a hammer or shooting star is a major macro event. These candles often mark multi-month market tops and bottoms, providing the foundation for massive trend-following positions.
Hammer vs. Inverted Hammer: Key Differences
Traders constantly confuse the standard hammer with the inverted hammer because both appear after a market decline. Structural clarity on these two patterns prevents critical order execution errors.
The Bullish Hammer
A bullish hammer features a long lower shadow and a small body at the top of the range. It shows that sellers pushed price lower during the bar, but buyers completely reversed that price action before the close. It demonstrates direct, immediate buying strength and rejection of lower price levels within that specific bar timeframe.
The Inverted Hammer
An inverted hammer features a long upper shadow and a small body at the bottom of the range following a downtrend. Visually, it looks exactly like a shooting star, but its location after a market decline changes its interpretation. It shows that buyers attempted to push price higher, but sellers pushed it back down. Because the close occurred near the bottom of the bar, an inverted hammer requires explicit bullish confirmation on the subsequent candle (like a strong green bar closing above the inverted hammer’s high) before taking a trade.
Best Confluences to Stack With Hammer and Shooting Star Signals
Never trade single candlestick patterns in a vacuum; stack technical confluences to construct an unbeatable trade location.
- Horizontal Support and Resistance: A hammer hitting an established multi-touch support zone dramatically increases the likelihood that limit buyers will defend that exact level.
- Moving Average Rejections: A shooting star pulling back into a downward-sloping 50 EMA or 200 EMA provides dynamic trend confirmation alongside the single-bar price rejection.
- VWAP (Volume Weighted Average Price): An intraday shooting star rejection at the upper VWAP standard deviation band confirms that price moved into an overbought condition relative to volume distribution.
- Fibonacci Retracement Levels: When a hammer’s long lower shadow ticks directly into a 61.8% or 78.6% Fibonacci golden ratio level, retail algorithms and institutional desks execute simultaneously.
- Volume Profile High Volume Nodes (HVN): Rejections occurring right at the boundary of a low volume node returning into a high volume node confirm acceptance back into value.
Common Hammer and Shooting Star Mistakes to Avoid
Steer clear of these classic execution traps that derail developing price action traders.
- Trading in the Middle of Nowhere: Entering a hammer or shooting star that forms in open space without support, resistance, or moving average confluence.
- Front-Running the Close: Placing an entry order before the candlestick officially closes. Intrabar wicks can change completely in the final seconds of a candle period.
- Ignoring Trend Context: Shorting a shooting star that prints during a parabolic runaway bull market. Strong trends break single-candle resistance patterns easily.
- Setting Stops Too Tight: Placing stop losses right at the tip of the wick without factoring in market spread or Average True Range volatility padding.
- Miscalculating Risk-to-Reward: Taking entries where the nearest opposing resistance level is too close, resulting in a suboptimal Risk-to-Reward ratio under 1:1.5.
From Find Better Trades
Know Exactly Where The Big Money Steps In
Auto-plots institutional support & resistance zones from pure price action — no more guessing at levels.

Hammer and Shooting Star Checklist
Run through this mandatory pass/fail verification before entering any trade.
- Is the pattern printing on an actionable timeframe (15m, 1H, 4H, Daily)?
- Is there a clear, pre-existing trend leading into the candle pattern?
- Does the primary wick measure at least two times the total height of the real body?
- Is the real body located entirely in the top 30% (hammer) or bottom 30% (shooting star) of the total range?
- Is the candle making contact with a clear, higher-timeframe technical structure (S/R, EMA, VWAP)?
- Has the candle fully closed on your charting software?
- Does the distance to your target level yield a Risk-to-Reward ratio of at least 1:2?
Frequently Asked Questions About Hammer and Shooting Star
What is the success rate of a hammer candlestick pattern?
A hammer candlestick pattern isolated by itself yields roughly a 50% win rate. However, when traded strictly at key support levels with volume confirmation and favorable trend context, the win rate increases significantly to roughly 60-65% with positive risk-to-reward metrics.
Does the color of the candle body matter for hammers and shooting stars?
Candle body color is secondary to the long wick and chart location, but it offers extra confirmation. A green body on a hammer shows that buyers pushed price past the open, making it slightly more bullish than a red hammer. A red body on a shooting star shows sellers closed below the open, making it slightly more bearish.
Where should you place your stop loss when trading a shooting star?
Place your stop loss slightly above the highest point of the shooting star’s upper shadow. To avoid getting stopped out by market spread or brief liquidity probes, add a buffer of 1 Average True Range (ATR) or a few pips above the wick tip.
What is the difference between a shooting star and an inverted hammer?
The difference lies entirely in the prior trend context. A shooting star forms at the top of an uptrend and signals a bearish reversal, whereas an inverted hammer forms at the bottom of a downtrend and signals a potential bullish reversal.
📈 Want More? Join Our Free Trading Community
- Trading Strategy Guides Telegram — daily strategy tips and market insights
- Find Better Trades Telegram — free trade signals delivered to your phone
- Find Better Trades on YouTube — live trade breakdowns and tutorials