Mastering the Hammer and Shooting Star Candlestick Strategy


The hammer and shooting star candlestick strategy is a price action system that identifies high-probability trend reversals using single-bar price rejections. A hammer signals a bullish reversal at the end of a downtrend, while a shooting star marks a bearish reversal at the peak of an uptrend. This guide breaks down how active traders scan, validate, and execute these setups with strict risk controls.
- Hammers signal bullish rejection at key support, while shooting stars indicate bearish rejection at key resistance.
- A valid hammer or shooting star requires a shadow at least two to three times the height of the real body.
- Never trade single candles in isolation; always align them with macro trend context and key price levels.
- Place stop losses beyond the extreme wick tip with a small volatility buffer to avoid spread hunts.
- Higher timeframes like the 1-hour, 4-hour, and daily charts provide significantly higher win rates than intraday noise.
What Is the Hammer and Shooting Star Candlestick Strategy?
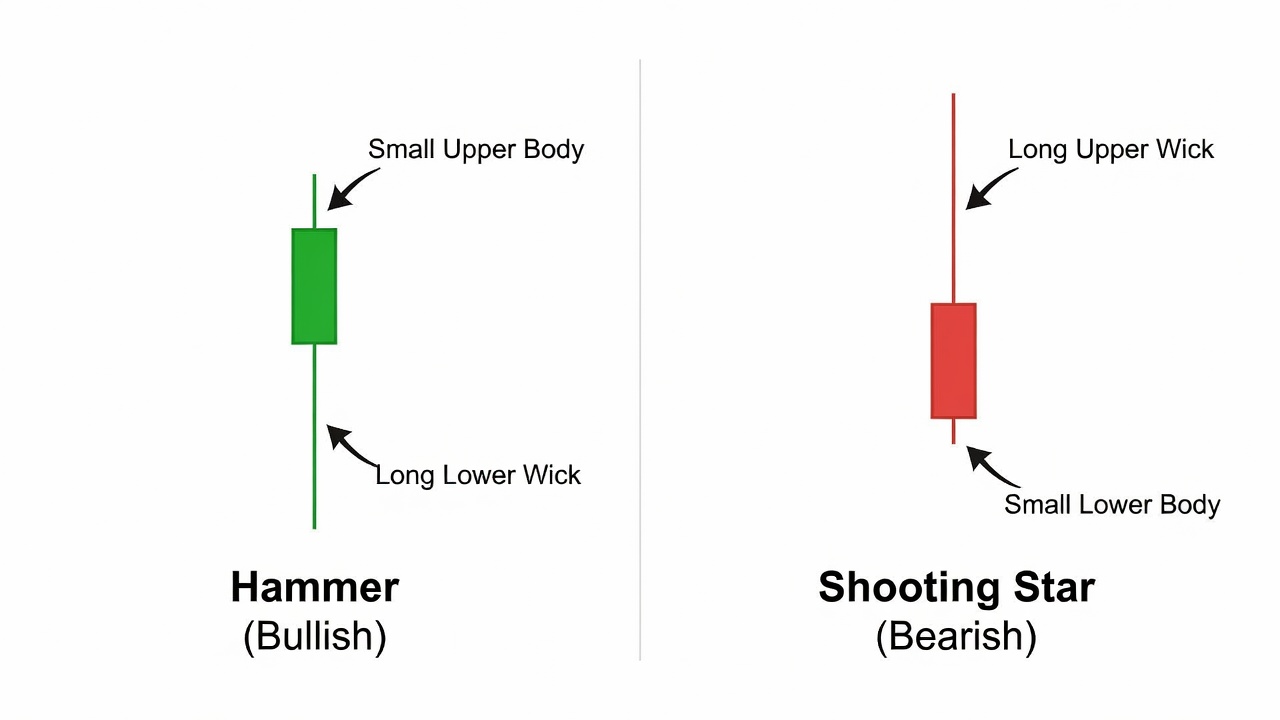
The hammer and shooting star strategy utilizes single-bar price action rejections to trade high-probability market turns. First popularized in Western technical analysis by Steve Nison in his foundational work on Japanese candlestick charts, these visual patterns highlight immediate shifts in order flow. A hammer forms when price opens, sells off aggressively, and then rallies back to close near the high, leaving a long lower shadow. A shooting star forms when price opens, rallies sharply, and then crashes back down to close near the low, leaving a long upper shadow. Traders use these candles because they provide unambiguous visual evidence that one side of the market ran out of liquidity and lost control.
The Market Psychology Behind Hammer and Shooting Star Signals
Hammer and shooting star candlesticks expose an aggressive failed breakout where one side of the market gets caught off guard. In a hammer formation, sellers are firmly in control early in the session, pushing price down to test lower levels. However, as price hits an influx of institutional buy orders or short-covering liquidity, buyers forcefully absorb the supply and push price back up to the top of the range. This leaves aggressive short sellers trapped at the bottom, forcing them to buy back their positions and driving prices higher.
Conversely, a shooting star represents a failed bullish breakout. Buyers drive the price aggressively higher during the session, creating the illusion of a strong upward push. As price reaches overhead resistance, institutional sellers dump inventory or aggressive short sellers enter the market. The surge of sell orders overwhelms buyer demand, forcing price all the way down to close near the session low. Trapped buyers are forced to liquidate their long positions at a loss, fueling further downside momentum.
How to Identify the Hammer and Shooting Star on a Chart
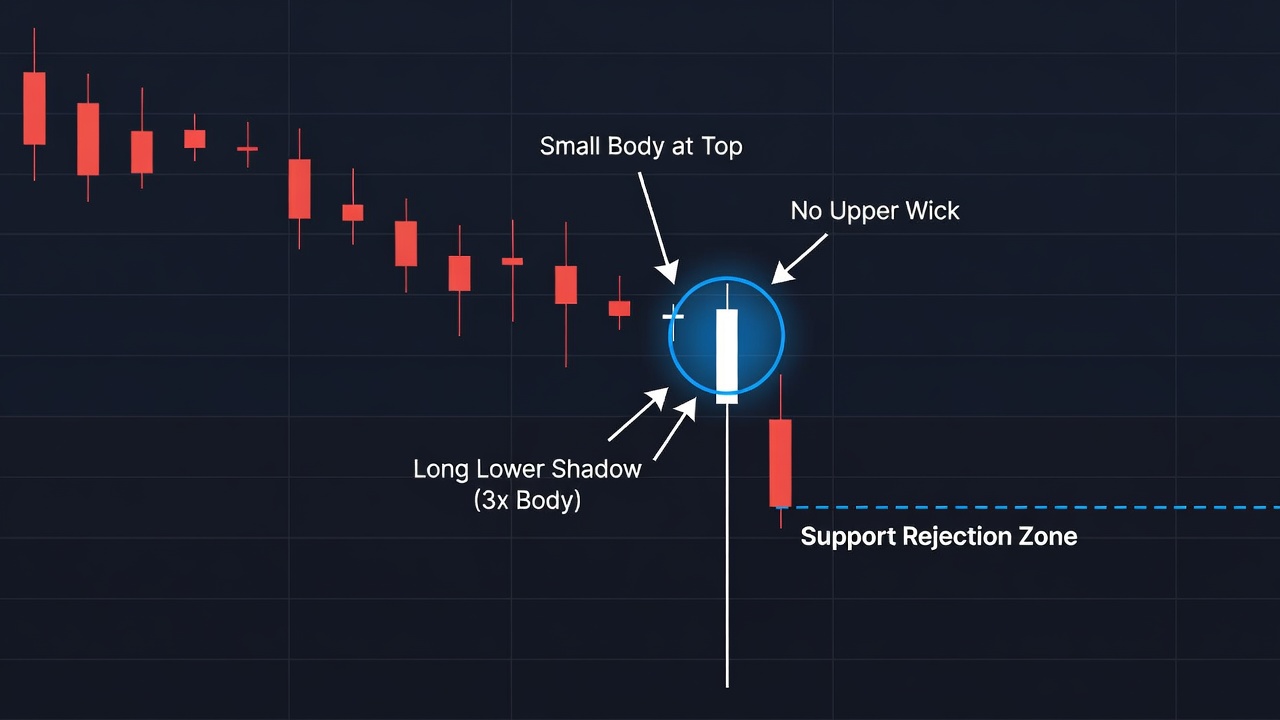
Identifying a valid hammer or shooting star requires inspecting three key structural components: the shadow ratio, the real body, and the chart location.
The Shadow Ratio
The tail or shadow must be at least two to three times the length of the real body. A tiny wick indicates weak rejection, whereas a long wick demonstrates that market participants forcefully rejected price at that level.
The Real Body
The real body must sit at the extreme upper or lower end of the total candle range. For a hammer, the real body resides in the top 25% of the candle’s total height. For a shooting star, the real body sits in the bottom 25% of the candle’s total height. The color of the body is secondary to the wick length, though a green hammer and red shooting star offer stronger conviction.
The Opposite Wick
The opposite shadow must be minimal or completely nonexistent. A valid hammer should have virtually no upper wick, while a valid shooting star should have virtually no lower wick. A prominent shadow on both sides converts the candle into a neutral spinning top, invalidating the directional rejection signal.
Location Context
A rejection candle is meaningless without prior trend context. A hammer is only valid after a clear, sustained move lower into support. A shooting star is only valid after an established rally into resistance. Single rejection candles appearing inside choppy horizontal consolidation produce frequent false signals.
The Exact Hammer and Shooting Star Setup Criteria
- Contextual Trend: Price must be in a distinct multi-bar trend (downward for hammers, upward for shooting stars) approaching a key higher-timeframe support or resistance level.
- Wick-to-Body Ratio: The primary rejection shadow must measure at least two times (ideally three times) the length of the real body.
- Body Position: The real body must settle within the top 25% of the bar’s full range for a hammer, or the bottom 25% for a shooting star.
- Opposite Wick Size: The opposite wick must be less than 10% of the total candle range.
- Volume Surge: Trading volume on the rejection bar should exceed the 20-period moving average of volume, signaling institutional participation.
- Location Confluence: The rejection wick must test and reject a clear structural level, such as a major horizontal S/R zone, dynamic EMA, or VWAP line.
How Do You Trade the Hammer and Shooting Star? (Entry, Stop Loss, Target)
Trading the hammer and shooting star successfully requires systematic execution across entry triggers, stop loss placement, and profit targets.
Entry Strategies
Traders utilize two distinct entry methods depending on their risk tolerance: market entry on close or limit entry on retracement. The standard conservative trigger is entering market-on-close right as the candle closes, confirming the structural shape. Alternatively, aggressive traders place a limit order at the 50% Fibonacci retracement level of the rejection candle’s total range. This limit entry tightens the stop loss and drastically improves the reward-to-risk ratio, though it risks missing trades if price runs immediately without pulling back.
Stop Loss Placement
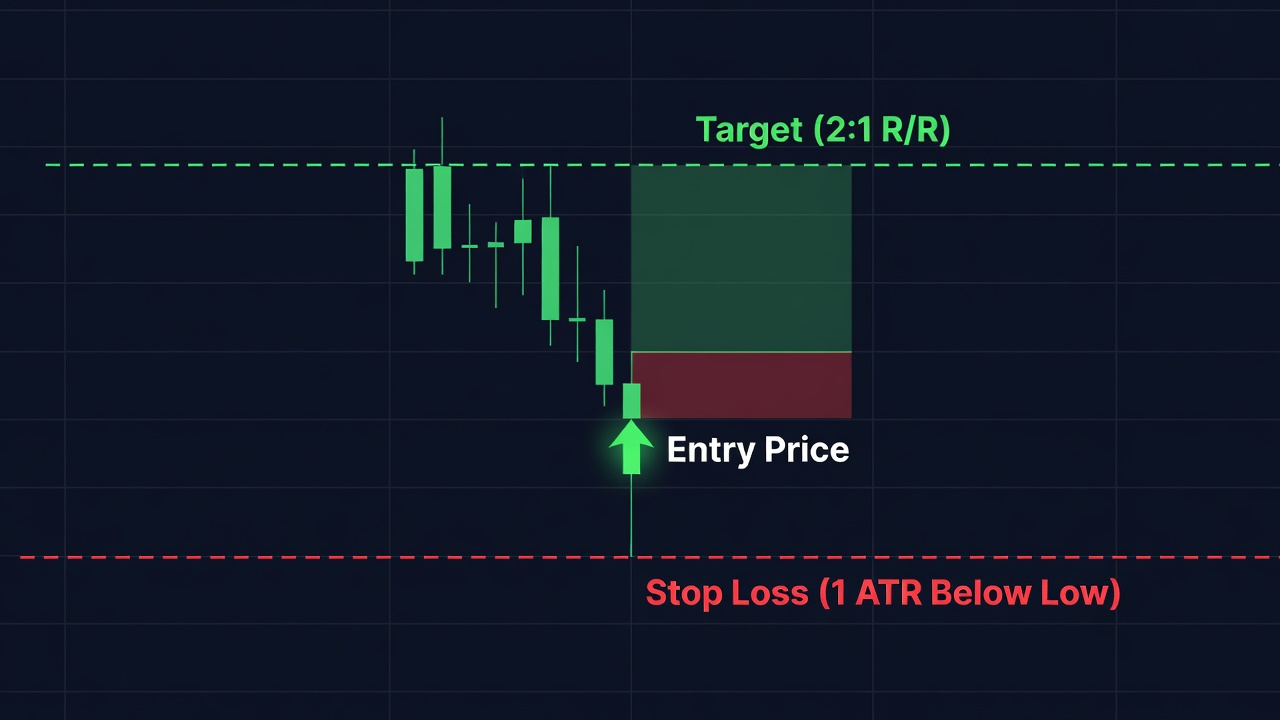
Stop losses must always sit beyond the extreme point of the rejection shadow with a volatility buffer. For a hammer long setup, place the stop loss 1 ATR (Average True Range) or 5 to 10 pips below the lowest point of the lower wick. For a shooting star short setup, place the stop loss 1 ATR or 5 to 10 pips above the highest point of the upper wick. Placing the stop directly on the wick tip exposes your position to market noise and stop-hunting spikes.
Profit Target Methods
Set dynamic price targets based on market structure while aiming for a minimum 2:1 reward-to-risk ratio. The primary target should sit at the nearest opposing key swing level—a swing high for hammer trades or a swing low for shooting star trades. Secondary targets can be trailed using a 20-period exponential moving average or fixed key higher-timeframe S/R levels to capture extended trend reversals.
Free For Traders
Know What To Trade BEFORE The Opening Bell
The Big Dipper Dashboard hands you curated high-probability setups every single morning — free.

Hammer and Shooting Star Trade Example: Step-by-Step
Let us examine a complete step-by-step trading setup executing a bullish hammer reversal on a 4-hour chart. As you can see in the annotated chart above, price had been trending downward for several days, forming lower highs and lower lows into an established daily horizontal support level. As price reached this key support zone, selling pressure reached a climax, pushing price heavily lower during the first two hours of the 4-hour candle.
The turning point occurred mid-session when large buyers stepped in forcefully to absorb the supply. The price aggressively reversed direction, clearing out all intraday losses and closing near the absolute high of the bar. The resulting 4-hour candle exhibited a tiny green body near the top and a lower shadow roughly three times the height of the body, creating a textbook hammer pattern at key structural support. Additionally, volume on this specific candle expanded 40% above the 20-period average, confirming institutional participation.
Execution unfolded systematically following strict trade rules. A buy order was triggered at the close of the 4-hour candle at $150.00. The stop loss was calculated by measuring 1 ATR below the low of the lower shadow ($147.50), placing the invalidation point safely at $146.50—a total risk of $3.50 per share. The profit target was set at the previous 4-hour major swing high of $157.00, yielding a total profit potential of $7.00 per share.
The outcome delivered an ideal 2:1 reward-to-risk distribution. Price pushed steadily upward over the next three sessions without threatening the stop loss, ultimately hitting the profit target at $157.00 and yielding a solid win.
Hammer and Shooting Star Across Different Timeframes
Higher timeframes yield vastly superior trade reliability due to higher order flow volume and reduced market noise.
Intraday Timeframes (1-Min to 15-Min)
Intraday rejection candles produce frequent false breakouts caused by high-frequency algorithms and retail order noise. While hammers and shooting stars appear frequently on 1-minute and 5-minute charts, their individual win rates are low unless filtered by strong higher-timeframe levels and volume confirmation.
Hourly Timeframes (1-Hour to 4-Hour)
The 1-hour and 4-hour charts hit the sweet spot between setup frequency and signal reliability for swing traders. Signals on these timeframes reflect true institutional order positioning and produce clean multi-bar trends with manageable risk profiles.
Daily and Weekly Timeframes
Daily and weekly rejection patterns provide the highest probability trades across all financial markets. A hammer or shooting star on a daily chart represents an entire session of macro liquidity consumption, frequently marking major macro tops and bottoms that lead to multi-week trends.
Hammer and Shooting Star vs. Hanging Man and Inverted Hammer: Key Differences
Understanding the crucial differences between these closely related candlestick structures prevents costly directional misinterpretations.
Hammer vs. Hanging Man
While the hammer and hanging man share identical physical shapes—a small upper body and long lower wick—their market context completely flips their directional bias. A hammer occurs at the bottom of a downtrend and signals a bullish reversal. A hanging man occurs at the peak of an uptrend and signals a potential bearish reversal. The hanging man’s lower wick reveals that sellers successfully pushed price significantly lower during the session; even if buyers pulled price back up, that sudden emergence of aggressive selling at swing highs indicates underlying structural weakness.
Shooting Star vs. Inverted Hammer
The shooting star and inverted hammer also share identical physical anatomy—a small lower body and long upper wick—but differ based on trend context. A shooting star forms at the top of an uptrend and signals a bearish reversal. An inverted hammer forms at the bottom of a downtrend and signals a potential bullish reversal. The upper wick on an inverted hammer demonstrates that buyers attempted to rally, and while sellers pushed price back down, the buying pressure proved that bull activity is emerging at key lows.
Best Confluences to Stack With Hammer and Shooting Star Patterns
Combining rejection candles with additional technical evidence dramatically elevates setup probability.
- Horizontal Support and Resistance: A rejection candle forming directly at a multi-touch horizontal level confirms that market participants are actively defending structural price levels.
- 50-Period and 200-Period EMAs: Dynamic moving averages act as strong trend-continuation focal points; a hammer bouncing off a 50 EMA in an uptrend offers an extreme statistical edge.
- Session VWAP (Volume Weighted Average Price): Rejections off VWAP signal that institutional buyers or sellers are aggressively stepping in at value price boundaries.
- Volume Spikes: Above-average volume on the rejection candle proves that smart money is actively absorbing liquidity rather than retail noise moving price.
- Previous Day High / Low: A shooting star sweeping past the previous day’s high before closing back inside the range represents a high-probability liquidity sweep setup.
Common Hammer and Shooting Star Mistakes to Avoid
- Trading Single Candles in Isolation: Executing a hammer or shooting star in the middle of a sideways consolidation range without trend context or key level confluence is a recipe for quick losses.
- Ignoring Shadow Ratios: Entering on candles with wicks equal to or shorter than the real body destroys your statistical edge and misidentifies neutral consolidation as a directional rejection.
- Placing Stop Losses Right on the Wick Tip: Setting your stop loss directly at the highest or lowest tick of the rejection shadow leaves your position vulnerable to routine market spread expansion and liquidity hunts.
- Front-Running the Candle Close: Entering a trade before the timeframe bar officially closes is dangerous; a pristine hammer can easily transform into a full bearish candle in the final seconds of a session.
- Ignoring Higher-Timeframe Trend Structure: Attempting to trade a 5-minute hammer directly into an opposing 4-hour major resistance level creates an immediate structural conflict where the higher timeframe usually wins.
From Find Better Trades
Know Exactly Where The Big Money Steps In
Auto-plots institutional support & resistance zones from pure price action — no more guessing at levels.

Hammer and Shooting Star Checklist
- Is price clearly trending into a major structural level (downtrend for hammer, uptrend for shooting star)?
- Does the primary rejection wick measure at least two to three times the length of the real body?
- Is the real body located within the extreme 25% boundary of the candle range?
- Has the candle fully closed on the current timeframe before entering?
- Is trading volume on the rejection bar higher than the recent 20-period average?
- Is your stop loss buffered by at least 1 ATR beyond the wick tip?
- Does the trade offer a minimum reward-to-risk ratio of 2:1 before hitting the next structural barrier?
Frequently Asked Questions About Hammer and Shooting Star
What color should a hammer candlestick be?
A hammer candlestick can be either green (bullish) or red (bearish), but a green hammer is slightly more bullish. This is because a green close proves buyers not only rejected lower prices but also managed to push the close above the session open. However, the length of the lower rejection wick is far more critical than the real body color.
Where do you place a stop loss on a shooting star trade?
Place your stop loss slightly above the highest point of the shooting star’s upper wick, adding an Average True Range (ATR) buffer. This ensures market noise and minor spread fluctuations do not stop you out prematurely. Never place your stop loss inside the candle body or directly on the exact high tick.
Can you trade hammers and shooting stars on crypto and forex?
Yes, hammer and shooting star strategies work exceptionally well across crypto, forex, equities, and futures markets. Because these patterns reflect universal market psychology—liquidity sweeps and price rejections—they function consistently across any liquid asset class. Higher volume instruments deliver the cleanest setups.
What is the difference between a pin bar and a hammer?
A hammer is a specific single-bar Japanese candlestick pattern with strict structural rules, including a lower wick at least twice its body size occurring after a downtrend. A pin bar (short for Pinocchio bar) is a broader price action term popularized by Western traders that encompasses both hammers and shooting stars. Essentially, all hammers are bullish pin bars, but not all pin bars strictly fit traditional Japanese hammer definitions.
📈 Want More? Join Our Free Trading Community
- Trading Strategy Guides Telegram — daily strategy tips and market insights
- Find Better Trades Telegram — free trade signals delivered to your phone
- Find Better Trades on YouTube — live trade breakdowns and tutorials