The Neon Falcon: High-Velocity Trend Breakout Strategy


Most retail breakouts fail because traders jump on late extension instead of catching the exact moment volume aligns with directional momentum. The Neon Falcon solves this by pairing the rapid directional bias of the 21-period Hull Moving Average with Stochastic RSI reset zones and Fair Value Gap entries, allowing day traders and scalpers to ride high-velocity continuation moves before the rest of the market notices.
What Is The Neon Falcon?
The Neon Falcon is an aggressive trend-continuation system built to capture explosive momentum bursts across forex, crypto, and stock index intraday charts. It targets structural efficiency gaps created during heavy institutional buying or selling, filtering out choppy noise through a high-speed smoothing indicator. Scalpers and day traders operating on the 5-minute to 1-hour timeframes will get the most power out of this setup.
Indicators You Need
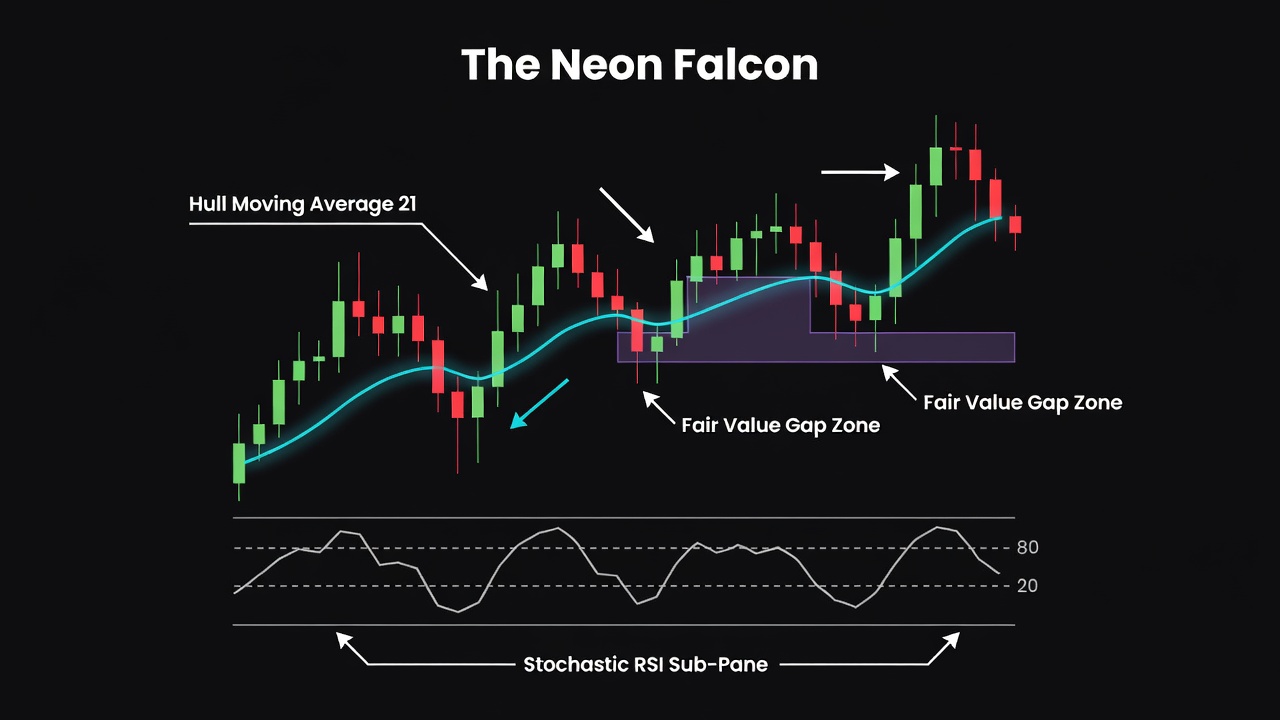
- Hull Moving Average (21 Period): Acts as our fast directional bias filter; color changes green for bullish posture and red for bearish posture to eliminate lagging delay.
- Stochastic RSI (14, 14, 3, 3): Measures short-term momentum exhaustion within the broader trend, pinpointing precise pullbacks when the value dips below 20 (bullish) or rises above 80 (bearish).
- Fair Value Gap (FVG) / Price Imbalance: Identifies institutional order flow footprints where aggressive market orders left inefficient price gaps on the chart.
Optimal timeframes for this strategy are the 5-minute, 15-minute, and 1-hour charts.
The Neon Falcon Rules — Step by Step
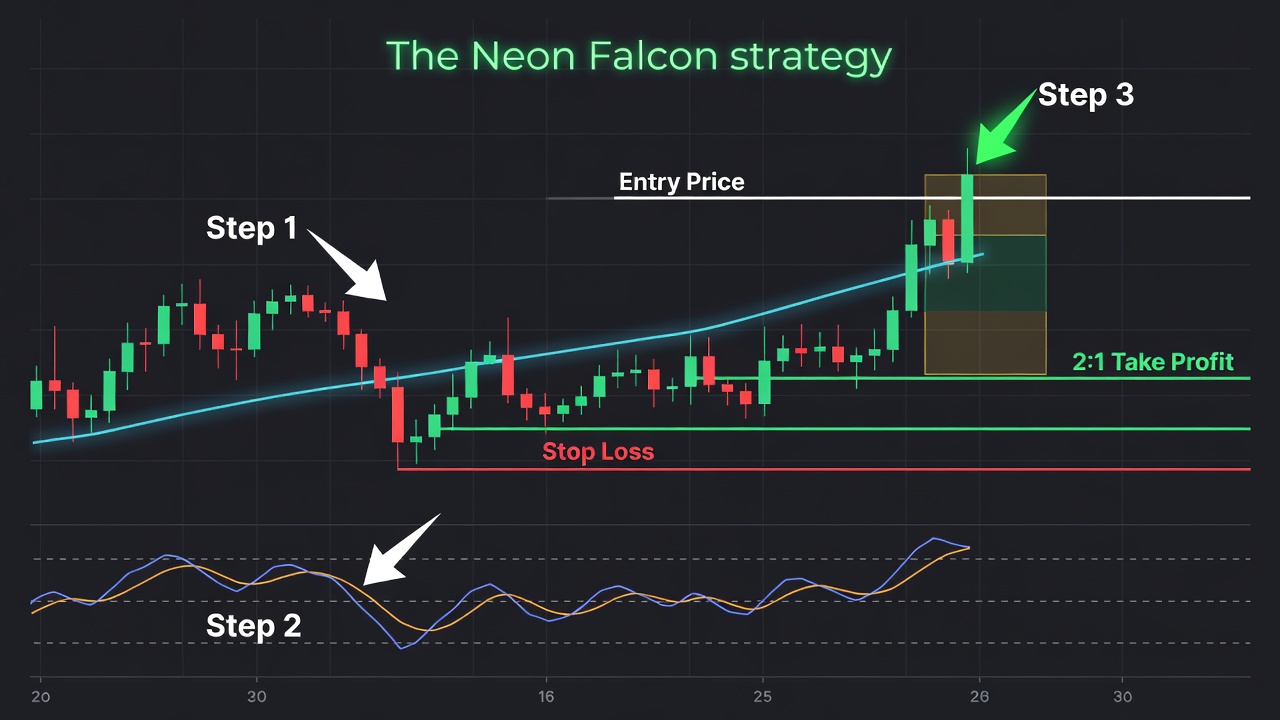
- Step 1: Chart Setup & Trend Alignment: Apply the 21-period Hull Moving Average and Stochastic RSI to your chart. Ensure the 21 HMA shows a sharp slope upward (green) for long trades or downward (red) for short trades, with price candles respecting the moving average as dynamic support or resistance.
- Step 2: The Signal (Momentum Reset): Wait for price to pull back toward the 21 HMA while the Stochastic RSI drops below the 20 level into oversold territory (for longs) or pushes above 80 into overbought territory (for shorts). This signals a temporary pause in the main movement.
- Step 3: Entry Trigger (Structural Tap & Crossover): Enter the market on the exact candle close where price taps into a Fair Value Gap created during the previous impulse leg and the Stochastic RSI %K line crosses above the %D line while exiting oversold territory (crossing back above 20). Reverse the criteria for short entries.
Entry, Stop Loss & Profit Target
For a bullish setup, enter at market immediately on the close of the candle that confirms the Stochastic RSI bullish cross above 20 while respecting the Fair Value Gap zone. For a bearish setup, enter on the candle close confirming the Stochastic RSI cross below 80 inside the bearish gap.
Place your stop loss 2 to 3 pips below the swing low of the pullback structure (or below the lower boundary of the Fair Value Gap zone for long positions). For short trades, set the stop loss 2 to 3 pips above the structural swing high.
Set your profit target at a fixed 2:1 Reward-to-Risk ratio, or lock in partial profits at the nearest major structural liquidity pool (previous session high/low) and trail the remaining position along the 21 Hull Moving Average until a candle closes on the opposite side of the line.
Common Mistakes to Avoid
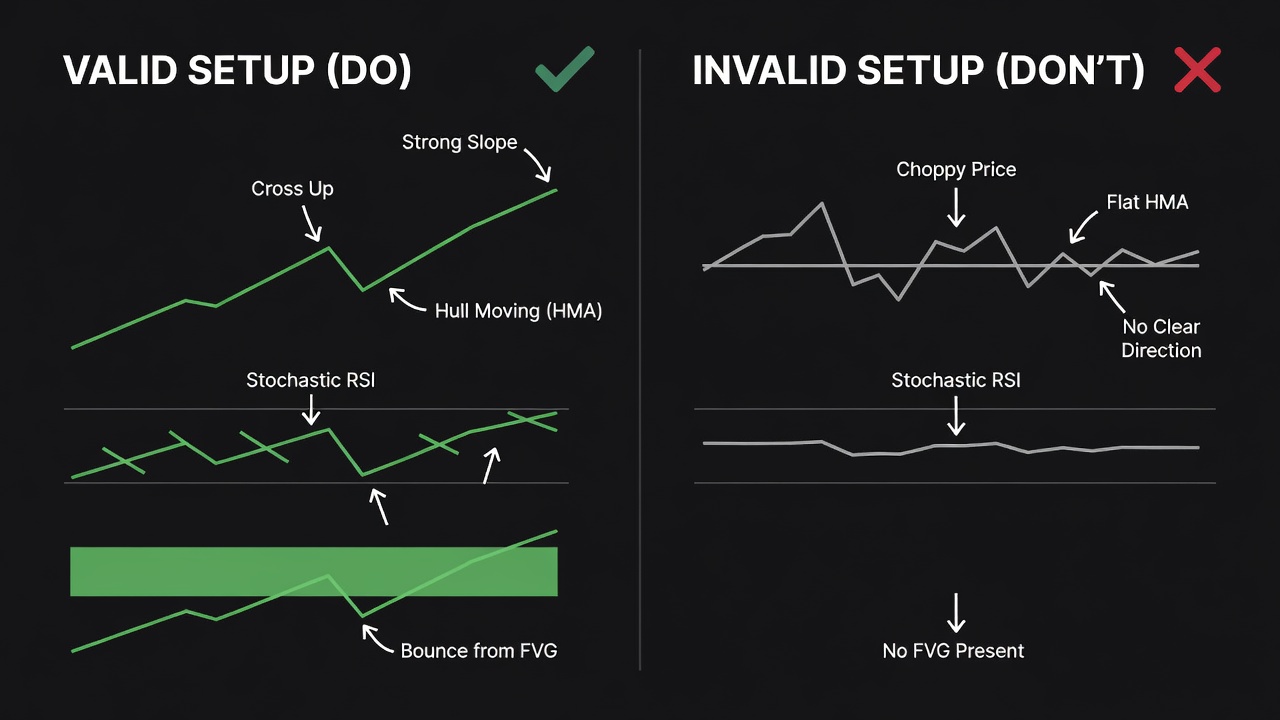
- Trading into a flat HMA: Entering when the 21 HMA is moving sideways creates constant whipsaws; only trade when the HMA displays a distinct upward or downward slope.
- Ignoring Market Structure Context: Taking entries when price is crashing straight into major daily support or resistance zones severely reduces your win rate.
- Chasing Overextended Entries: Triggering trades after price has already moved far away from the 21 HMA and filled the Fair Value Gap degrades your risk-to-reward metrics.
- Front-Running the Crossover: Entering before the Stochastic RSI lines actually cross and close above 20 or below 80 often leads to catching a falling knife.
- Ignoring Volume Environment: Attempting to trade this system during low-volume sessions like late US afternoon trading hours leads to sluggish price action and false breakouts.
Quick Reference Checklist
- Is the 21-period Hull Moving Average cleanly sloped in your trade direction?
- Is price trading on the correct side of the HMA line?
- Did the Stochastic RSI pull back fully into oversold (< 20) for long or overbought (> 80) for short?
- Is there a visible Fair Value Gap / imbalance zone supporting the pullback area?
- Has the Stochastic RSI %K line officially crossed the %D line on a closed candle?
- Is your stop loss anchored clearly behind structural support or the FVG boundary?
- Does the trade offer at least a 2:1 risk-to-reward ratio to the next major resistance/support level?
Frequently Asked Questions
Q: What is the best timeframe to trade The Neon Falcon?
A: The 15-minute timeframe offers the optimal balance between high signal frequency and clean market structure, though 5-minute scalpers and 1-hour day traders also achieve consistent results.
Q: Can I use standard RSI instead of Stochastic RSI for this strategy?
A: Stochastic RSI is strongly recommended because standard RSI responds too slowly to brief intraday pullbacks. Stochastic RSI provides the fast sensitivity needed to catch small momentum dips within aggressive trends.
Q: How do I handle news events when holding a position?
A: Close active trades or move your stop loss to breakeven at least 15 minutes prior to high-impact economic releases such as NFP or CPI, as sudden slippage can disrupt predefined stop loss levels.
Q: Does this strategy work on stocks and crypto?
A: Yes, it works effectively across high-volume assets including crypto pairs like BTC/USD and major index futures like NQ and ES, provided trading volume is robust.
Free For Traders
Get Free Weekly Trade Ideas Sent Straight To Your Phone
Join thousands of traders who get high-probability setups delivered every week — no cost, no catch.

From Find Better Trades
Know EXACTLY What To Trade At 9:30 AM
Morning Opening Range Breakout setups delivered before the bell. While everyone else is scrambling, you already have your plan.

📈 Want More? Join Our Free Trading Community
- Trading Strategy Guides Telegram — daily strategy tips and market insights
- Find Better Trades Telegram — free trade signals delivered to your phone
- Find Better Trades on YouTube — live trade breakdowns and tutorials