Bull Market Strategy – Pushing the Horns Out and Up

Welcome to this new step-by-step guide on how to trade with a Bull market strategy. You can make large amounts of profit in both a bull market and a bear market. The key to success is to use the right trading strategy for each trading environment.
Our team at Trading Strategy Guides has put together this article so you can quickly grasp what it takes to trade a bull market and generate consistent income. To succeed in trading bull markets, it will require a significant amount of discipline and skills to take advantage of the market psychology that is fear and greed.
Regardless of what news comes out or what the current economic conditions are in a bull market, the markets will continue to go higher and higher. This market behavior will leave out a lot of traders on the sidelines wondering how to find a way to get in and ride the trend. This is really simple with the things that we’re going to teach you throughout our guide into trading bull markets.
Moving forward, we’re going to highlight the characteristics of a bull market. We’ll also cover which bull trading indicator you’ll need to use to ride the trend like a pro. Here is an approach to currencies by Warren Buffett.
Characteristics of a Bull Market
In a bull market prices have the tendency to rise and to continue expanding until it reaches a climax point. Bull markets happen when the buying pressure is more significant than the selling pressure.
In other words, we have strong demand but weak supply. So we have an imbalance in the supply-demand equation of the market.
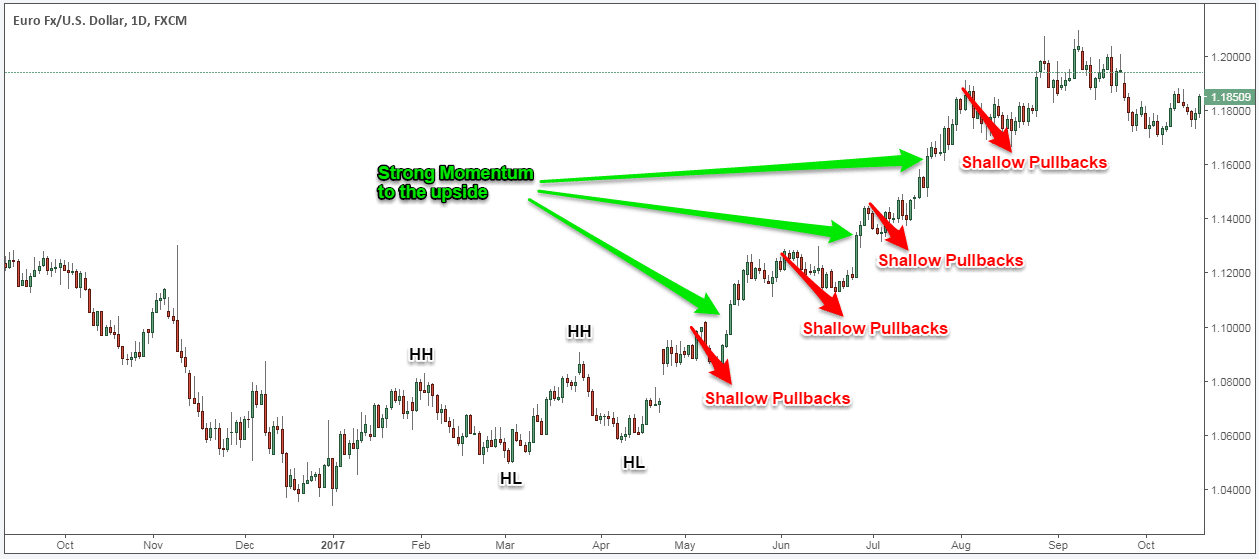
Technically speaking, these are some of the most obvious features of a bull market:
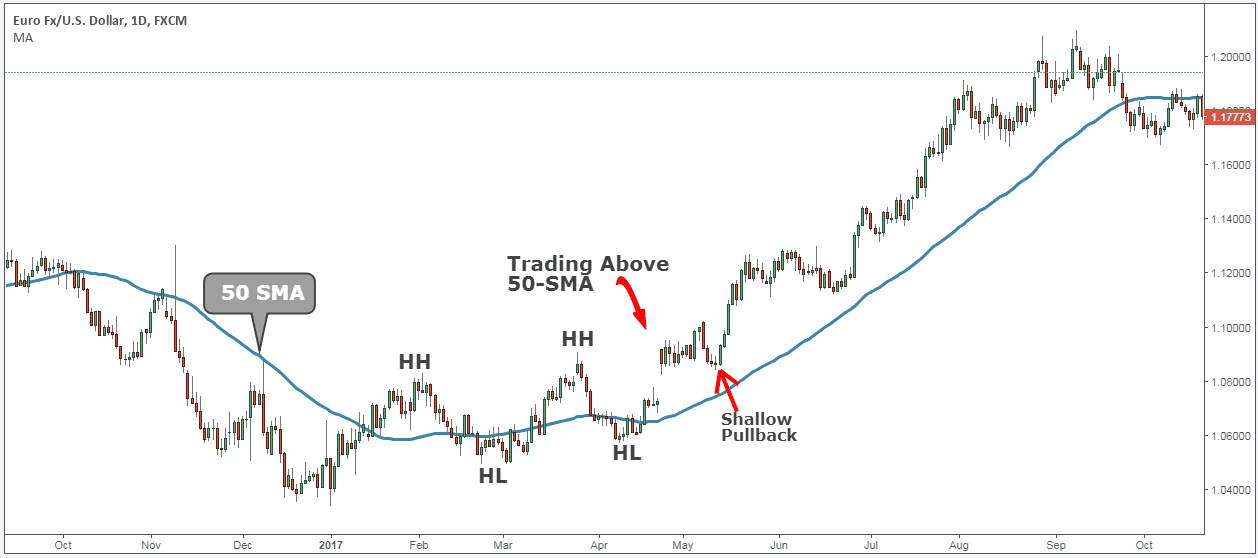
- Shallow retracements or pullbacks.
- Strong momentum to the upside.
- The price making a series of higher highs and higher lows.
- The strong bullish trend will get lots of attention from the mainstream media.
Now, let’s see what bull trading indicator we’re going to utilize to ride the trend.
Bull Trading Indicators
We’re going to reveal the only bull trading indicator used by professional traders to make profits from a prolonged bull market.
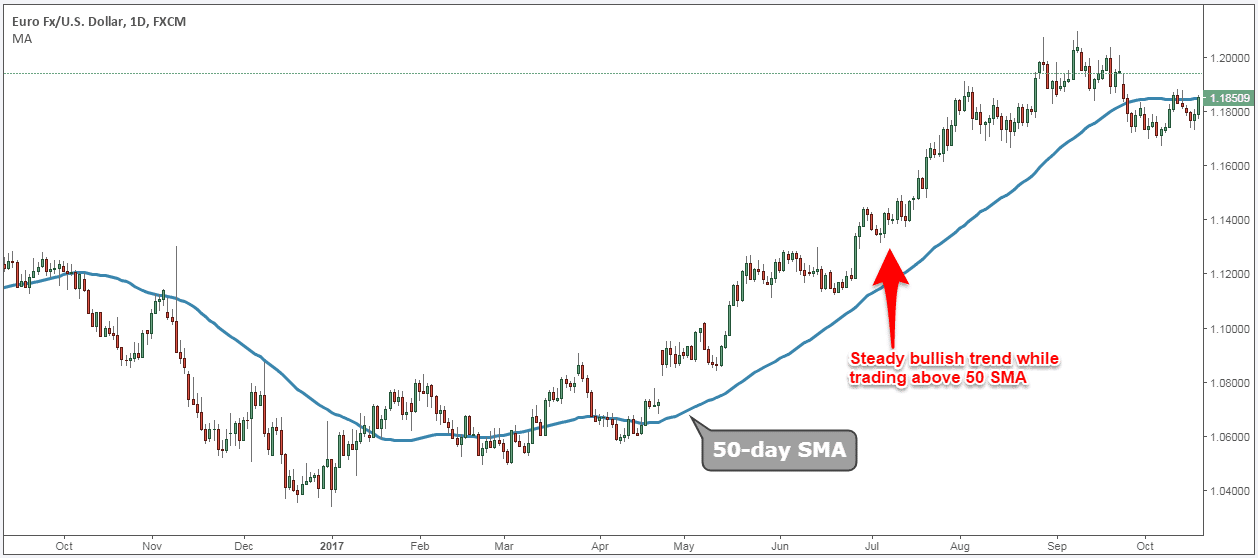
The 50-day moving average is the leading indicator utilized by many traders because it’s an effective trend indicator to spot uptrends and downtrends. This is a practical bull bear indicator that will tell you the direction of the trend at first glance.
The more people use the bull-bear indicator, the more relevant and accurate it becomes.
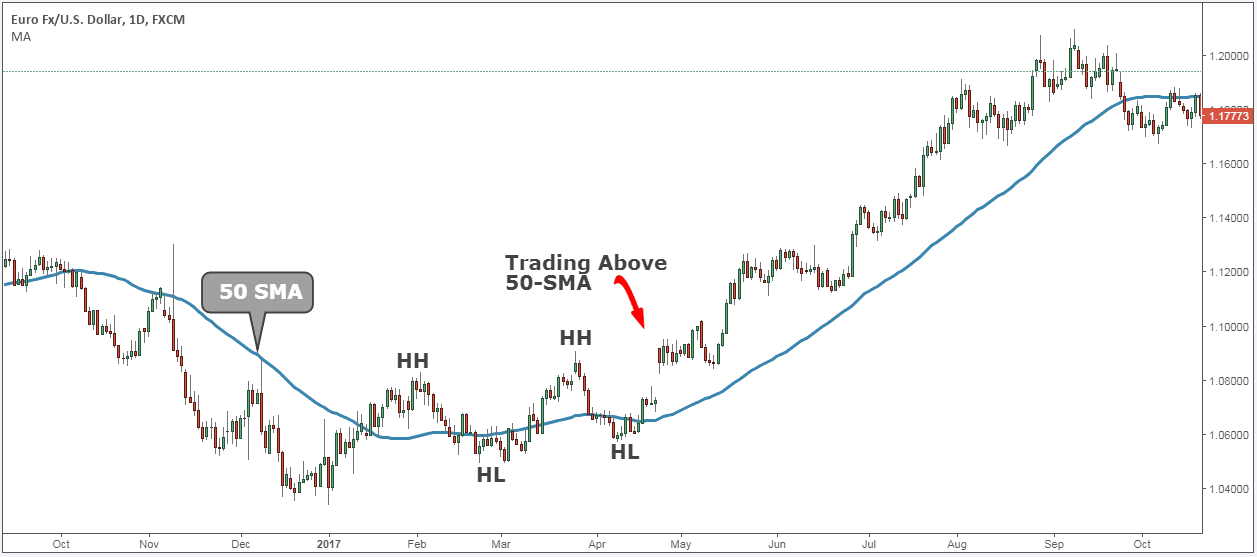
If the price is trading above the 50 SMA, that signals the presence of a bull trend. Conversely, in a bearish trend, the price will trade below the 50 SAM. In a sustained bullish trend, the price will remain above the 50-day SMA without violating this moving average.
Now, we’re going to put it work with our bull market strategy. Please remember that we cannot guarantee that any of the results we’re about to share with you, will be repeated in the future.
Trading Using the Bull Market Strategy
This trading strategy is designed for traders looking to stay in the trade a day, a week, or even months if you’d like. In combination with using the bull-bear indicator, this is also a pattern recognition strategy because there is a specific pattern we’re going to use to time our entries.
This strategy for the bull market can be applied to any time frame and any market so it doesn’t matter if you trade stocks, currency pairs, or cryptocurrencies. Our trend trading strategy will generate trade signals regardless of the time frame and the market you’re trading.
That’s how great this trend trading strategy is in terms of its ability to transfer over into all markets.
Now, before we go any further, we always recommend taking a piece of paper and a pen and note down the rules of this trend following strategy.
For this article, we’re going to look at the buy-side.
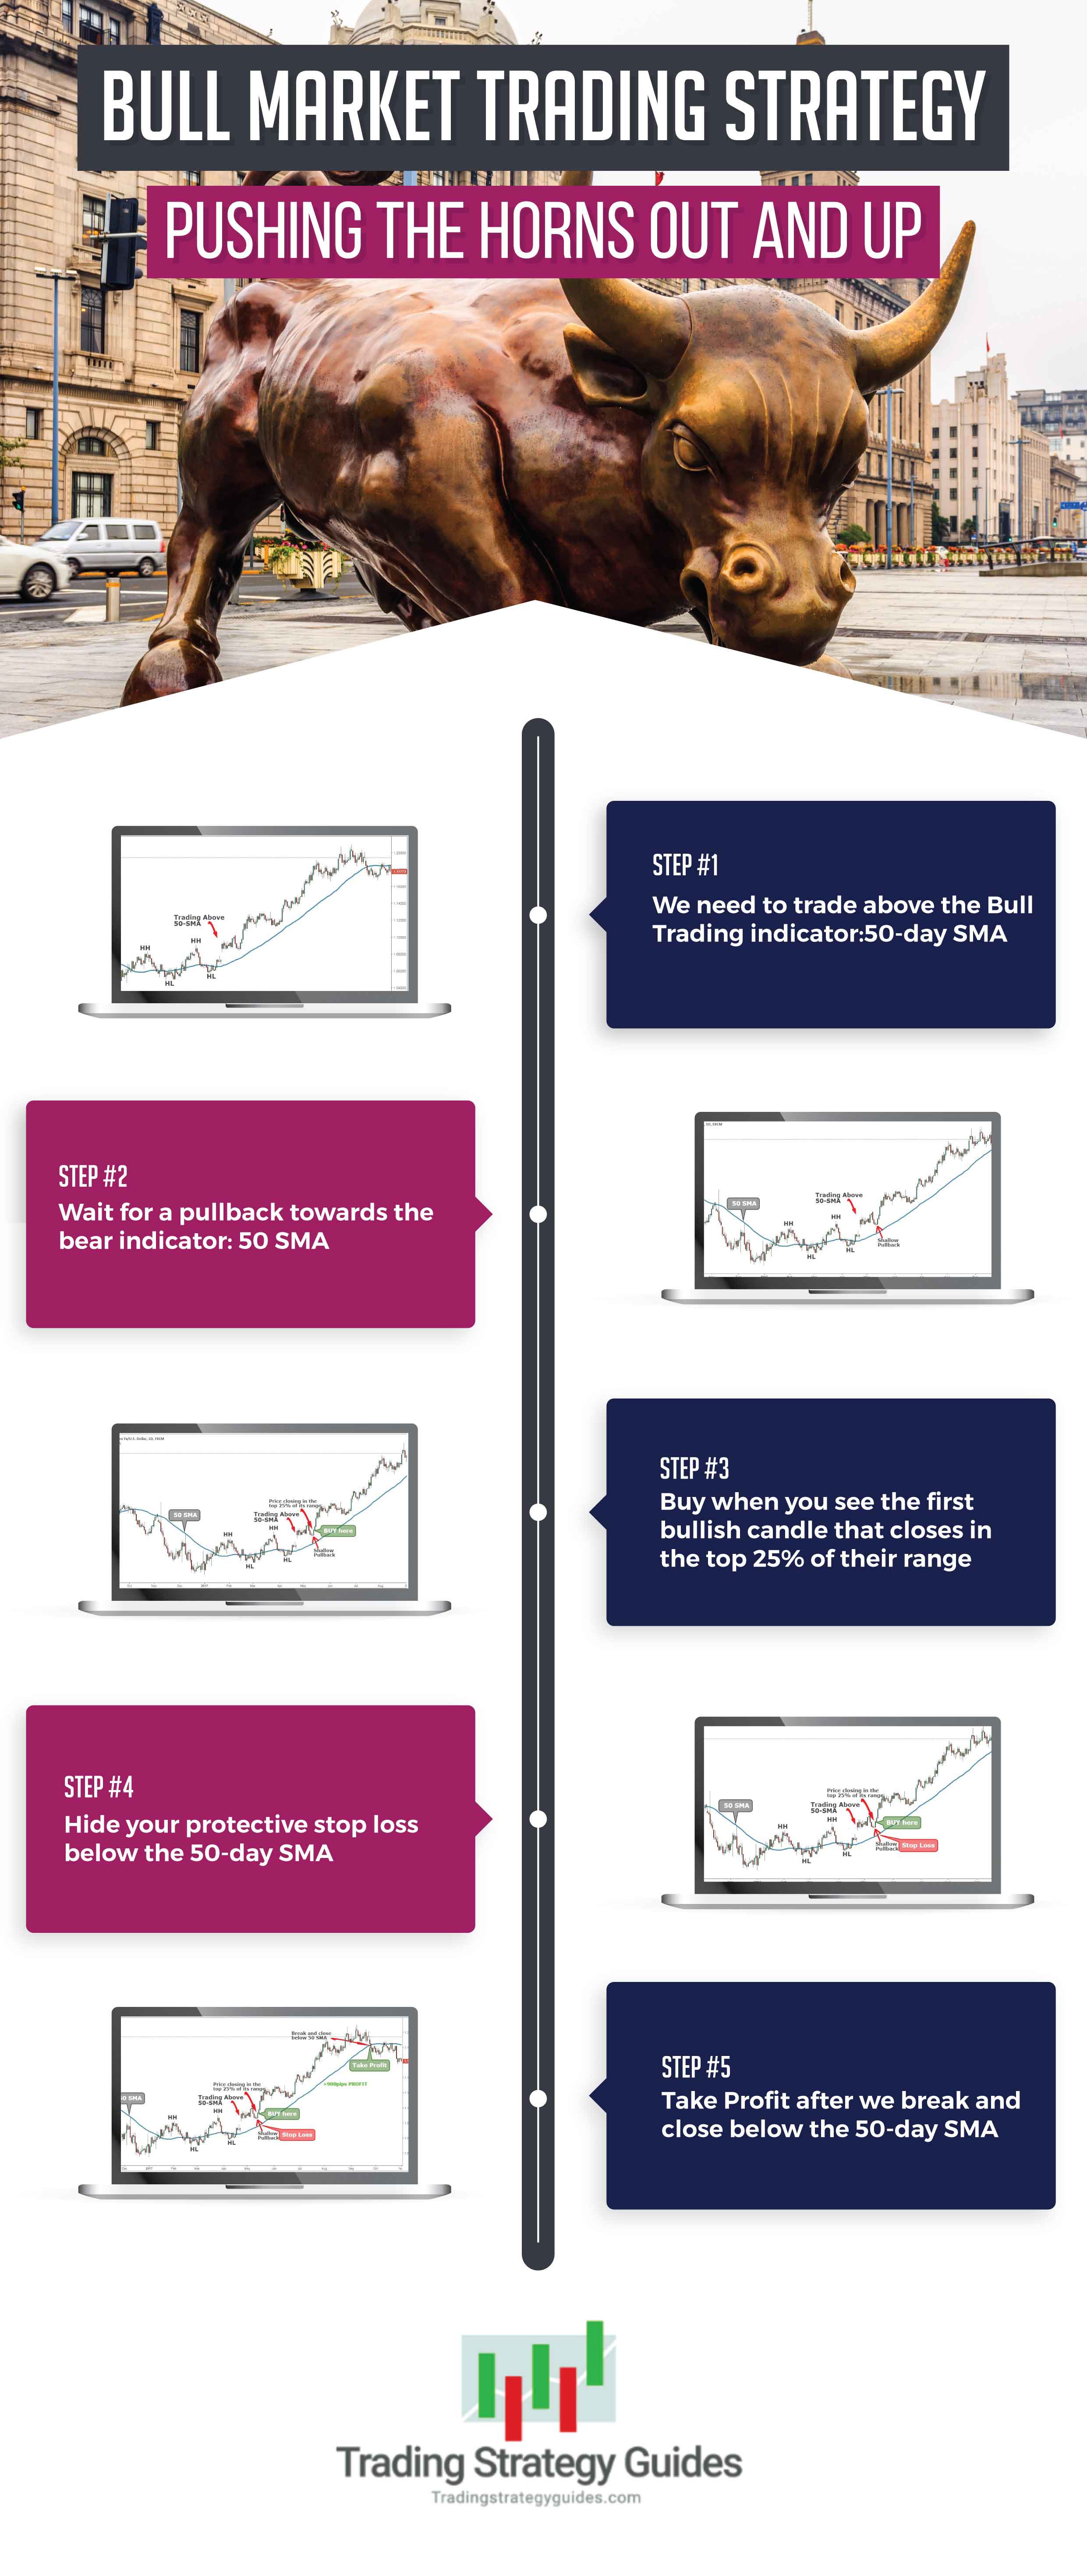
Step #1: We need to trade above the Bull Trading Indicator: 50-day SMA
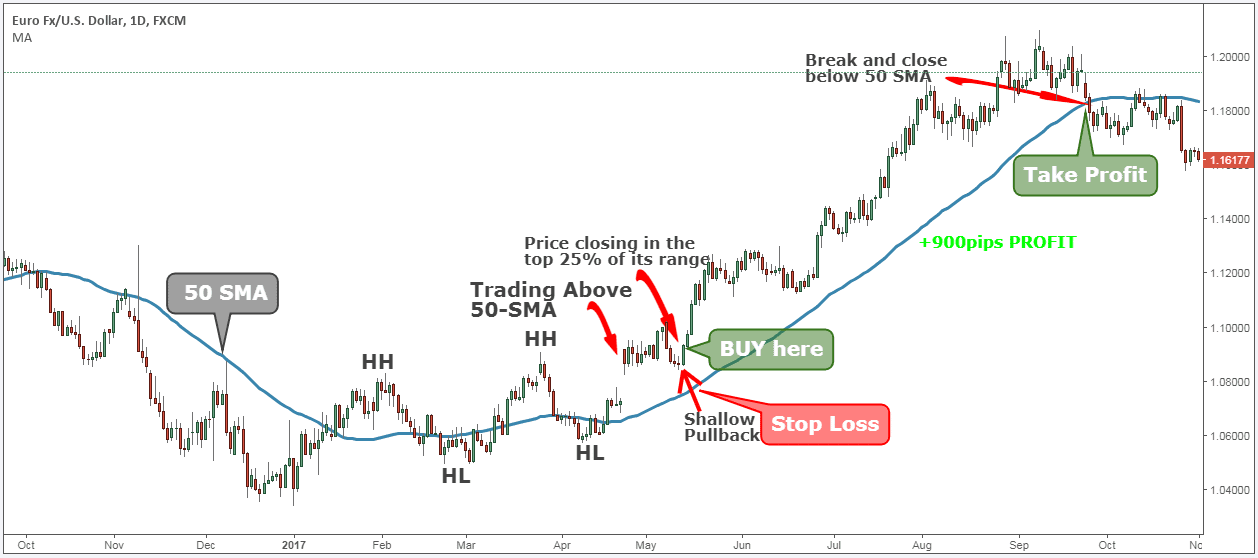
When we’re trading above the 50-day SMA it’s considered to have a bullish trend.
However, to have a valid price structure that signals a bullish trend, we also need to have the price making higher highs followed by higher lows.
Note* When we count the higher highs and higher lows we don’t care that much where they are relative to the 50-day SMA.
Before we pull the trigger, there is one more condition that needs to be satisfied.
See below:
Step #2: Wait for a pullback towards the bull bear indicator: 50 SMA
The best way to maximize your profits in a bull market is to try to buy on pullbacks. Buying on pullbacks, you get a better entry price, and at the same time, you also got the chance to use a smaller stop loss.
Usually, when we’re in the presence of a strong bullish trend, you’ll notice that the market will rarely come close to touch the 50-day SMA again. For this purpose, we’ve adopted one of our favorite trade tactics to identify a rally right from the start of the move.
The bull and bear indicator is now also confirmed by the price action, which means that we can move forward and outline the trigger condition for our entry strategy.
See below:
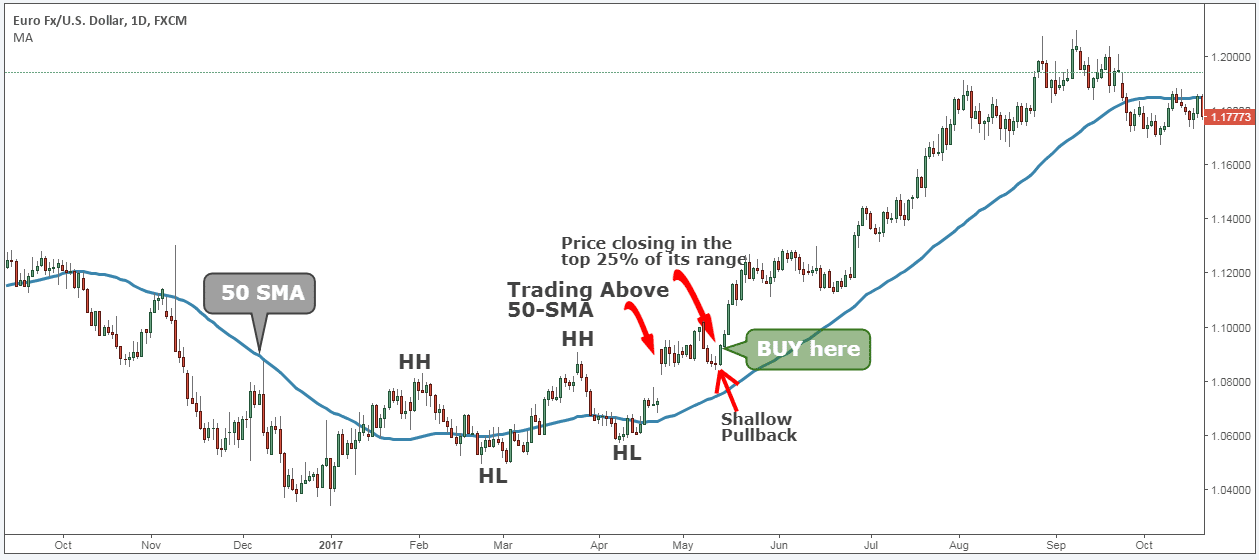
Step #3: Buy when you see the first bullish candle that closes in the top 25% of its range
The candle you use to initiate a buy position needs to close in the top 25% of its trading range.
Why does it have to close there?
A close in the top 25% of its trading range is an edge or a clue coming from the market that it wants to go higher. This is an excellent trading edge that the market is signaling to us. It’s giving you a clue that the market will most likely continue in that direction.
In the figure above, we highlight the first candle that closes in the top 25% of its range.
We can’t guarantee that after every candle that closes above the top 25% of its range a new bullish candle will emerge because that’s not the case. However, if you follow all the trading rules outlined above, there is a high probability for the market to continue higher as long as we trade above the 50 SMA.
This brings us to the next important thing that we need to establish for the Bull market trading strategy, which is where to place our protective stop loss.
See below:
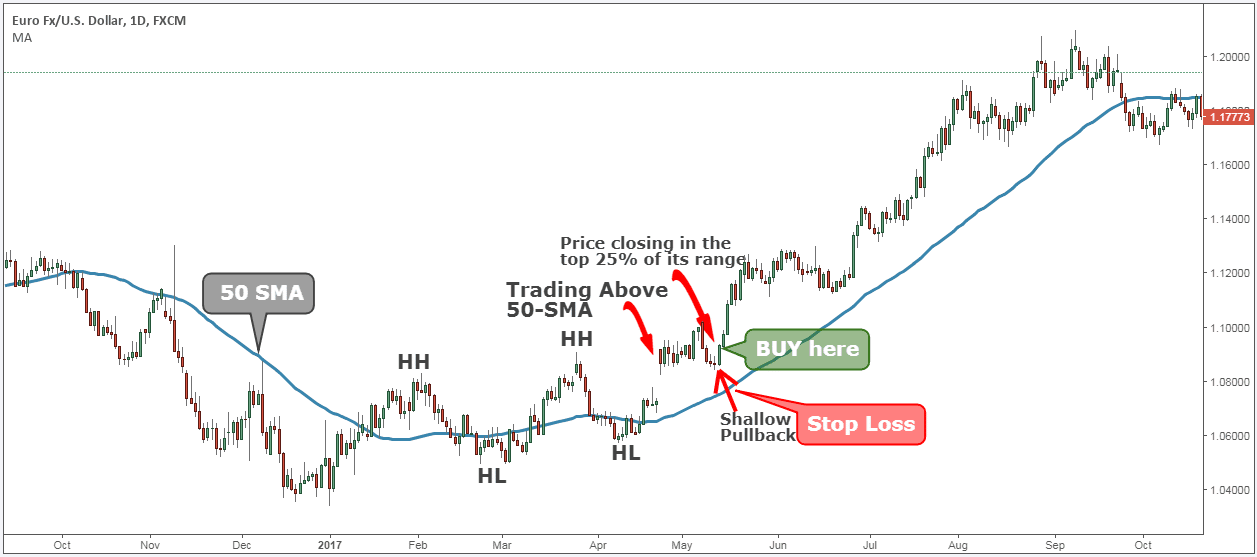
Step #4: Hide your protective Stop Loss below the 50-day SMA
If you don’t know where to place your stop loss, you’ll be in for a very bumpy road. So, we want to put our stop loss at a logical place where it makes sense that our trade idea is no longer valid.
The obvious place to hide your protective stop loss is below the 50-day SMA since this is the line in the sand between a bear market and a bull market.
Last but not least, we also need to define where we take profits.
See below:
Step #5: Take profit after we break and close below the 50-day SMA
The good news about the bull-bear indicator is that it does an exceptional job in keeping your trade open until the end of the trend. You will be able to capture most of the trend by simply using the 50-day SMA as a guide to measuring the trend direction.
In our live trade example above, if one would have simply followed this bull market step-by-step guide would be able to make +900 pips profit.
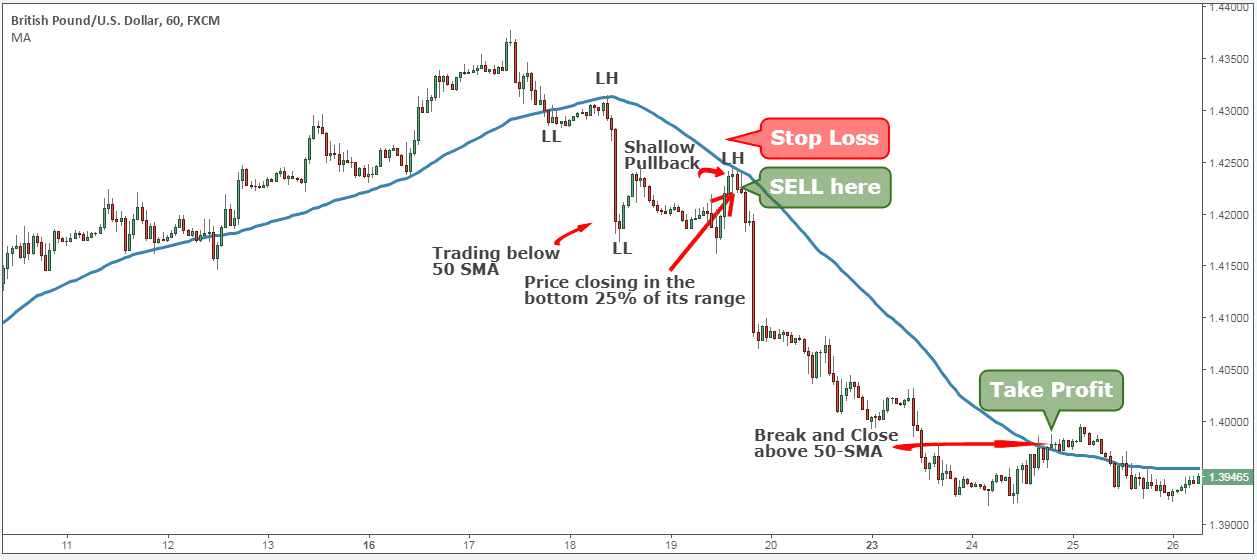
Note** the above was an example of a BUY trade using our Bull market strategy. Use the same rules for a SELL trade – but in reverse. In the figure below, you can see an actual SELL trade example.
Conclusion – Bull Trading Indicator
We encourage you to apply these trading techniques and see how valuable they are. This is a great way to get on board and have a feel on how to correctly trade in a bull market. To succeed in a bull market environment you need more than just a strategy; you need to have the right mindset so you won’t get trapped by the cycle of fear and greed.
If you’re new to our website, our sole intention is to simply give you the right trading education and the right trading tools so you can succeed on your own.
Thank you for reading!
Please leave a comment below if you have any questions about Bull market strategy!
Also, please give this strategy a 5 star if you enjoyed it!
[ratings]
Please Share this Trading Strategy Below and keep it for your own personal use! Thanks Traders!




Great article, thanks! Just a clarification, what does it mean that a candle “closes in the top 25% of their range”?
It’s really a nice and helpful piece of info. I’m happy that you shared this useful info with us. Please stay us up to date like this. Thanks for sharing.