TPS Trading Strategy – Time, Price, Scale-In
Learn the TPS Trading strategy based on Larry Connors’ time, price, and scale-in trade principles. Connors is an trading industry guru with over 35 years of trading experience that we can learn from. Throughout this trading guide, we’ll learn more about how to make a TPS trade and everything you need to know to get started.
If this is your first time on our website, our team at Trading Strategy Guides welcomes you. Make sure you hit the subscribe button, so you get your Free Trading Strategy every week directly into your email box.
The TPS system was revealed in the book High Probability ETF Trading: 7 Professional Strategies to Improve Your ETF Trading by Larry Connors and Cesar Alvarez. According to Larry Connors, this is his most powerful ETF trading strategy and the most profitable strategy if you’re able to put it into practice.
If you don’t trade ETFs, don’t worry.
The TPS system can be applied to stocks, commodities, currencies, cryptocurrencies, and any other market that you can access charting prices.
All TPS trades are based on technical analysis.
In trading, the principles of technical analysis are universally applicable across all markets. Therefore, if you’re a forex trader, stock trader, or futures trader and you want to use this trading strategy, it’s a good path to take.
Let’s get the ball rolling by laying down the foundation for the TPS trading strategy.
See below:
What is TPS Trading?
In a nutshell, TPS is the abbreviation for Time, Price, and Scale-in.
The TPS trading system combines the time element with the price element and the power of scaling into a position to find overbought and oversold situations in the market.
Nowadays, most traders mostly focus on the price action disregarding the time concept except if they use WD Gann or Elliott Wave theory.
It’s one thing to forecast that Apple stock will hit $500 per share and another thing to be able to determine the time to reach that target. The relationship between time and price is directly incorporated into the TPS trading system.
The golden rule of trading this system is to only trade in the direction of the predominant trend using as reference the 200-day moving average.
Secondly, to only buy ETFs (or stocks, currencies, cryptos, etc.) on pullbacks, not breakouts.
Basically, we look to buy into short-term weakness and sell into short-term strength.
The expectation is that the market will resume its prior trend and revert to its mean price.
Now, you’re probably wondering:
What other technical tools other than the 200-day moving average I need to use with the TPS system?
What Technical Indicators Should I Use with the TPS Trading System?
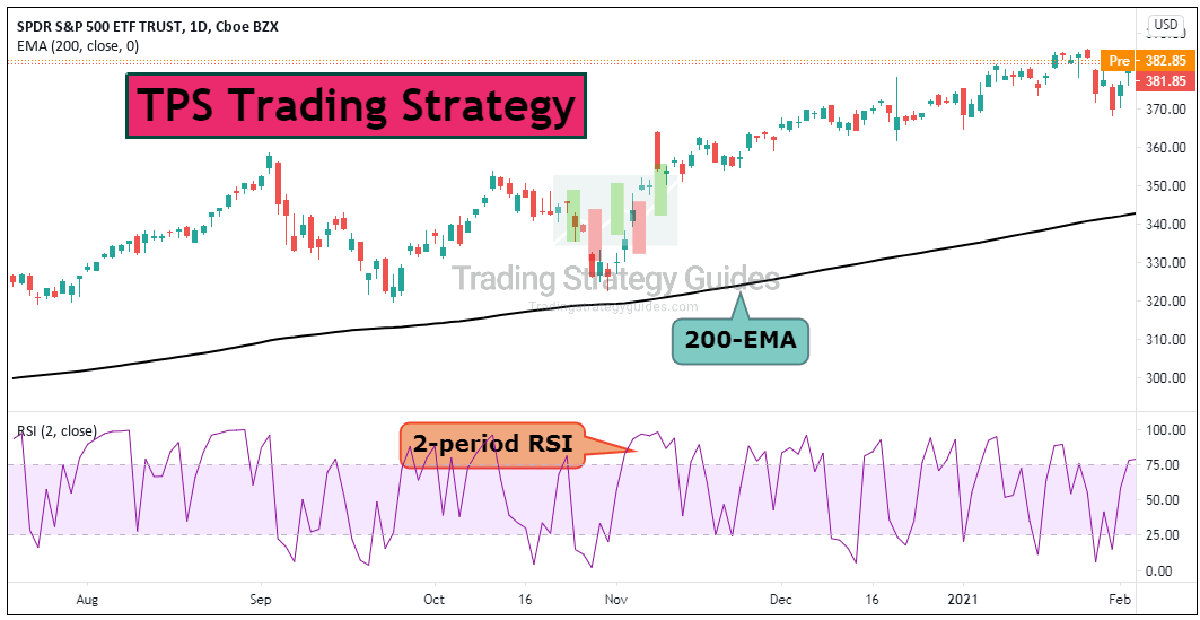
The TPS trading strategy uses two technical indicators:
- The 200-day exponential moving average (EMA) – used to determine the direction of the trend.
- 2-period RSI – used to determine when the pullback is overbought (oversold).
Your chart should look something similar to the chart below:
At this point:
You’ve learned the concepts behind what is TPS trading.
Next…
You’ll learn the TPS trading rules on the long side and short side.
See below:
How TPS Trading Strategy Works
Here are the TPS trading rules for buy signals:
- The price must trade above the 200-day EMA.
- 2-period RSI must be oversold (below 25 level) for two consecutive days.
- On the second day, buy 10% of your position on the close.
- On the third day, if the price closes lower than your previous entry price, average in and buy 20% more of your position
- On the fourth day, if the price closes lower than your previous entry price, average in and buy 30% more of your position
- On the fifth day, if the price closes lower than your previous entry price, average in and buy 40% more of your position
- When the 2-period RSI is in overbought territory (above 70 level) take profits at the closing price of that day
Note* While we’re averaging into the TPS trade, it’s important for the price to remain above the 200-day EMA at all time.
Trading with this advanced scaling in technique allows us to establish a full position when the market is oversold:
10% + 20% + 30% + 40% = 100%
If you practice enough this strategy, you’ll notice that the market will not give you the chance to establish a full position on all TPS trades. The main idea behind scaling into a trade among others is to make sure you’ve got a stake in the trend in case it takes off earlier than expected.
Learn more about the process of scaling in and scaling out HERE.
The main idea behind the TPS trading system is to find a trading ETF (above the 200-day EMA) to become undervalued (2-period RSI to close below the 25 level) for two consecutive days.
We buy the first portion of our position at the close on the second day and continue to scale in until we establish our full position. Whether we established a 10% position or a 100% position, we exit when the 2-period RSI crosses above the 70 level.
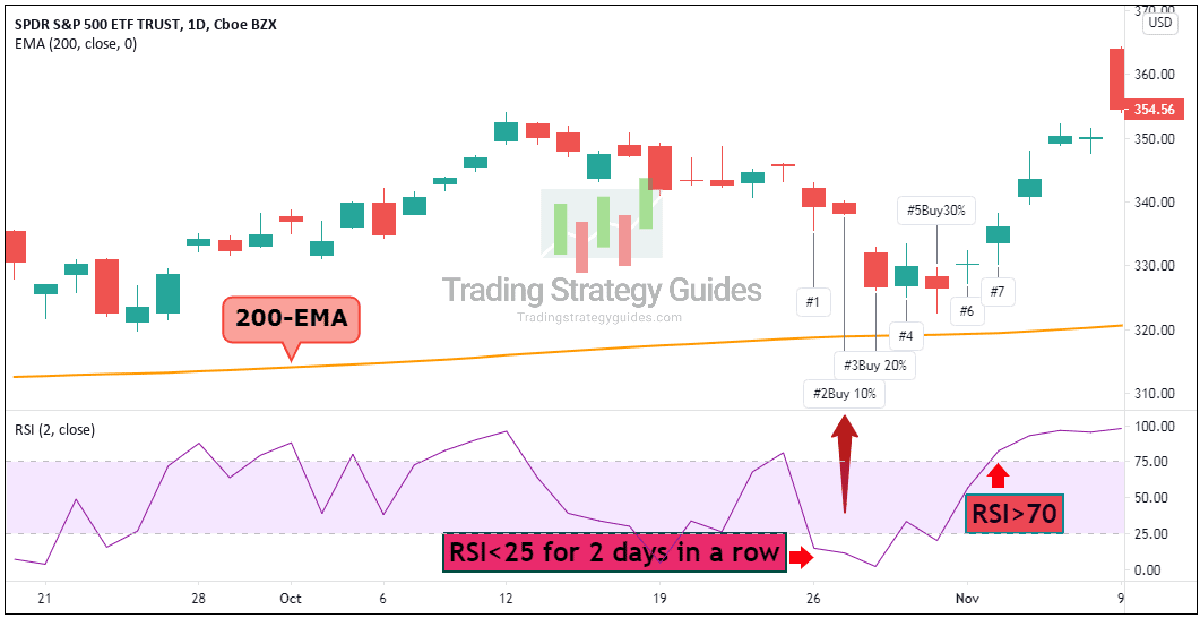
Check out the long TPS trade example below:
Here is the step-by-step process of what happened in the TPS trade above (SPY ETF):
- SPY is above 200-day EMA and RSI closes the first day below 25.
- RSI closes below 25 for the second day in a row – we buy 10% at the close.
- Price closes lower than the first position entry – we buy 20% at the close.
- Price closes HIGER than the second entry price – stay on the sideline.
- Price closes lower than the previous entry price – we buy 30% at the close.
- Price closes HIGHER than the previous entry price – we stay on the sideline.
- The 2-period RSI reaches overbought readings (above 70 level) – we lock in profits.
In the TPS trade example above we only managed to establish 60% of our position but the average cost was lower thus maximized the profit potential.
Without scaling into our TPS trade, we would be entering the full-size position at 338.22 compared to an average price of 330.47 (338.22 + 326.66 + 326.54) when the scaling in technique was used.
Here are the TPS trading rules for sell signals:
- The price must trade below the 200-day EMA.
- 2-period RSI must be overbought (below 75 level) for two consecutive days.
- On the second day, sell 10% of your position on the close.
- On the third day, if the price closes higher than your previous entry price, average in and sell 20% more of your position
- On the fourth day, if the price closes higher than your previous entry price, average in and sell 30% more of your position
- On the fifth day, if the price closes higher than your previous entry price, average in and sell 40% more of your position
- When the 2-period RSI is in oversold territory (below 30 level) take profits at the closing price of that day
Note* While we’re averaging into the TPS trade, it’s important for the price to remain below the 200-day EMA at all time.
Now, let’s go over a short TPS trade example.
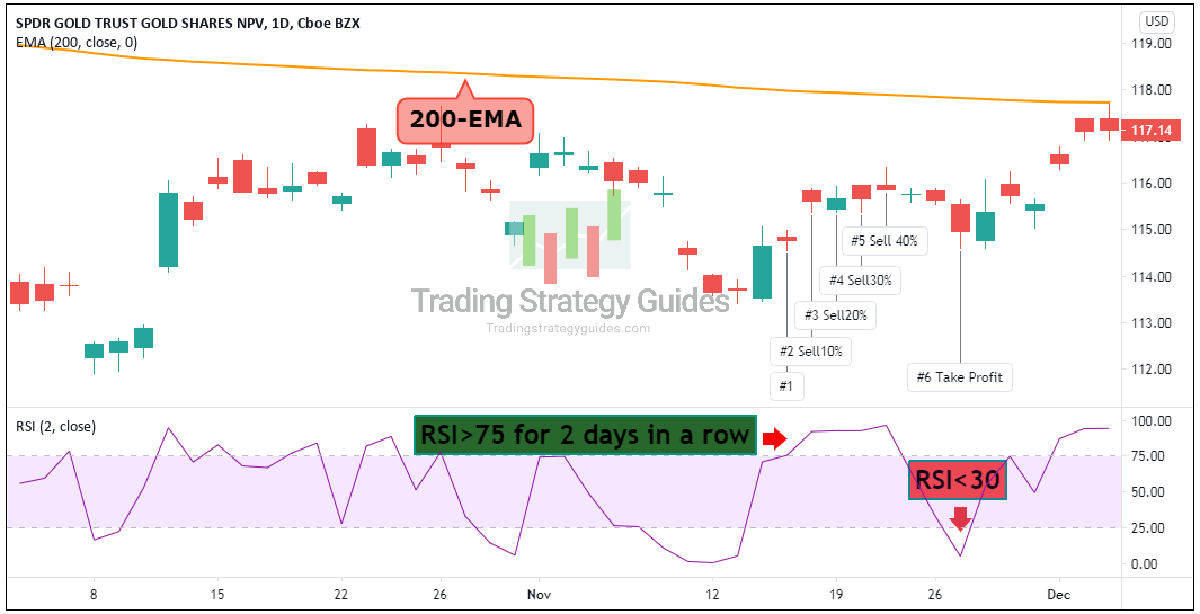
See chart below of gold ETF – SPDR Gold Trust (GLD):
And, here is how the short TPS trade process works:
- GLD is below 200-day EMA and RSI closes for the first day above 75 level.
- RSI closes above 75 level for the second day in a row – we sell 10% at the close.
- Price closes higher than the first position entry – we sell 20% at the close.
- Price closes higher than the second position entry – we sell 30% at the close.
- Price closes higher than the third position entry, which ultimately gives us a short-term high – we sell 40% at the close.
- The 2-period RSI reaches oversold readings (below 30 level) – we lock in profits.
Let’s dive into some of the advantages of TPS trading.
See below:
Why Use TPS Trading
Here is why you want to use the TPS trading strategy:
- Is a high probability entry technique.
- The strategy works not only on ETFs but across all markets (stocks, currencies, cryptocurrencies, etc.).
- Scaling in obtains better prices.
- The strategy exploits well-known price patterns – trading pullbacks where risk is lowest.
Before we sum up everything, let’s cover when the best time to take a TPS trade is.
See below:
When is the Best Time to Take a TPS Trade?
The ideal TPS trade scenario is when we’re dealing with strong market trends.
Larry Connors’ 2 periods RSI is a very aggressive “filter” that is designed to help traders enter the market even on small pullbacks that otherwise you wouldn’t be able to capitalize on.
However, because we use a very short-term period for the RSI indicator it’s possible for the TPS trading strategy can work in a ranging market as well. But, you should test this idea first as we prefer using the system with trading markets.
Another question you might have is whether or not there is a risk in averaging down your TPS trade.
We answer this question below:
Is there a Danger of Averaging Down your TPS Trade?
Scaling into a losing position comes with some drawbacks. However, there are also a couple of advantages that scaling into a TPS trade can give you, namely:
- Timing your trades for entries doesn’t have to be 100% accurate.
- Scaling in allows you to actively manage your risk.
- Gives you a better average entry price.
- Minimize risk.
In a nutshell, when you scale into a TPS trade, you’re actually averaging down as each consecutive entry is done after the price has fallen below the previous entry.
Usually, averaging down is a losing game.
As Paul Tudor Jones would say:
“Losers average losers.”
But let me explain why there is no danger to average down into a TPS trade.
The answer is quite simple:
Our risk remains the same 2% or 5% or 10% or whatever you’re comfortable to risk on any given trade.
For example, if you use the 2% rule in investing this means you’re limiting your risk to 2% per trade.
When you execute a TPS trade, you’re simply breaking down the 2% amount into 4 smaller trades, while you risk no more than 2% of your trading capital.
For example, let’s say you want to buy 100 shares of SPDR S&P 500 ETF Trust (SPY) which represents 2% of your account balance.
To scale in according to the 1-2-3-4 technique, you should break down your trade into 4 smaller trades as follow:
- Trade #1= 10 shares.
- Trade #2 = 20 shares.
- Trade #3 = 30 shares.
- Trade #4 = 40 shares.
In total, you have just accumulated 100 shares which are still only 2% of your account balance.
I hope this clears out any confusion.
Check our guide on How to Build a Trading Risk Management Strategy if you want to have a solid foundation on risk management.
Final Words – TPS System
In summary, this is not just an “off the shelf” trading system that yields extraordinary results because Larry Connors mentioned in his book High Probability ETF Trading that there are tens of thousands of variations to the TPS trade.
Even though we trade based on the daily chart, the TPS trading strategy remains a short-term trading strategy that requires continuous management.
Here is a quick summary of what you’ve learned today:
- TPS system can be applied not just to ETFs, but also on stocks, currencies, cryptocurrencies, etc.
- The TPS trade combines time, price and scaling in.
- Technical indicators required: 200-day EMA and 2-period RSI.
- Break down your position into 4 TPS trades.
- Trading pullbacks is less risky.
- The best time to use the TPS trading system is with strong trends.
Thank you for reading!
Interested in learning about Bitcoin trading? Click here and learn how to apply the TPS system in practice.
Feel free to leave any comments below, we do read them all and will respond.
Also, please give this strategy a 5 star if you enjoyed it!
[ratings]




it seems a good system but there is no mention of Stop Loss.va inserted? or not … and where?