

Simple SAR Indicator Review – MetaTrader Indicator

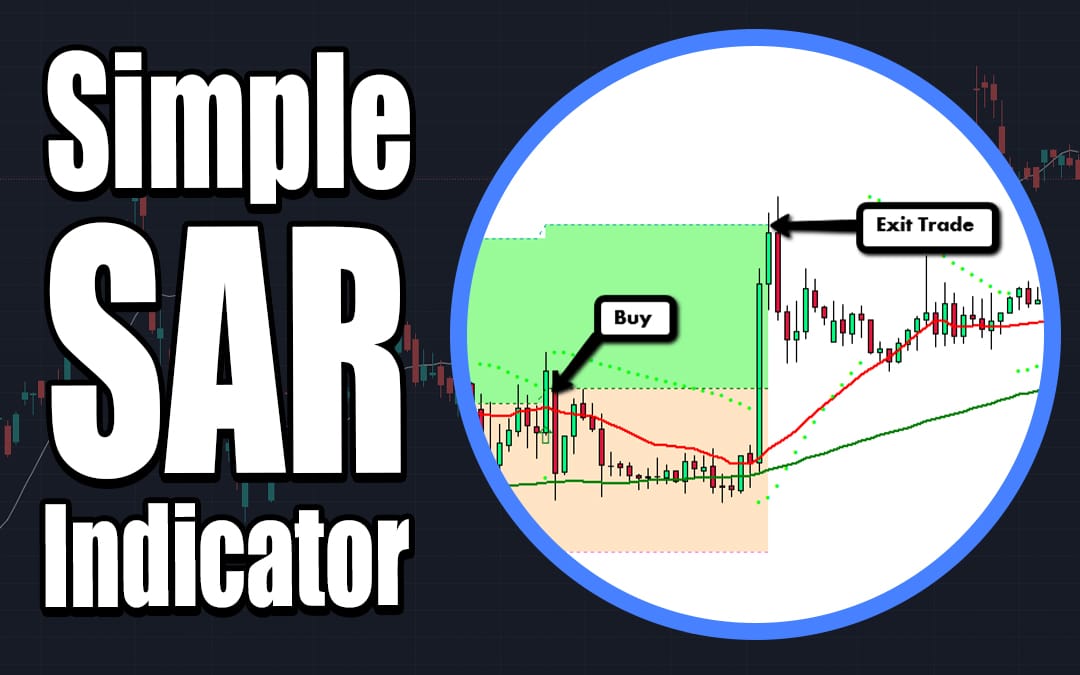
1. Simple SAR Indicator – What is it?
Simply put, the Simple SAR Indicator shows the user trend reversals. It uses some of the oldest and the most reliable indicators out there: Moving Averages and Parabolic SAR (Stop and Reverse). The main idea of this tool is to find out the precise moment of a price direction change. This is done by waiting for a Moving Average cross and then pinpointing the appropriate moment to enter the trade, using the Parabolic SAR.
The simplest trade example can be seen in the image below:
2. Simple SAR Indicator plots
The indicator provides 11 plots:
Figure 3 – A list of indicator plots
There are 4 sets of plots to indicate trade flow:
- Entry signals (see “Buy signal” and “Sell signal” plots). These plots mark the entry bar with an arrow.
- Entry prices (see “Buy level” and “Sell level” plots). These plots draw the entry price of a position until it closes.
- Stop loss (see “Buy stop loss level” and “Sell stop loss level” plots). These plots indicate the stop loss level of a position until it closes.
- Take profit (see “Buy take profit level” and “Sell take profit level” plots). These plots indicate the take profit level of a position until it closes.
An example of trade flow plots in action:
Figure 4 – Plots to indicate trade simulations
Besides the trade plots, there are 3 plots to depict main calculation lines of the Simple SAR: moving average and Parabolic SAR:
Figure 5 – MA and Parabolic SAR plots
3. Tuning the SAR indicator
3.1 Main calculation settings
There are 3 groups of settings that deal with algorithm:
Figure 6 – Settings Groups
The group of settings in the Red square adjusts Moving Average parameters. These include: period, method, applied price and Draw on Chart….
Blue group is about SAR parameters. It is standard as well
The most interesting settings to adjust are those in black square. These are the settings for adjusting the Simple SAR signals and Moving Average signals
The setting “Use signal type #1 (MAs cross with SAR confirms)” enables Moving Average cross plus Parabolic SAR confirmation mode: if the two Moving Averages cross at the same moment the Parabolic SAR is pointing in the same direction, then enter the trade. Most trades are this type of signal (see fig .1)
The setting “Use signal type #2 (SAR reverses with MAs confirm)” enables when Parabolic SAR direction does not coincide with MA cross (see the fig. 2). For this mode we seek a Parabolic SAR reversal and then check how long ago the Parabolic SAR cross was. We use this setting: «Max distance from MA cross, bars », to define how many bars back we can use to search for a cross
Figure 7 – Parabolic SAR reversal and preceding Moving Average cross
3.2 Stop loss/take profit calculation settings
Figure 8- Stop Loss/Take Profit Settings
3.2.1 Level calculation mode
There is a combo-box to choose which mode the user would like to use for stop loss/take profit calculation. There are 3 options:
- Do not calculate SL/TP. With this option, stop loss/take profit calculation is disabled.
- Calculate in points. When this option is chosen, stop loss and take profit value are set by points:
Figure 9 – SL/TP Points Settings
- Calculate in ATR. When this option is chosen, stop loss and take profit value are set by ATR coefficients:
Figure 10 – SL/TP ATR settings
3.2.2 Levels in points
This section is used when “Calculate in points” mode is active. Settings:
- Stop loss, points. Defines the stop loss size, in points
- Take profit, points. Defines the take profit size, in points
3.2.3 Levels in ATR
This section is used when “Calculate in ATR” mode is active. Settings:
- ATR period. Defines a period of ATR
- Stop loss, ATR multiplier. A multiplier to get a stop loss size from ATR value
- Take profit, ATR multiplier. A multiplier to get a take profit size from ATR value
3.2.4 Risk:Reward mode
Figure 11 – Risk:Reward Mode
These parameters can be used as an alternative way to specify a take profit level. With this option, you specify a Stop loss to Take profit ratio. Ratio 1:2 means a take profit will be 2 times larger than a stop loss. When this mode is enabled, “Take profit, points ” and “Take profit, ATR multiplier ” parameters are ignored, they will be recalculated automatically. For example, if you use points calculation mode and you stop loss = 200 points, and your risk:reward ratio is 1:3, then take profit size will be 600 points
3.2.5 Filling stop loss/take profit zones
For better comprehension, you can make indicator paint stop losses and take profits as solid zones:
Figure 12a – Zone Colors settings
Two charts, with disabled and enabled option are shown in the image below:
Figure 12b – Zone Colors Chart Example
This option is enabled by default.




You are getting less than half the trend price action most often. That is not good.
Hey Kurt, care to explain what you mean by this?