Revolutionize Your Trading Game in 2023 with Advanced Murrey Trading Strategy for the Pros!

Exciting Journey of Discovery and Unravel the Enigmatic Secrets of the Murrey Trading Strategy. Empower yourself with this game-changing knowledge and elevate your trading skills to unparalleled heights, gaining a competitive edge in the trading world!
A Murrey trading strategy was developed by T.H. Murrey in the 1990s. It is a technical analysis tool that is used to identify key levels of support and resistance in the market. The system is based on the idea that markets move in a series of waves that can be divided into specific price levels. These levels are based on the idea of “Gann angles” and are divided into eight different levels.
The Murrey Trading System can be used in any market, including stocks, commodities, and Forex. It is designed to help traders identify key levels of support and resistance, which can be used to make trading decisions. The system uses a combination of mathematical calculations and chart analysis to identify these levels. Traders can use this information to enter and exit trades, as well as to set stop-loss levels.
Overall, the Murrey Trading Strategy to boost trading performance is a powerful tool for traders who are looking to identify key levels of support and resistance in the market. It can be used in conjunction with other technical analysis tools to make informed trading decisions.
Murrey Trading Strategy Discussion platform.
Principles of Murrey Trading Strategy to boost trading Performance
Murrey trading is based on the following principles:
- Natural geometry and numerology are used to identify patterns and cycles in the market.
- Eight horizontal lines are used to represent key support and resistance levels in a trading range.
- These levels are derived from the price range of the previous trading period and are projected into the future.
- The even-numbered levels and mid-levels are considered key levels that can act as support or resistance for price action.
- Trading zones are identified by monitoring price action around the Murrey Math levels and other technical indicators.
- The Murrey Math trading system is used as a guide rather than a precise prediction and should be used in conjunction with other technical analysis tools and market fundamentals.
- Traders can potentially identify profitable trading opportunities and determine entry and exit points for their trades by using the Murrey Math trading system in combination with other tools.
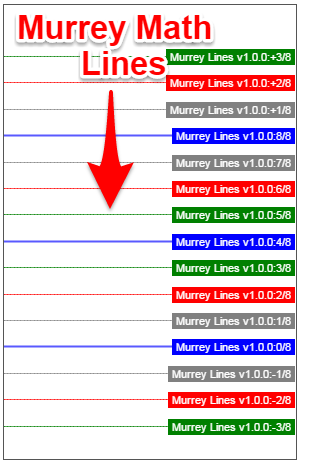
Murrey Math Trading Lines and Indicators
In the financial markets, Murrey Math indicators determine support and resistance levels based on specific price levels. The Murrey Math Lines are drawn by dividing the price range into 8ths, with each 1/8th representing a specific level.
The levels are called indicators, labeled as follows:
[0/8] – the lowest level, also known as the starting point
e [0/8] level is the lowest level on the Murrey Math Lines trading system, representing the beginning of a price
cycle and is considered a strong area of support. Traders may look for price action near this level to identify potential
buying opportunities, but a break below this level could signal a significant change in the trend.
[1/8] – strong support
The [1/8] level is considered a strong level of support. In technical analysis, support refers to a price level where
buying pressure is expected to be strong enough to prevent further price declines. Traders may look for price action
near the [1/8] level to identify potential buying opportunities, with the expectation that the price will bounce back up
from this level. However, a break below this level could signal a potential downtrend and may be an indication to exit
long positions.
[2/8] – weak support
The [2/8] level is a weaker level of support compared to [1/8]. Traders may look for price action near this level to
identify potential buying opportunities, however, a break below this level could indicate further price declines.
[3/8] – weak resistance
The [3/8] level on the Murrey Math Lines trading system is considered a weaker level of resistance compared to.
[4/8] – the central or pivotal level, which is also known as the balance point or the halfway point between the starting point and the highest level
The [4/8] level is considered the central or pivotal level, which is also known as the balance point or the halfway
point between the starting point and the highest level. This level is important to level to watch as it can provide
valuable information about potential market trends and trading opportunities.
[5/8] – weak resistance
The [5/8] level on the Murrey Math Lines trading system is considered a weaker level of resistance compared to
[6/8]. Traders may look for price action near this level to identify potential selling opportunities, but a break above
this level may indicate a likely uptrend and may be an indication to exit short positions.
[6/8] – strong resistance
According to Murrey Math Lines, the [6/8] level is considered to be a strong level of resistance. In technical analysis,
resistance refers to a price level where selling pressure is expected to be strong enough to prevent further price
increases. Traders may look for price action near the [6/8] level to identify potential selling opportunities, with the
expectation that the price will bounce back down from this level. However, a break above this level could signal a
likely uptrend and may be an indication to enter long positions.
[7/8] – the highest level
The [7/8] level on the Murrey Math Lines trading system is the highest, representing the end of a price cycle and
considered a strong area of resistance. Traders may look for price action near this level to identify potential selling
opportunities, but a break above this level could signal a likely uptrend and may be an indication to enter long
positions.

Murrey Lines indicator can be found on the most popular Forex trading platforms (MT4 and TradingView) under the indicators library.
The Murrey lines have nine main components or variables plus 6 extra pivots that can reveal extreme overbought or oversold conditions and each of them will tell you a different story about the price action as follow:
· [+3/8]P – Imminent Bearish reversal
· [+2/8]P – Extreme Overshoot conditions, can reverse anytime
· [+1/8]P – Overshoot conditions
· [8/8]P – Ultimate resistance, extremely overbought conditions
· [7/8]P – Weak level, a place to stop and reverse
· [6/8]P – Strong pivot reverse
· [5/8]P – Top of the trading range
· [4/8]P – Major support/resistance pivotal point
· [3/8]P – Bottom of the trading range
· [2/8]P – Strong, Pivot, reverse
· [1/8]P – Weak, place to stop and reverse
· [0/8]P – Hardest line to fall below, oversold conditions
· [-1/8]P – Oversold conditions
· [-2/8]P – Extreme oversold conditions, can reverse anytime
· [-3/8]P – Imminent bullish reversal
Now that we have a solid idea of what each of the Murrey lines represents it’s time to outline the Murrey trading rules. Without further ado, this is a step-by-step guide to Murrey trading:
Murrey Math Trading Lines Strategy
(Rules for A Buy Trade)

Step #1: Check the 15-Minute Time Frame and Make Sure We’re Trading Below the 4/8 Murrey Lines (the Middle Blue Line)
The first buying condition of the Murrey trading strategy that needs to be verified is that the price needs to trade below the 4/8 Murrey Lines. While this strategy can be applied to all time frames for the purpose of this Murrey trading strategy we’re going to use the 15-minute chart.
The Murrey lines are dynamic pivot points that change with flowing price action which is one of the reasons why the price action usually will be contained between 0/8 and 8/8 Murrey lines with the 4/8 pivot being the most important level. Also, read this strategy about day trading price action.
It’s not enough for the price to trade below the 4/8 Murrey Lines which brings us to the next condition of the Murrey Math Trading Lines Strategy:
Step #2: Once the Price is Trading Below the 4/8 Murrey Lines it Also Needs to Trade Below the 2/8 Murrey Lines.
The main reason why we also need the price to dip below the 2/8 Murrey Lines is that we need the price structure to create space between the Murrey lines. This will ensure that once we break higher again, it will increase the probability of successfully breaking through the 4/8 Murrey lines.
A picture speaks a thousand words, so here is what you should be looking at:
Now, all we have to establish is where to enter our long trade, which brings us to the next step of our Murrey Math Trading Lines Strategy:
Step #3: Enter a Long Trade Once we Reverse and Break above the 4/8 Murrey Lines.
The 4/8 Murrey line is the line in the sand for the buyers and sellers and has the ability to correctly signal a shift in the market sentiment once it’s broken. In this regard, we want to enter with a buy market order as soon as we broke above the 4/8 Murrey lines.
Alternatively, if you want to be more conservative you can always wait for the breakout candle closing price to make sure it’s a genuine breakout.
Now it’s time to learn where it’s the ideal place to hide our stop loss, which brings us to the next step:
Step #4: Place Your Protective Stop Loss Below the 0/8 Murrey Lines
The 0/8 Murrey lines are the hardest pivot for the price to fall below which is the reason why it’s the ideal place to hide our protective stop loss order. There is also no need to add any extra buffer as we don’t want to lose more than it is necessary.
Now, let’s move forward and establish where to take our profits:
Step #5: Take Partial Profits (Preferably 50% off Your Entire Order) at 6/8 Murrey Lines and Also Move the SL to BE
The 6/8 Murrey line is the first strong pivot from where the price can reverse so we want to take our profits right there. At the same time, the next action that you need to take is to protect your remaining position by moving your SL at BE.
Now let’s move forward and see where we should liquidate the remaining part of our trade.
Step #6: Take Final Profit at 8/8 Murrey Lines
Finally, we have to close our trade once we reach the 8/8 Murrey line which is the ultimate resistance level, signaling extremely overbought conditions in the market.
It’s important to mention that if the market is breaking the 4/8 pivotal point multiple times on both sides, it’s best to wait until you can clearly apply the Murrey trading setup by applying Step #1 through Step #3.
Note** The above was an example of a buy trade using the Murrey Math Trading Lines Strategy. Use the same rules – but in reverse – for a sell trade. In the figure below you can see an actual SELL trade example using the Murrey Math Trading Lines Strategy. Here are some of the trading conditions you want to avoid in the forex market.
Pros and Cons Of Murrey Trading
| Pros | Cons |
| Provides a systematic approach to technical analysis and helps traders identify potential support and resistance levels. | Can be subjective as traders may interpret the levels differently. |
| The levels are pre-defined and based on mathematical calculations, which can help traders save time and improve accuracy. | May not work well in all market conditions and can produce false signals. |
| Can be used on various timeframes and financial instruments, such as stocks, forex, and commodities. | Requires a good understanding of technical analysis and market trends. |
| Provides a clear structure to the market, making it easier for traders to identify potential trading opportunities. |
May not be suitable for all trading styles and risk tolerances |
| Can be used in combination with other technical indicators to improve accuracy. | Can be less effective in fast-moving markets. |
Final Thought:
The Murrey Trading Strategy can be helpful for traders who want to identify potential support and resistance
levels in the market. However, it’s important to approach this tool with a critical eye and understand that it’s not a
guaranteed predictor of market movements.
Traders should combine the Automated Murrey Trading Strategy to boost trading performance with other
technical indicators and analysis tools to make informed decisions. Additionally, traders should always keep risk
management strategy in mind and avoid relying solely on one trading system for long-term success.
Please leave a comment below if you have any questions about Murrey Trading Strategy!
Also, please give this strategy a 5 star if you enjoyed it!
[ratings]
Frequently Asked Questions
What is the Murrey Trading System?
- The Murrey Trading System is a technical analysis tool that provides a systematic approach to identifying potential support and resistance levels in the market.
How do the Murrey Trading strategies work?
- The system is based on pre-defined levels that are calculated using a mathematical formula. Traders use these levels to identify potential support and resistance zones, as well as potential entry and exit points.
What financial instruments can the Murrey Trading System be used on?
- The system can be used on various financial instruments, including stocks, forex, commodities, and indices.
Is the Murrey Trading Strategies suitable for all traders?
- The system may not be suitable for all traders as it requires a good understanding of technical analysis and market trends. Additionally, traders should use the system in combination with other indicators and analysis tools to make informed decisions.
Can the Murrey Trading System be used in combination with other indicators?
- Yes, traders can use the Murrey Trading System in combination with other technical indicators to improve accuracy.
How is the Murrey Trading Strategy used to enter and exit trades?
- Traders can use the Murrey Trading Strategy to enter trades at the support or resistance levels identified by the Murrey math lines. For example, a trader may enter a long trade when the price bounces off a support level, or a short trade when the price falls from a resistance level. Traders can exit trades when the price reaches the next support or resistance level, or when a stop-loss order is triggered.
Are there any limitations to the Murrey Trading Strategy?
- Like any trading strategy, the Murrey Trading Strategy has its limitations. It is a technical analysis tool that is based on historical data, and may not be effective in all market conditions. Traders should also use other technical indicators and fundamental analysis to confirm their trades.
Are there any resources available to learn more about the Murrey Trading Strategy?
- Yes, there are many resources available online to learn more about the Murrey Trading Strategy, including books, articles, and videos. Traders can also practice using the strategy on a demo trading account before trading with real money.


Hi Karthik good to see you here!!!
The problem with using the Murrey lines is that there are several versions of the indicator and some traders have found that different versions work with different time frames.
I have used the Murrey level with a daily chart quite successfully.
Spider
Hey Pat….nice to see u here as well…
yes indeed…..each TF gives different levels…u need to use it for the TF that u usually trade in…
the link for the MM indicator is here…
http://www.forexfactory.com/showpost.php?p=3250965&postcount=2038
Hi Karthik, I also use MM lines. They are very good for scalping a bounce in the direction of the intrady direction. I usually wait for price to retrace to a MM line and scalp to the next MM level on the 5min TF.
hi dudley….nice to know that u use it as well…..thats the advantage of using price action and MM lines…it works in all TFs provided u know what u r dealing with…
If you draw a bunch of lines on your chart after every specific small interval, it will always find support or resistance. Can it identify with a good probability where a pullback is going to occur? Otherwise, it’s a pure crap.
HI I M NEW TO TRADING AND ONLY KNOW THE JUST BASICS COULD YOU HELP ME TO LEARN HOW DO TRADE PROFFESIONALLY OR WHAT STEPS I HAVE TO TAKE TO BE GOOD TRADER PLSE HELP ME OUT. HOW I START WHETHER I READ BOOKSOR WHAT EFFORT SHOULD I TAKE PLEASE SUGGEST ME,,,,
Hi Raj,
thanks for the comment. there is no short cut method for becoming a trader…u need to spend long hours and several hours at it to make it as ur profession, just like how many years you spend in college trying to become an expert in your chosen field….just get some basic forex books to start off and then you need toslowly build on it….it is a long hard road, just like any other business/profession…