Mass Index – Ultimate Guide to Trend Reversal

The mass index indicator is the tool we recommend to use to spot market reversals. If you’ve ever been in a trend only to be stopped out and see it go back in your favor, this ultimate guide to trend reversal will be an amazing read. We’re going to help you how to spot trend reversals like a professional day trader.
If this is your first time on our website, our team at Trading Strategy Guides welcomes you. Make sure you hit the subscribe button, so you get your Free Trading Strategy every week directly into your email box.
Reversal trading is a dangerous game that is not suited for the novice trader. For the untrained eye, trend reversal can be like trying to catch a falling knife. A falling knife has no handle. Never try to catch it. Unconsciously, many people actually try this. But, we all know the end result of trying to catch a falling knife.
The same thing happens when you try to catch a trend reversal. So, how to tell when a trend is ending?
If you place a handle at one end of the knife and with enough practice you can learn how to spot trend reversals like a professional trader. In this analogy, the handle is the mass index trend reversal indicator.
Next, we’re going to talk about how you could potentially line up some clues to find out if a market may be ready to change direction. So, let’s define what is mass index.
What is Mass Index?
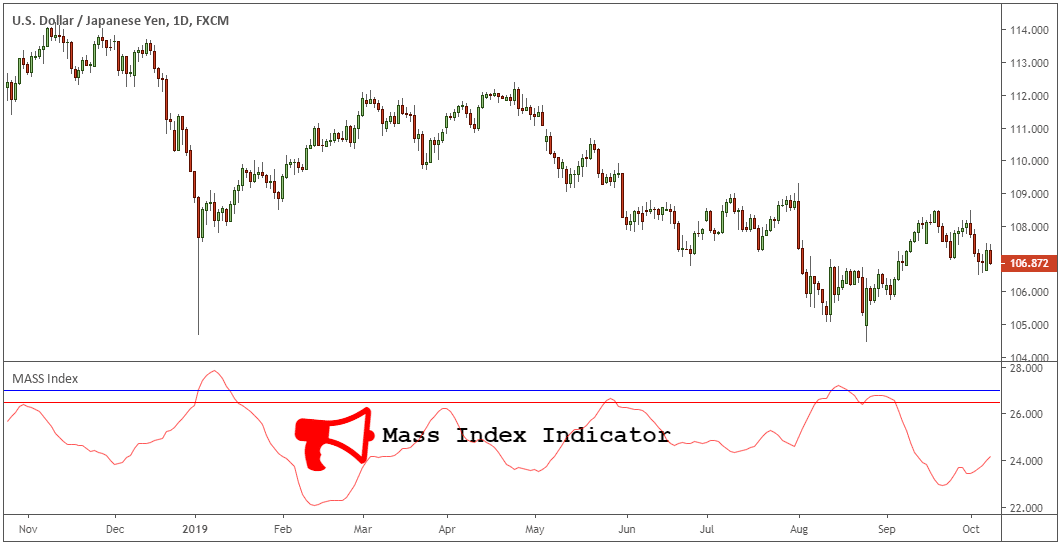
In technical analysis, mass index indicator, developed by Donald Dorsey, is a tool used to spot when a trend reversal is more likely to occur. Mass Index is part of the volatility indicators family that doesn’t have a directional bias. The Mass Index Indicator will make it easier to determine which direction a specific stock is moving.
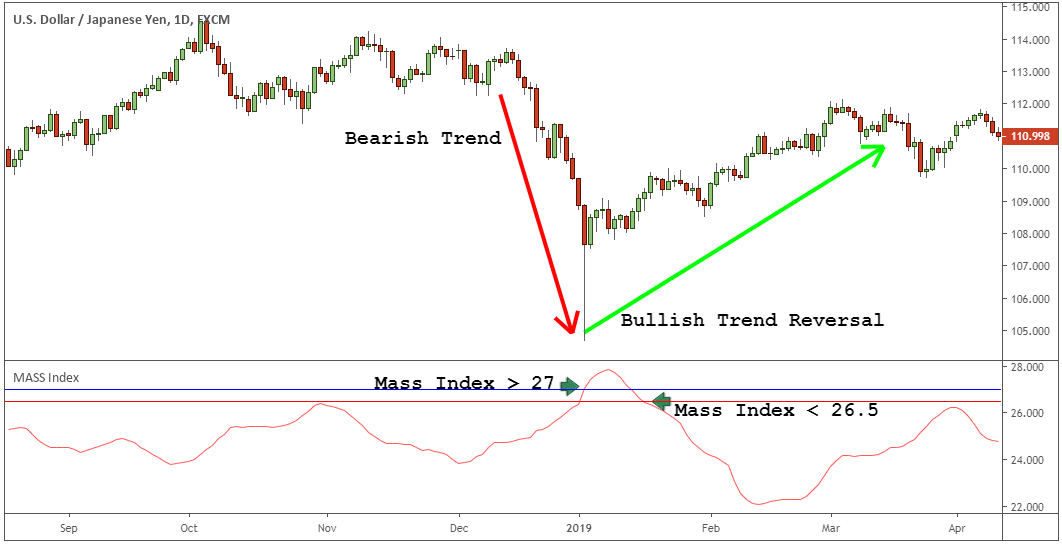
See mass index chart below:
Learn more about the different types of technical indicators here: Best Forex Indicators to Generate Buy and Sell Signals.
While the mass index can signal a possible change in the trend direction, it doesn’t tell us whether or not this is a bearish reversal or a bullish reversal signal. The idea behind the mass index indicator is that stock market reversals tend to occur when the daily price range widens. Or, in other words, stock price reversals occur when the volatility is high.
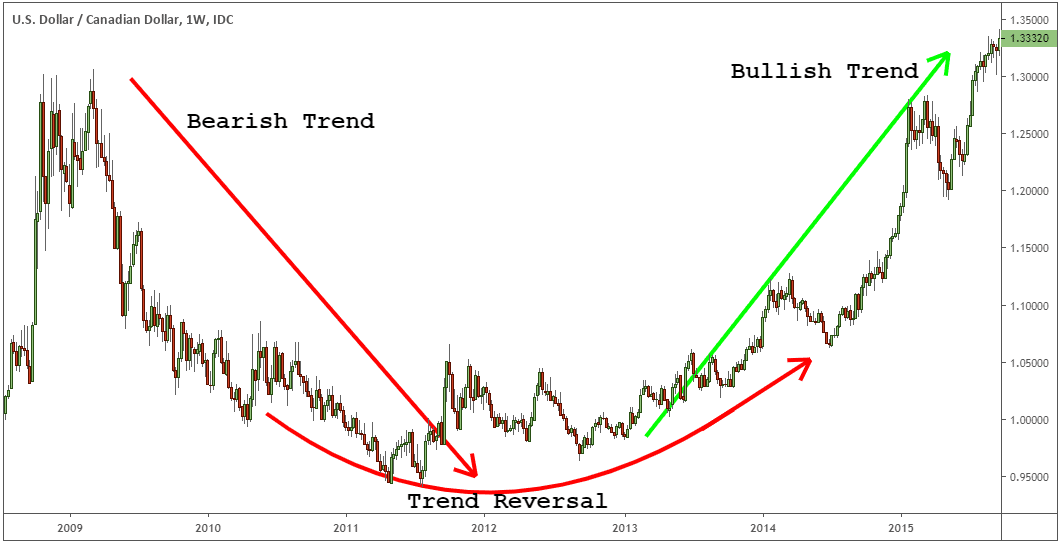
But what is a trend reversal?
In simple terms, a trend reversal is the end of one trend and the potential start of a new one.
Reversal Trading is pretty much what it sounds like; price turning and going in the opposite direction. Some reversals are merely retracements – the market taking a breath after a long run. Others are actual long-term market direction changes. The actual definitions separating the two terms depend upon your point of view.
Timing a reversal with a high degree of accuracy is one of the least investigated territories in technical analysis. But with the help of this reversal indicator, we can time the market.
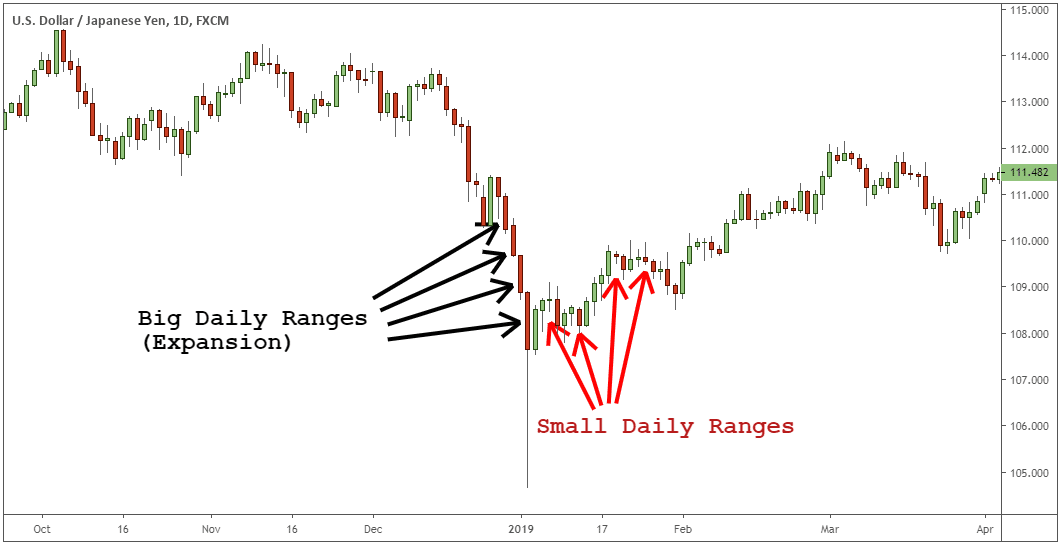
It’s no mystery that the natural rhythm of the price is to move in small ranges followed by expanding ranges. The daily range is the difference between the daily high and the daily low. The price movement oscillates from narrow to wide ranges and back again.
The mass index tool uses the daily high-low range to spot market reversals based on range expansion.
If you’re not confident in your trading skills to trade a dangerous pattern such as the reversal pattern, you can use our proprietary Strike 3.0 Reversal Strategy. If you want to try out the Strike 3.0 trading system, click here to learn how you can join us today for a low cost.
Let’s now examine how to use mass index indicator?
See below:
How to Use Mass Index Indicator?
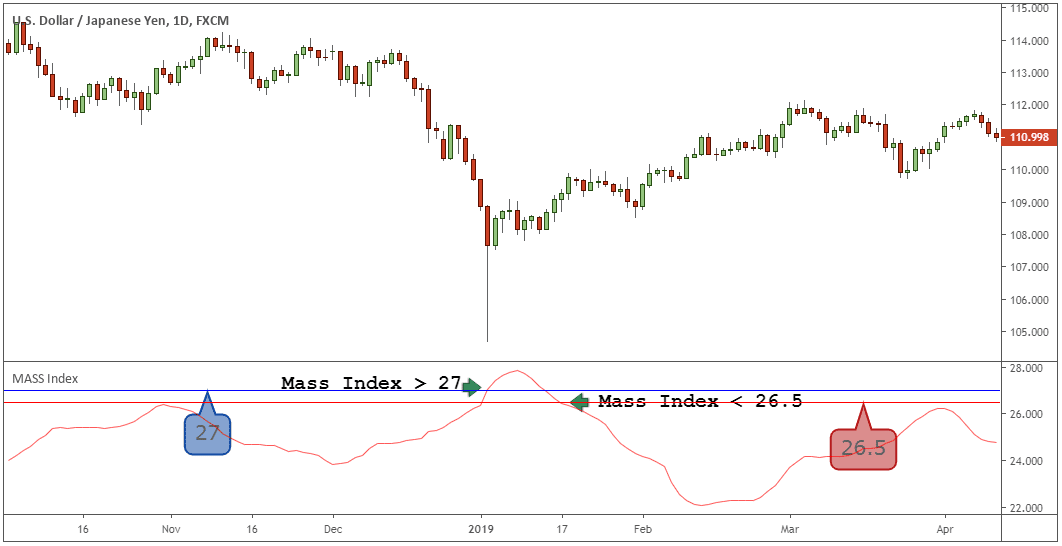
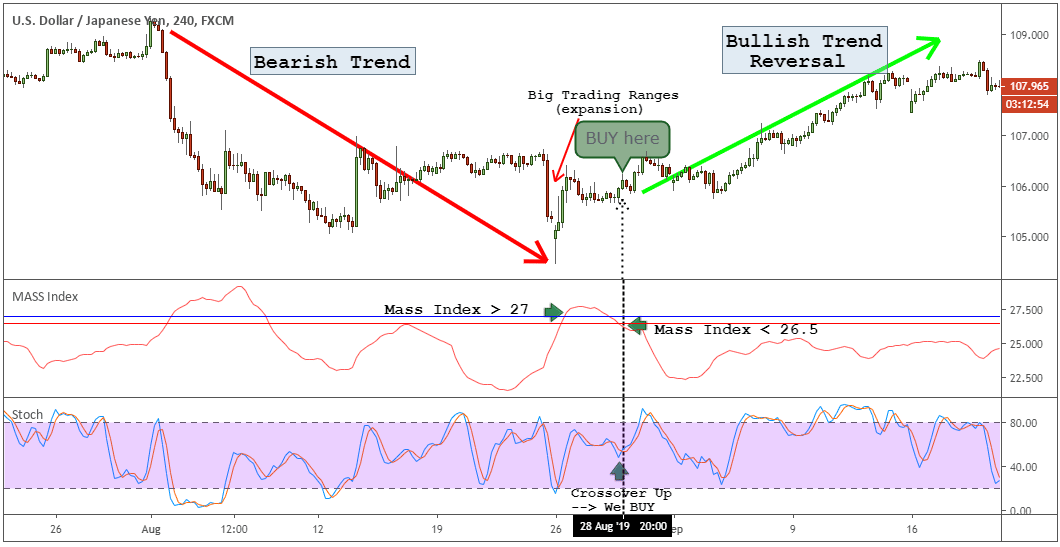
The way to interpret the readings on this volatility indicator is very simple. According to Donald Dorsey, a reversal signal occurs when a “reversal bulge” occurs. A reversal bulge is nothing more than following a combination of two trade signals:
- Max index value needs to go above 27 level.
- And, then wait for the index reading to drop below the 26.5 level.
See mass index chart below:
The initial reading above the 27 level only signals that the volatility expansion is at extreme. You need to be nimble at this stage because the reversal signal is not yet completed. You can consider that the prevailing trend may end in a short time.
In order to identify a change in the trend direction, the mass index reading needs to drop below the 26.5 level. At this stage, the reversal bulge is completed and you can open a trade. However, traders should use other technical tools to establish the direction of the reversal.
Usually, if a reversal bulge occurs during a downtrend, it signals a bullish trend reversal. However, if a reversal bulge occurs during an uptrend, it signals a bearish trend reversal.
In the mass index chart below we’ve highlighted a mass index bullish reversal signal:
Alternatively, you can use mass index to simply spot range expansions.
When the high-low range is expanding the mass index moving average will rise. But, when the high-low range narrows, the mass index moving average will fall.
Now, let’s dive into examining when to use the mass index indicator?
See below:
When to Use Mass Index Indicator?
The mass index can be best used in conjunction with the price action. The mass index has demonstrated that it can measure the daily high-low range and forecast market turns with a deadly accuracy.
Trend reversals are determined through a meticulous step-by-step process using the daily high-low range expansion. Market turning points are hard to spot on a naked price chart, but with the use of this amazing trend reversal tool, you can clearly pick tops and bottoms.
Regardless of the different types of market conditions, when a reversal signal is issued by the mass index indicator, the results are the same. It doesn’t matter the degree which the market will reverse, the certainty is that at least a pullback will follow the trend reversal signal.
Learning how to profit from trading pullbacks is simply the most profitable approach to trading. See How to Profit from Trading Pullbacks.
Let’s give you a simple reason why this trend reversal tool is so powerful:
Why Use Mass Index Indicator?
Reversal trading is the most profitable form of trading. Catching top and bottoms gives you the chance to participate in a trend, right from the very start. Determining the start of a new trend can open up the door for potentially riding bigger swing waves and subsequently making bigger profits.
Billionaire hedge fund manager Paul Tudor Jones, founder of Tudor Investment Corporation who predicted the 1987 stock market crash said:
“I believe the very best money is made at the market turns. Everyone says you get killed trying to pick tops and bottoms and you make all your money by playing the trend in the middle. Well, for twelve years I have been missing the meat in the middle, but I have made a lot of money at tops and bottoms.”
If you want to learn how to trade like hedge fund manager PT Jones better start using the mass index strategy. Hedge funds are very diverse in nature and they have the ability and the technical know-how to implement exotic and complex hedging strategies. Learn here more about their tactics: Hedge Fund Strategies and Tools used on Wall Street.
The trade concepts we try to implement is to try to look for clues in the market that a trend may be ready to reverse.
If you follow the reversal trading rules below, you’ll never be wrong in trading reversal again.
Mass Index Trend Reversal Strategy
Mass index trend reversal is a powerful strategy to detect trend changes. You can find money-making trading opportunities that evade most traders. We use two forex reversal indicators to develop this reversal trading strategy:
- The obvious mass index tool
- Stochastic indicator used to determine the directional signal.
Both of these forex reversal indicators will protect you from false reversal signals. As we already mentioned we use the trend reversal trading strategy in combination with the price. The secret to trading trend reversal like a professional trader is to combine the price with other technical tools.
That’s exactly what we try to accomplish here. As this will help you spot high probability bullish and bearish trend reversal signals.
Now you’re wondering:
“How do I combine all these pieces together to actually identify trend reversal trading setups that work?”
Knowing what indicators to use and what is the Best Combination of Technical Indicators can dramatically improve your chart reading skills. If you use the wrong technical indicators, this can lead to inaccurate price interpretation and subsequently to bad trading decisions.
The mass index trend reversal strategy can be broken down into a three-step process:
- Identify the reversal bulge on the mass index indicator.
- Identify the prevailing trend prior to the reversal bulge.
- Use the Stochastic indicator to generate a directional signal.
Here is how to actually do it:
Step #1 Identify the reversal Bulge
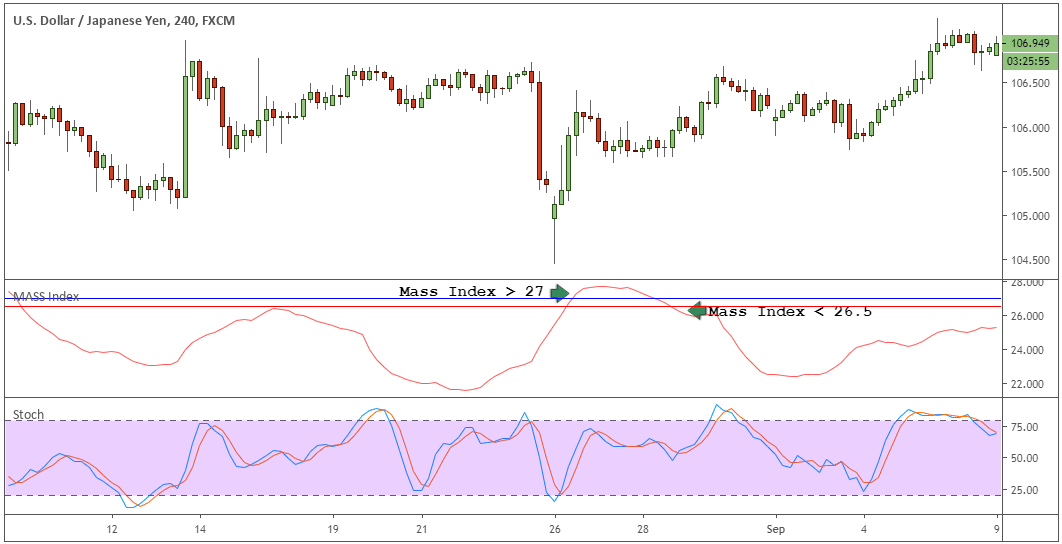
The mass index reversal bulge was already revealed at the beginning of this trend reversal guide.
The mass index must first go above the 27 level and then it needs to be followed by a drop back below the 26.5 level.
There is a high degree that the market will reverse from here.
That’s pretty much it. There is nothing we can add here as everything else comes down to the relationship between the price and the mass index reading.
See below:
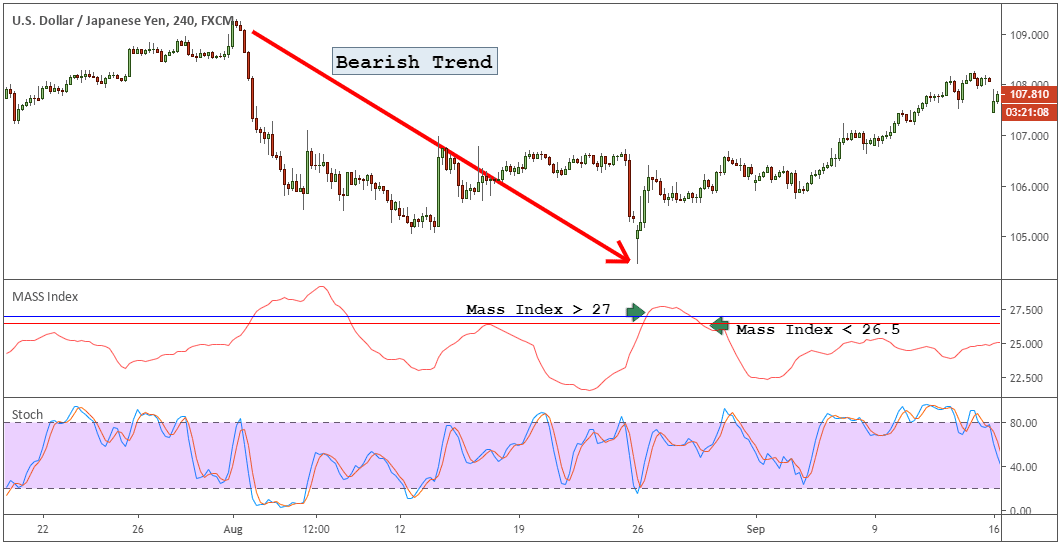
Step #2 Identify the Prevailing Trend
Always zoom out to have a clear picture of what is the prevailing trend.
The previous USD/JPY chart zoomed out revealed that the prevailing trend is bearish.
Naturally, we assume that a bullish reversal signal will follow. The trading bias is upwards once we correlated the mass index reading with the price action.
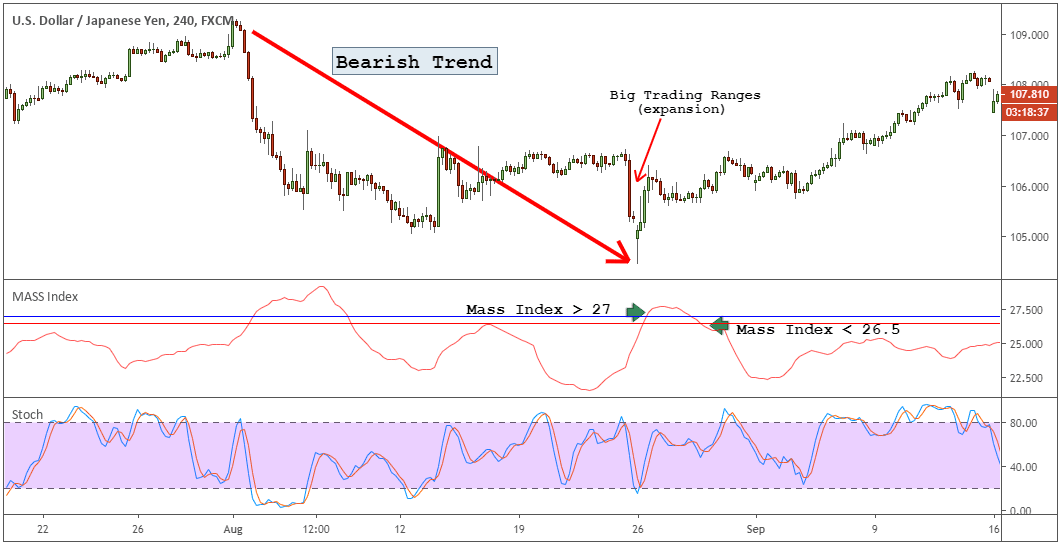
Generally, we also want to confirm that the price is expanding and that we’re indeed in the last stage of a trend. This information is revealed in the price chart. We simply compare the most recent candlestick bars with the previous ones.
Are the candlesticks expanding?
If yes, that’s what we need to see.
The bigger the candles are, the higher the change that a bigger trend reversal is going to develop.
So far, so good.
Huston, we have a problem.
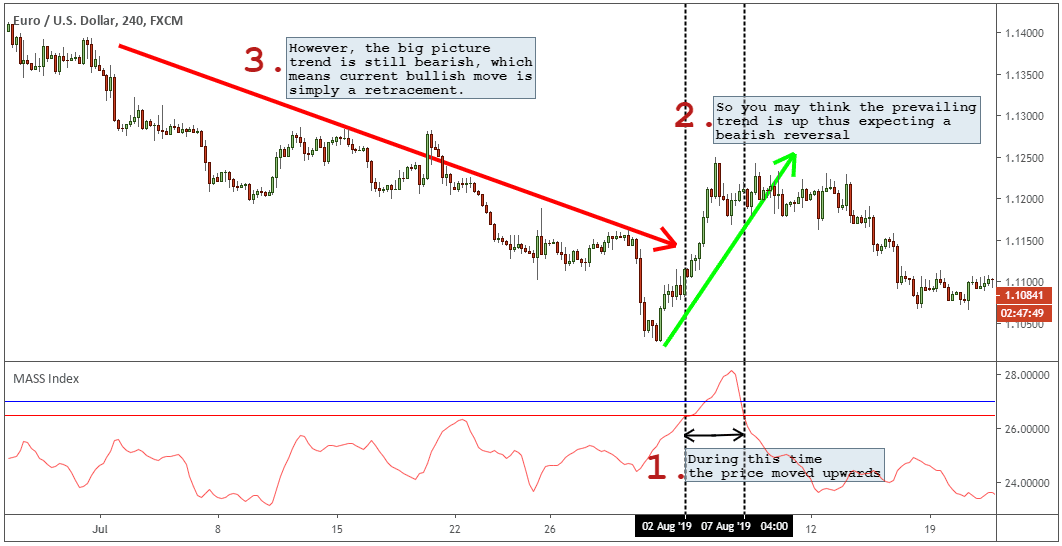
The mass index indicator is prone to also produce large moves by the time the mass index line it takes to drop back below the 26.5 level. This can create the false illusion of a trend. But, in reality this can be a simple trend pullback.
We’re going to teach you another great trick to use to capture trend retracements and pullbacks using the mass index.
Let me explain…
A picture is worth a thousand words.
So, better have a look at the mass index chart below:
In this case, we’re effectively trend trading.
See below the last step before pulling the trigger:
Step #3 Use the Stochastic for Trigger
We have established our trading bias and we have a mass index bullish reversal signal.
Next, is to wait for the stochastic indicator to provide us with a bullish signal to trigger our long trade.
The classical stochastic crossover is the most popular crossover trade signal. The stochastic bullish crossover occurs right after the mass index dropped below the 26.5 level.
This is our signal that the momentum has shifted to the upside and the trend is ready to reverse.
So, you can go ahead and deploy your soldiers aka the money to capture more soldiers.
There are always going to be pros and cons between reversal trading vs. trend trading.
But what type of trader should you become?
See below:
Should you be a Reversal Trader or Trend Trader?
Each trading style has its own merits and proper use. While trend trading gives you the advantage of trading in the direction of the prevailing momentum, reversal trading gives you the advantage to buy low, sell high. But, if you don’t know what is your trading style, the chance of succeeding as a reversal trader or as a trend trader is very slim.
If you’re searching for a trend following strategy that will turn your trading around make sure you check the MACD Trend Following Strategy.
You need to develop your strategy to accommodate reversal trading if you want to catch tops and bottoms. There is no right or wrong between trend trading vs. reversal trading.
The short answer is that you should be trading in a way to fit your own personality.
While the trend is your friend, not many have the discipline to stay in a trade riding a trend. The fact is reversal trading can be a quick way to make some profits. The advantage of reversal trading is that you can be in and out of the trade very fast.
Learn more about how to identify a Forex trend: Identifying Trends through Synchronization.
Final Words – Mass Index Chart
The Mass index indicator allows traders to predict trend reversals that other technical indicators may fail to notice. Using the mass index reversal bulge you can catch market tops and bottoms with deadly accuracy. You don’t have to be scared to try catching a falling knife. Most prominent hedge fund managers engage in reversal trading because it provides trade setups with high risk to reward ratios.
You can always keep a mass index chart on the sideline to check if your favorite market is about to end a big trend cycle. The secret to trading trend reversal like a pro is to simply stop being scared of engaging in this type of trade activity. Just make sure you use wise risk management strategies before you put at work your hard-earned money.
Thank you for reading!
Feel free to leave any comments below, we do read them all and will respond.
Also, please give this strategy a 5 star if you enjoyed it!
[ratings]
Please Share this Trading Strategy Below and keep it for your own personal use! Thanks Traders!

