Gartley Harmonic Pattern Trading Strategy

 The Gartley Harmonic pattern trading strategy will teach you how to trade the Gartley pattern and start making money with a new concept to technical analysis. The Gartley harmonic pattern is part of the Harmonic trading chart patterns.
Our team at Trading Strategy Guides is building the most comprehensive step-by-step guide into Harmonic trading, and we highly advise you to first start reading the introduction into the harmonic patterns which you can find here: Harmonic Pattern Trading Strategy- Easy Step By Step Guide.
It’s necessary to read the introductory article into the harmonic patterns as this will give you a better understanding of how to trade using the Harmonic Gartley trading strategy.
Over the years, many people have been looking at the market and seeing different things, but Scott Carney, who found the harmonic patterns, noticed that a certain pattern always appears to lead to good trading opportunities.
This chart pattern is called the Gartley chart pattern, also known as the Gartley 222.
In financial markets, there is one primary high-probability reason to enter a trade: a good risk to reward ratio that can ensure you’re always going to win more than you lose. And the Gartley chart pattern can help you achieve your financial goals. We also have training on How to Trade with the Gartley Pattern.
Introduction to Gartley Pattern
Trade management of open orders or taking the last small position of the week are tasks we can still do. But usually speaking, if you do any trading at all at the end of the trading week, you would want to keep the trading relatively light, especially if you are up in profit. Never give back what you earned in the first four days.
 The focus of this article is on Gartley Patterns and trading the patterns. The Gartley pattern was first introduced by H.M. Gartley in his book “Profits in the Stock Market” which was published in 1935. The pattern was named “The Gartley,” but in fact, many variations of the Gartley pattern have become common ever since the book’s release. Gartley patterns are chart patterns used in technical analysis and are known for their relationship using Fibonacci numbers and ratios. The Gartley pattern is a reversal pattern with clear rules and provides an excellent reward to risk.
“Classical” chart patterns are considered to be: flag, pennant, wedge pattern, triangle, range, rectangle, flat, head and shoulders, inverted head and shoulders, double top and bottom, trip top and bottom, gap, cup and handle, broadening top. Some of these patterns are reversal signals, others are continuation patterns. Most of the classical chart patterns use Fibonacci levels as well. A flag will typically find support levels at the various Fibonacci points (such as 23.6% and 38.2%) of various swing highs and lows but they are not so prominently used as in Gartley. Read more here.
5 Gartley Letters
The Gartley is using 5 letters to distinguish the 5 separate moves/waves/impulses. Here is an introduction:
- The letter X is the start of the trend.
- The letter A is the end of the trend.
- The letter B is the first pullback of the trend.
- The letter C is the pullback of the pullback (not breaking point A).
- The letter D is the target of the letter C.
The various Fibonacci relationships between XA and AB have a value when calculating targets for B, C, and D. Depending on the type of Fibonacci level the pattern is commonly named differently. The pattern is valid for both a down and an uptrend. In general, though, there is also a close link to the Elliott Wave Theory. The AB, BC, and CD legs are also known in EW as an ABC correction of XA and a continuation of the XA direction can be expected at point D.
Gartley and The Animals: Types of Gartley Patterns
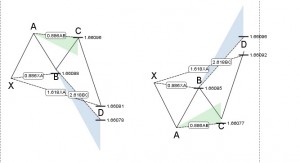
GARTLEY
This pattern is valid when the price respects and bounces off of the XA swing high swing low to form point B at the 61.8% Fibonacci retracement level. The target of point D is, in fact, using the same XA swing high swing low and is aiming for the 78.6% Fibonacci retracement level of XA. The CD leg is therefore often equal to the AB leg.

Other modern variations that have become popular are listed here below.
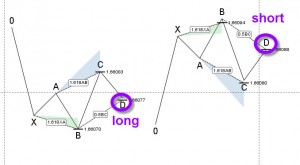
BAT PATTERN
This pattern is valid when price respects and bounces off of the XA swing high swing low to form point B at the 38.2% or 50% Fibonacci retracement levels (but not more than 61.8%). The target of point D is, in fact, using the same XA swing high swing low and is aiming for the 88.6% Fibonacci retracement level of XA. The CD leg is, therefore, longer than the AB leg.
ALTERNATE BAT PATTERN
This pattern is valid when price respects and bounces off of the XA swing high swing low to form point B at the 38.2% Fibonacci retracement level. The target of point D is beyond the origin of XA and is 1.13 of XA.
BUTTERFLY
This pattern is valid when price respects and bounces off of the XA swing high swing low to form point B at the 78.6% Fibonacci retracement level. The target of point D is beyond the origin of XA and is 1.27 – 1.618 of XA.
CRAB
This pattern is valid when price respects and bounces off of the XA swing high swing low to form point B at the 38.2%-61.8% Fibonacci retracement levels. The target of point D is beyond the origin of XA and is 1.618 of XA.
DEEP CRAB
This pattern is valid when price respects and bounces off of the XA swing high swing low to form point B at the 88.6% Fibonacci retracement level. The target of point D is beyond the origin of XA and is 1.618 of XA.
AB=CD, 5-0, DRIVERS
Here are the remainder of the popularized patterns. An example of 5-0:
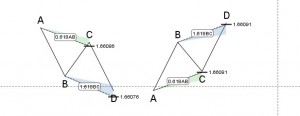
EXAMPLE OF AB=CD:
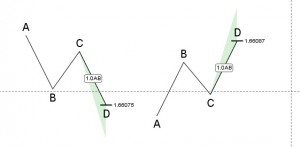
EXAMPLE OF DRIVERS:
SIMPLIFY: SPLIT OF LEVELS
When analyzing the patterns, it becomes obvious that different patterns play out depending on where letter B stops in relationship with XA. This is my attempt to make the patterns easier to interpret (drivers and 5-0 excluded).
PART I: Let us break it down into Fibonacci levels.
- 38.2% – Bat / Alternate Bat / Crab.
- 50% – Bat / Crab.
- 61.8% – (Bat) / Crab / Gartley / ab=cd.
- 78.6% – Butterfly.
- 88.6% – Deep Crab.
This means if the currency bounces up at the 38.2% for instance, then there could 3 Gartley patterns in play.
PART II: Let us continue with this breakdown and analyze the likely Fibs where letter C can stop when Fibbing AB and the answer is simple: C can stop at any Fib of AB, which is 38.2%, 50%, 61.8%, 78.6%, 88.6%.
PART III: The last but not least, the target D.
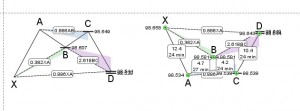
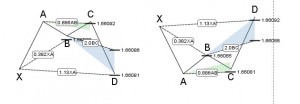
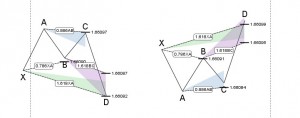
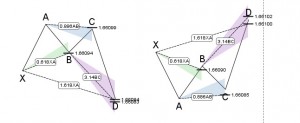
- Bat – 88.6% Fib of XA OR 2.618 of BC
- Alternate Bat – 113% Fib of XA (below X) OR 2.0 of BC
- Crab – 161.8% Fib (below X) OR 3.14 of BC
- Gartley – 78.6% Fib of XA OR 1.27 of BC
- Butterfly – 161.8% Fib (below X) OR 1.618 of BC
- Deep Crab – 161.8% Fib (below X) OR 2.618 of BC
Trading The Patterns
Trading the patterns forex is as always a matter of entry methodology. In general, it boils down to either entering upon a direct level, a confirmation, or a momentum break.
For the Gartley patterns mentioned here, a direct level entry means a pending entry order at a specific Fibonacci level. A confirmation would be to wait for a candlestick reversal pattern at the Fib. And the break-out would occur when the price bounces off the Fib and breaks a trend line in the anticipated direction. We also have training on how to use Japanese Candlesticks.
Please note that trading letter B is a with the trend setup but with a limited target (target is letter C). Trading letter C is a reversal trade but with a good reward to risk (target is letter D). Trading letter D could be seen as with the trend trade (very close to support and resistance in any case) and good reward to risk as well (target can be the top in uptrend example, bottom in downtrend example OR any Fib from C to D).
Check out this article on a step-by-step guide on the chart pattern trading strategy!
What is your opinion on the Gartley Pattern? Do you like trading these patterns? Do you want to use them? Do you like it? Do you already use Fibs? Has this helped your trade management? We gave a practical example of Gartley this week in the GBPAUD reversal article. Here are part 1 and part 2 (part 2 has the pattern) of the GBPAUD reversal.
Update 1: the bat screenshot was changed on October 13th.
Update 2: our reader Russell had good advice: read Scott M. Carney’s book Harmonic Trading books for an in-depth understanding of Gartley pattern trading.
Learn about Our Best Trend Trading Strategy.
Before we delve deeper into the Gartley trading strategy, let’s look at what indicators we need to successfully trade this strategy.
Harmonic Trading Patterns – Indicator
The advance in technology and the multitude of trading platforms available for traders has made the process of identifying the Harmonic Gartley quite easy.
Many platforms have built-in automated indicators that will draw the Gartley chart pattern and will help you have a better visualization of the pattern while at the same time making sure that it‘s following the Fibonacci ratios as per the rules.
You can find the Harmonic Patterns Indicator on the most popular Forex trading platforms (TradingView and MT4) in the indicator section. There is also some harmonic pattern software that can spot automatically the Gartley.
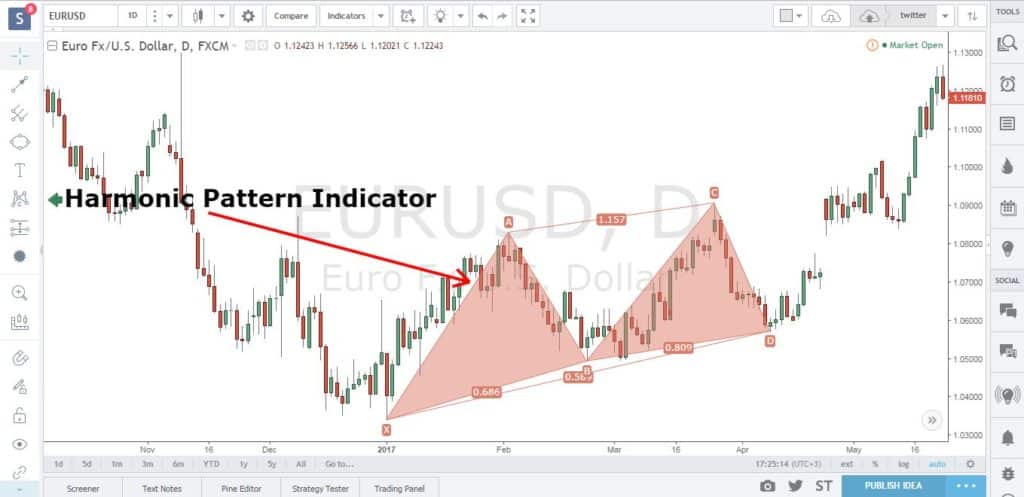
Now, let’s see how to trade the Gartley chart pattern.
How to Trade the Gartley Chart Pattern
The Gartley market strategy like any other harmonic pattern is a four-leg reversal pattern that follows specific Fibonacci ratios. A proper Gartley chart pattern needs to fulfill the following three Fibonacci rules:
- AB= retrace to 0.618 Fibonacci Retracement of XA leg;
- BC= minimum 38.2% and maximum 78.6% Fibonacci retracement of AB leg;
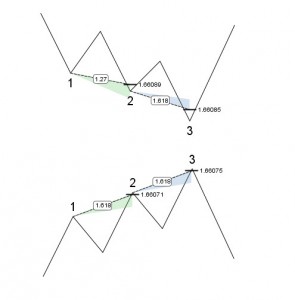
- CD= Poses a target between 1.27 – 1.618 Fibonacci extensions of the AB leg or an ideal target of 0.786 of XA leg. The Gartley harmonic shares some similarities with the Butterfly Harmonic Pattern.
*Note: The Fibonacci retracement and ratios are at the core of harmonic trading. Make sure the above rules are satisfied before you trade the Gartley harmonic pattern.
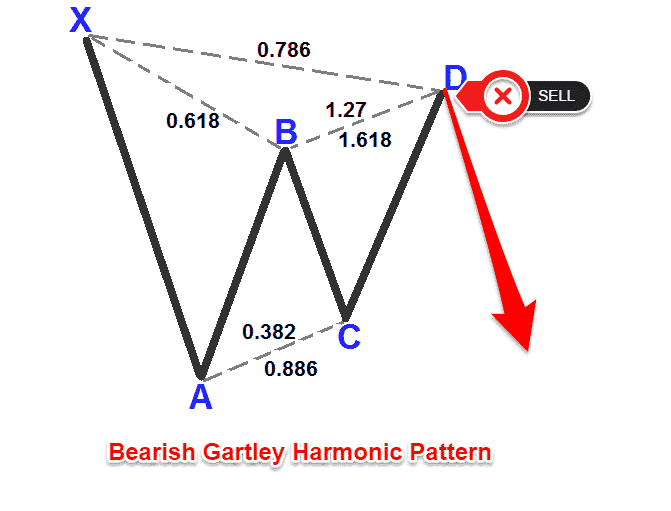
We have a five-points set up with the Gartley pattern labeled XABCD which are following the Fibonacci ratios. The key ratio involved in the harmonic trading Scott Carney PDF is 38.2%, 61.8%, 78.6%, and 100%.
Gartley chart patterns that lead to the double tops and double bottoms can be great areas for reversals in the market. Also, you can use Gartley in directional trades in the direction of the market.
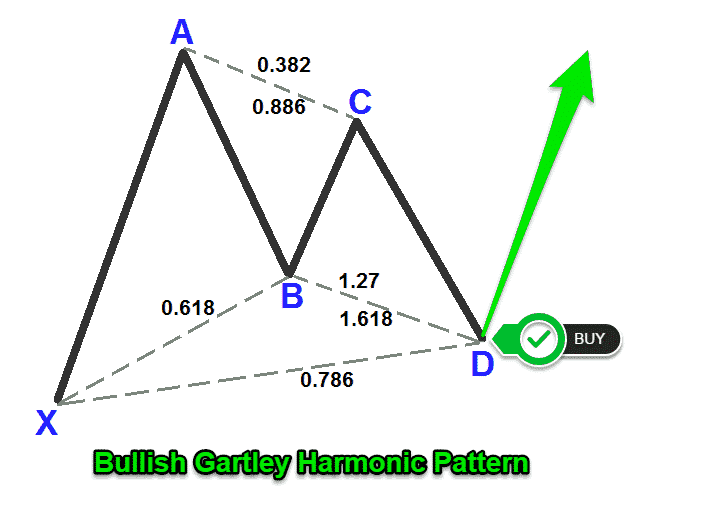
The key Fibonacci ratio that makes the Gartley apart from the other harmonic chart patterns is the shallow retracement of the AB swing leg which is only 61.8% of the XA leg.
Another characteristic of the Gartley 222 pattern is the symmetry that can be found inside the A through D swing wave. The AB swing leg can be equal to the CD swing leg to offer us an ideal low-risk high reward entry point.
Let’s take one step forward and see how you can make money applying the Gartley trading rules.
Gartley Harmonic Pattern Trading Strategy
The Gartley chart pattern is only giving us a possible entry point without telling much about where to place our protective stop loss and where to take the profits. Now, we can keep things simple and use the Gartley price structure to our advantage.
The Gartley Market Strategy has been tested across different asset classes (currencies, commodities, stocks, and cryptocurrencies).
We recommend that you take the time and backtest the harmonic bat patterns strategy before attempting to use this advanced pattern in your trading strategy.
Step #1: How to Draw Gartley Pattern
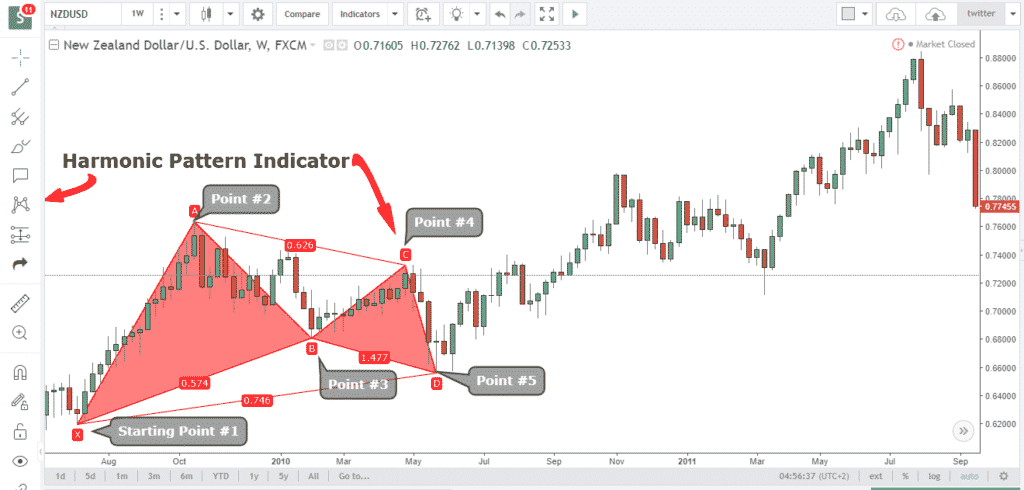
To learn how to draw Gartley pattern simply follow step by step guide – see figure below for a better understanding of the process:
- First, click on the harmonic pattern indicator which can be located on the right-hand side toolbar of the TradingView platform.
- Identify on the chart the starting point X, which can be any swing high or low point on the chart.
- Once you’ve located your first swing high/low point you simply have to follow the market swing wave movements.
- You need to have 4 points or 4 swings high/low points that bind together and form the harmonic bat pattern strategy. Every swing leg must be validated and abide by the Gartley forex Fibonacci ratios presented above.
Now, we’re going to lay down the Gartley trading rules.
See below…
*Note: For the purpose of this article, we’re going to use the case for a bullish Gartley harmonic.
Step #2: How to Trade Gartley Chart Pattern
BUY at Point D which should satisfy the requirement CD = 1.272 – 1.618 of AB leg.
Ideally, any trades taken using the Gartley harmonic are taken near point D.
Once a bullish Gartley price action has been identified and subsequently, the swing D leg in price has been formed thus generating a buy signal we can go one step forward and define a good location for our protective stop loss and an ideal target.
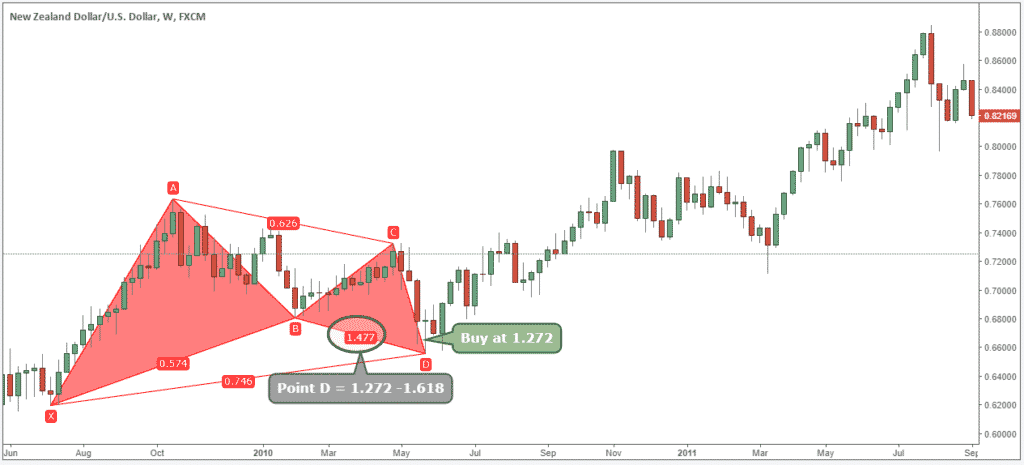
In the above chart, we can spot a bullish Gartley price pattern on the NZD/USD weekly chart, which is a signal to buy. You can sell anywhere between the 1.272 and 1.618 Fibonacci retracements, but for better timing your entry you can also use our price action guide – harmonic trading patterns or simply enter as soon as we hit 1.272.
It’s also worth to note that the Gartleylooks the same like a mirrored Cypher harmonic pattern.
The next important thing we need to establish is where to place our protective stop loss.
Step #3: Place the Protective Stop Loss below wave X
Usually, you want to place your protective stop loss below wave X. That’s the logical place to hide your stop loss because any break below will automatically invalidate the Fibonacci requirements for a Gartley harmonic.
The harmonic pattern success rate is solely dependent on these Fibonacci ratios. As a harmonic trader, you want to make sure Gartley satisfy these ratios.
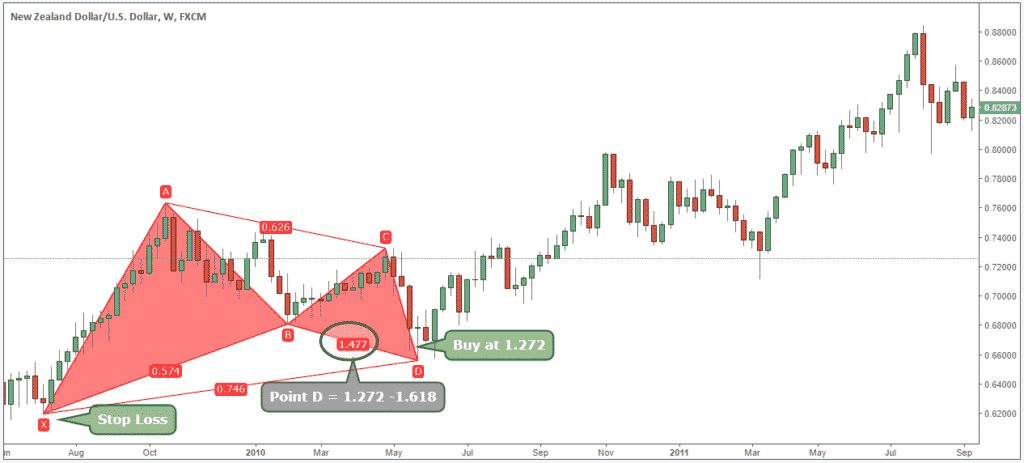
The next logical thing we need to establish for the Gartley harmonic pattern trading strategy is where to take profits.
See below…
Step #4: Take profit equals the same price distance of the XA swing leg as projected from the D point
Since the price is fractal in nature and repeats itself on different scales and different time frames we can make the best out of the Fibonacci ratios by looking for a move that starts from the point D and which is equal in price distance to the swing XA for our take profit target.
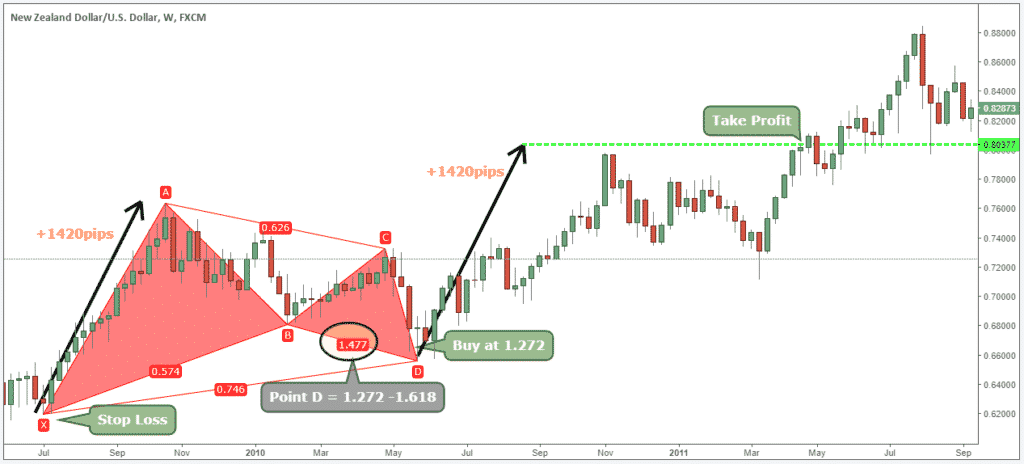
Now, there are many take profit strategies take can be applied here. We encourage everyone to experiment with different take profit strategies.
We’re not implying this is the best approach because we believe each harmonic Gartley can be unique depending on the Fibonacci ratios
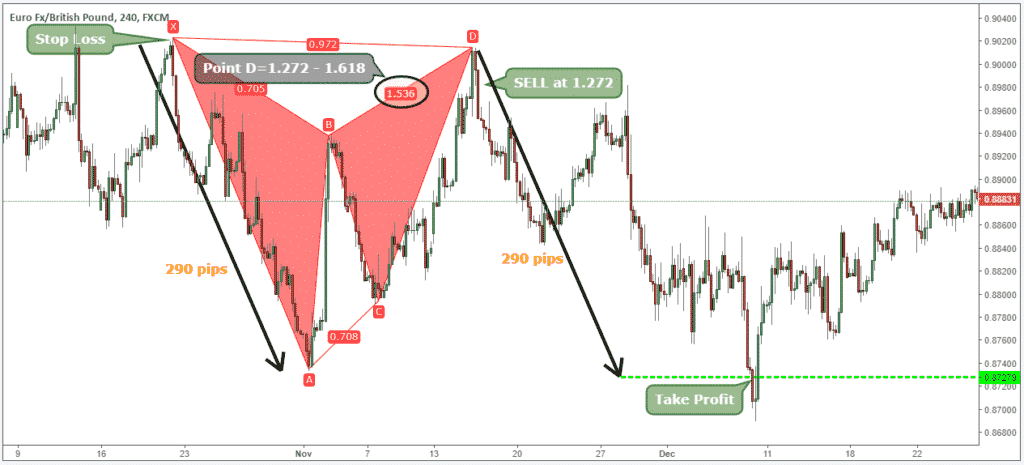
*Note: Above was an example of a BUY trade using the Bullish Gartley harmonic pattern trading strategy. Use the same rules for a SELL trade. In the figure below you can see an actual SELL trade example.
Conclusion – Harmonic Trading Patterns
Harmonic trading patterns solve one big puzzle for every trader because it gives you a reason as to when to buy and what currency pair to buy. This is a 77-year-old trading pattern that has stood the test of time and can provide great trading opportunities in terms of risk to reward ratio.
The Gartley pattern occurs very frequently and if you want to take advantage of this powerful pattern you can follow the rules of the Gartley Harmonic pattern trading strategy.
Please leave a comment below if you have any questions about this strategy!
Also, please give this strategy a 5 star if you enjoyed it!
To learn more about today’s best trading strategies, click here.
Please Share this Trading Strategy Below and keep it for your own personal use! Thanks, Traders!
[ratings]





We like helping people that is why 🙂 Gartley we stick to higher timeframes. usually over M30!
Explanation is very clear, and understandable
Hi there very cool web site!! Guy .. Beautiful .. Wonderful .. I will bookmark your site and take the feeds also?KI am glad to find numerous helpful information right here in the put up, we’d like develop more techniques in this regard, thank you for sharing. . . . . .