Signs Of A Range Breakout – The Trap That Gets 60%-70% of Traders

What are the Signs of a Range Breakout?
If you take a closer look at the market, you can conclude that at least 60–70% of the time trades are held in the price range without any pronounced direction, and only 30–40% of the time the market spends in a trending state. Proceeding from this, it is important for a trader to understand by what principle price ranges are formed, what exactly means their true breakdown, and also what price movements contribute to the continuation of the sideways trend.
Side logic
Many traders mistake price ranges for unprincipled random price fluctuations in which an asset resides before the advent of professional traders. Yes, the market is capable of accepting such conditions, especially before the holidays or when professionals have fixed their profits and have not yet decided in which direction to form the next trend, but such situations are realized in a smaller number of price ranges. In most cases, price ranges serve a different purpose – to redistribute positions from one holder to another and to lure new traders into unprofitable positions so that their stops later serve as building blocks for a new trend.
To begin with, let’s analyze the logic of the trend formation and the role of the sideways trend in the trend movement. As a rule, the price momentum is realized on average volumes, which move the market in the direction of the momentum. This indicates a clear imbalance between buyers and sellers. But at some point, the volumes that moved the market stop updating price extremes. This, in turn, indicates the strength of the opponents’ movement at the achieved level. The price moves back, as the desire to make deals opposite to the trend at the reached extremum is very great. And before moving the market further, these counter orders must be removed. After the formation of a backward movement, the asset again moves in the direction of the previous trend, but this movement just turns into a sideways trend, as a rule, located between the reached extremes. The first of them is the zone of activation of trend opponents, and the second is the zone of interest of the trend organizers. In a similar price range, positions are redistributed, luring new traders and canceling counter orders.
Make sure to check out our article on the best breakout strategy!
First of all, the redistribution of positions is carried out, since many traders who had positions in the direction of the trend, observing its obvious slowdown, fix their result (doing absolutely right in this situation), and professionals try to absorb these positions. At the same time, new participants wishing to make deals in the direction opposite to the previous trend enter the market, but their sideways deals do not bring a noticeable result. These participants either sit in positions close to zero in terms of the result, or fix profits and think about making the opposite deal – in the direction of the trend. Thus, the strength of the opponents of the trend is slowly being depleted, which can be seen from the decreasing trading volumes. And at the moment, professionals, as a rule, do a volume test, slightly piercing the border of the range, checking the residual strength of counterparties that are activated in such a case. And if this force is already small, as evidenced by a small volume (but in any case larger than in the sideways body), then the price sharply returns in the opposite direction and carries out another impulse in the direction of the trend.

Logic diagram of the trend and sideways
Thus, when a sideways formation forms, a trader should not so much make deals (this process should be minimized), but rather look at the sideways nature. This is necessary in order to determine which side to work on, and try to determine the moment of the sideways transition into the impulse phase of the trend. Moreover, the transition to the impulse phase of the trend in any case is realized through the breakdown of the sideline border, which can be both false and true, and these breakouts must be able to distinguish. Today we will talk about how to distinguish a false breakdown from a true one.
The Logic of False Range Breakouts
First, let’s look at how to identify a false breakout. To do this, let us analyze the most typical formations of false breakouts of the lateral boundaries. False breakouts are needed to lure new traders into wrong positions during trading and to test the opponents’ residual strength of movement. The main distinguishing feature of false breakouts is the minimum volume at the time of the breakout of the range, and the volume of trades can greatly increase before that. The second distinguishing feature of false breakouts is a large concentration of orders and trades towards a return to the trading range.
The most typical way of redistribution of positions and, at the same time, a volumetric test is the trampoline pattern, in which a sideways pattern is formed with pronounced boundaries, which automatically concentrate stop orders at these price levels. The springboard usually appears when the trading volume in the flat direction has already significantly decreased. The continuation of the sideways trend will provoke the closure of positions by the majority of participants, which means that the trend will have to be formed anew. In a similar situation, the price breaks the sideways border on small volumes in the direction opposite to the previous trend and abruptly returns to the sideways body. This already testifies to the weakness of the opponents of the movement. At this puncture, the participants’ stops are trimmed, since the lateral border was clearly expressed, and after such a redistribution, as a rule, a true impulse towards the trend begins.
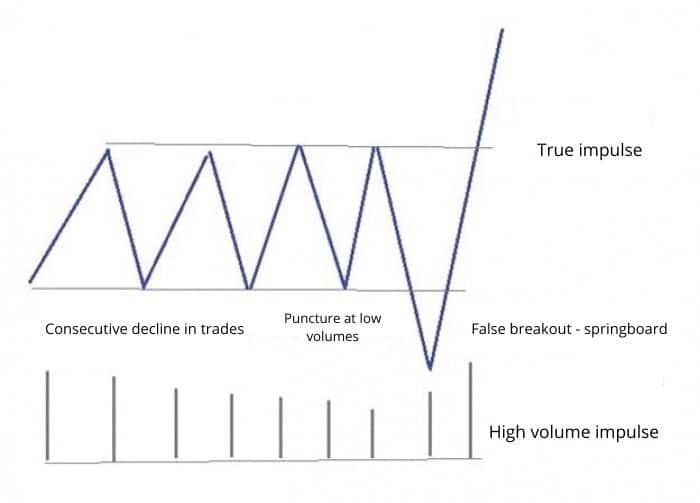 Springboard scheme
But false punctures can be not only in the final part of the sidewall, but also in the process of its formation. So, if the level is really interesting for both bulls and bears, then the price can swing in different directions, and at large volumes. This testifies to the struggle between professionals. In this case, the volumes in the body of the side will be increased, the candles will be long, and often replace each other in direction, as well as with long wicks on both sides. This situation is the most dangerous, so it is better to wait it out until the volumes decrease and a sign of a true breakdown appears.
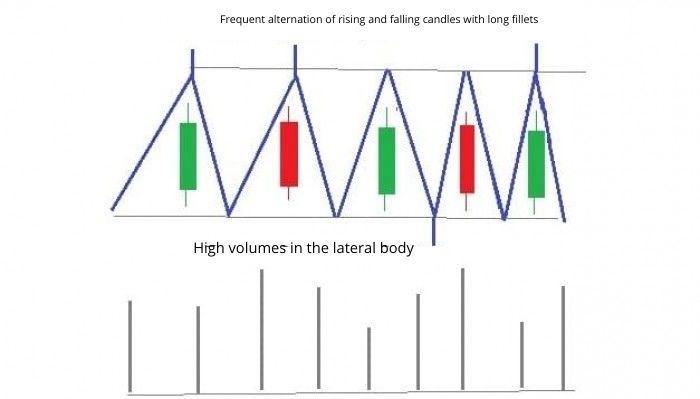
The scheme of the struggle of professionals
Often, before a false breakout, the price takes an engaging run-up – it shows an increased volume before reaching the lateral border and, as it were, lures the trading participants, pretending that the infusion of money from professionals has begun. A good analogy is sports: in order to jump over an obstacle, an athlete must jump before it, not after. The same thing happens in a similar situation, just the opposite. Volumes are poured in before reaching the border, that is, they adsorb liquidity that is still present in the sideways trend, otherwise this volume would move the price much more. Observing the high residual power of opponents, the pros use the following trading strategy: they continue to collect liquidity, but first they allow them to make a false breakout of the range in order to stretch traders along the stops.

Diagram of false breakout when taking off to an obstacle
Also, a sign of a false breakout of the level will be a reduced volume at the moment of breaking the sideways border, especially if there were a large number of candles with long wicks up to that moment. This in itself speaks of the desire of the pros to lure the participants. The appearance of punctures on the sideways borders in this situation is a kind of logical continuation of this picture, especially if the breakout is realized at increased volumes.
The Logic of True Breakouts
Any true breakout of the range should combine signs of completion of liquidity accumulation in the sideways body and increased volume towards the breakout. As a rule, a true breakout is not the first breakdown of a sideways trend, since first the passengers should disembark and trim stop orders, after which a cleared impulse in the direction of the trend is already launched.
Before a true breakout, the movements and orders of opponents are already minimal, and large trades in the direction of a true breakout move the market in the appropriate direction. This indicates the unobstructed path towards the breakout.
Often, before a true breakout, a series of candles appears in the direction of the breakdown, closing at their extremes or having small wicks. This indicates the weakness of the opponents of the breakout movement and indicates that the movement will continue rather than change. Moreover, the breakout itself is often carried out by a long candlestick, which closes at its extremum.
A true breakout is accompanied by an infusion of volumes that consistently move the market towards the breakout. Moreover, it is often possible to observe how the price is successively accelerated by making a series of large trades in the direction of breaking through the range.
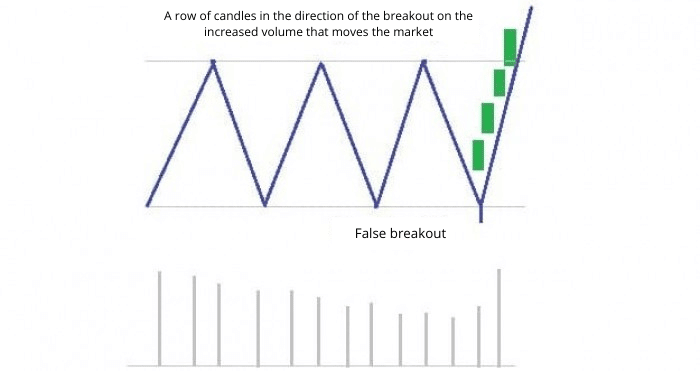
True breakdown circuit
Thus, a true breakout is carried out when the liquidity of the range levels has already become minimal and there has been at least one false breakout that has trimmed the stops. At the same time, a true breakout is accompanied by an increased volume, which moves the market towards the breakout.
Learning to ignore false breakouts and trade true exits outside the price flat, you can make profitable trades, while avoiding a lot of unreasonable ones. To do this, you need to be able to observe the nature of price range breakouts and understand the specifics of their formation.
BIO: Stacey Davis is a current marketing specialist in VeePN no logs VPN company. Stacey chose trading as a hobby. For more than three years Stacey has been studying the basics and techniques of trading. Stacey chose George Soros as an example to follow and dreams of achieving the same success in trading in the future.






thanks
great