Price Action Trading 101: Reading Charts Without Indicators

📚 Price Action Trading Mastery — Part 1 of 15
- Part 1: Price Action Trading 101: Reading the Chart Without Indicators (you are here)
⚡ Key Takeaways
- Price action trading focuses solely on chart movements to make trading decisions, ignoring all technical indicators.
- Understanding candlestick patterns, volume, and trend identification forms the core of reading price action.
- Practice identifying support/resistance and trend lines on clean charts to develop your chart reading skills.
Tired of lagging indicators and cluttered charts? Many traders feel overwhelmed by the sheer volume of signals and false dawns. This guide, Part 1 of our 15-part “Price Action Trading Mastery” series, cuts through that noise, showing you how to read the market as it unfolds, purely through price.
What is Price Action Trading?
Price action trading is simply analyzing the movement of an asset’s price over time to predict its future direction. You strip away all the complex indicators, oscillators, and overlays. What’s left is the raw battle between buyers and sellers, displayed directly on your chart.
This method focuses on candlesticks, chart patterns, and volume. It’s about understanding the psychology of the market in real-time. We’re looking for recurring patterns in how price behaves. This approach cuts through the noise, giving you a clearer picture.
The Language of Candlesticks
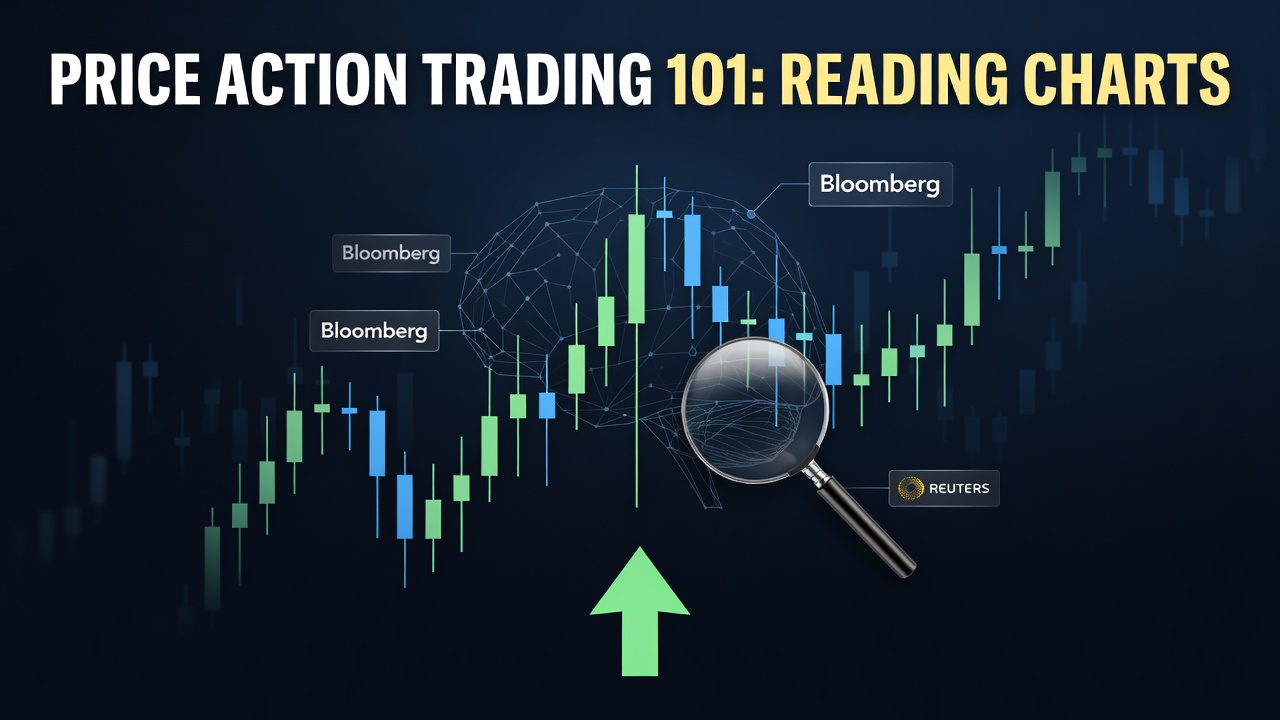
Candlesticks are your primary tool in price action analysis. Each candle tells a story about the open, high, low, and close price for a specific period. A green (or white) candle indicates the close was higher than the open, signaling buying pressure. A red (or black) candle means the close was lower than the open, indicating selling pressure.
The body of the candle shows the range between the open and close. The ‘wicks’ or ‘shadows’ extending from the body represent the high and low prices reached during that period. Long wicks suggest strong rejections of higher or lower prices. For example, a long upper wick on a bearish candle indicates buyers tried to push the price up but failed, and sellers took control by the close.
Consider SPY trading at $450. A strong green candle from $450 to $455 with minimal wicks suggests aggressive buying. Conversely, a long upper wick at $455, with the body closing at $451, shows buyers were rejected at the high. This rejection often signals potential reversal. For instance, if SPY opens at $450, rallies to $455, but closes at $451, it suggests upside exhaustion.
🎯 Get High-Probability Trade Setups — Free
The Big Dipper Dashboard delivers curated trade ideas straight to your screen every morning. Know what to watch before the opening bell.

Identifying Trends Without Indicators
Trends are the directional movement of price over time. An uptrend is characterized by higher highs and higher lows. A downtrend shows lower highs and lower lows. Sideways or range-bound markets lack clear directional movement.
To identify a trend, you literally just look at the peaks and troughs. In an uptrend, each new peak should be above the previous one, and each new trough should also be above the previous one. In a downtrend, each new peak should be below the previous one, and each new trough should also be below the previous one. Don’t overcomplicate it.
For example, if SPY climbs from $440, pulls back to $442, then rallies to $448, pulls back to $444, and then pushes to $452, you’re seeing clear higher highs and higher lows. This is a strong uptrend. You’d want to be looking for buying opportunities on pullbacks. Conversely, if SPY drops from $450, rallies to $446, drops to $442, rallies to $440, then drops to $435, that’s a downtrend. Look for selling opportunities on rallies.
The Role of Volume in Price Action
Volume represents the number of shares or contracts traded during a specific period. It acts as a confirmation for price movements. High volume accompanying a price move suggests conviction behind that move. Low volume suggests a lack of conviction.
If SPY breaks out of a consolidation pattern on exceptionally high volume, it’s a strong signal the move is legitimate. If it breaks out on low volume, it might be a false breakout. Consider this: SPY trades in a tight range between $445 and $447 for several hours with average volume. Then, it suddenly pushes above $447 on 3x its average volume. That’s a strong bullish signal. If it pushes above $447 on below-average volume, that move is suspect and often fails.
For example, if SPY is trading at $450, and a large red candle forms, dropping the price to $448, accompanied by significantly increased volume, it confirms strong selling pressure. If the same price drop happens on low volume, it could just be noise or a temporary pullback without strong bearish conviction.
Common Mistakes to Avoid
One common mistake is trying to force patterns where none exist. Not every cluster of candles forms a textbook pattern. Focus on clear, undeniable signals, not vague interpretations.
Another pitfall is ignoring the context of the larger timeframe. A powerful bullish candle on a 5-minute chart might be a mere blip within a dominant downtrend on the daily chart. Always check the bigger picture.
Finally, many traders jump into trades based on a single candlestick. While some individual candles can be powerful, confirming signals with subsequent price action or volume always strengthens your conviction. Don’t be too quick to act on incomplete information.
Frequently Asked Questions
What is the best timeframe for price action trading? The best timeframe depends on your trading style; shorter timeframes like 5-minute or 15-minute are for day traders, while longer timeframes like daily or weekly are for swing or position traders.
Can you trade price action without any indicators? Yes, price action trading fundamentally involves reading the raw chart without any technical indicators, relying solely on price movements and volume.
Is price action trading profitable? Yes, price action trading can be highly profitable for disciplined traders who master its principles and consistently apply them with sound risk management.
Next, we’ll move beyond simply reading the chart and dive into the critical skill of identifying and drawing Support and Resistance levels that actually hold.
📈 Want More? Join Our Free Trading Community
- Trading Strategy Guides Telegram — daily strategy tips and market insights
- Find Better Trades Telegram — free trade signals delivered to your phone
- Find Better Trades on YouTube — live trade breakdowns and tutorials