How to Use Volume Oscillator to Boost Your Profits
Learn how to use the volume oscillator to boost your profits. Volume-based trading can help you validate price movements in any instrument. The Volume Zone Oscillator will teach you how crucial volume is to confirm buy and sell trade signals. More the volume oscillator formula will reveal the math behind the Forex volume readings.
If this is your first time on our website, our team at Trading Strategy Guides welcomes you. Make sure you hit the subscribe button, so you get your Free Trading Strategy every week directly into your email box.
If you’re a new trader, it’s fair to you that you learn first How to Trade Forex for Beginners Guide.
Stock traders know the importance of volume analysis. Volume, open interest and price action are the key components in trading decisions. But, unlike stock and futures trading, the volume is rarely used in Forex trading. And, there is a good reason for that.
The foreign exchange market is a decentralized market where the trading operations are done over-the-counter. This means that there is no formula for volume or method of keeping track of the number of contract and contract sizes, such as in the stock market.
So, how is volume measured in the Forex market?
Can you use volume analysis in the Forex market, the same way as in the stock market?
Next, we’re going to answer all these questions and much more.
How to Gauge Volume in the Forex Market?
Volume is like the air we breath. Without volume, one can’t really make a sound trading decision. Volume is what makes price move and trend. If you’re a trend trader, day trader, swing trader or breakout trader you need some type of volume activity to see price movement.
Without volume (air) we can’t make a profit (breath).
Volume is what makes the price move.
When there is no volume, we typically end up taking a loss.
So, it’s important to not ignore Forex volume analysis.
If we have a good volume indicator to gauge the volume for us, we can eliminate some of the inevitable losses. In the long-term, this can be extremely beneficial to our bottom line. Understand that fewer losses you take, the more profits you’ll keep in your Forex trading account.
So, how do you measure volume in Forex?
The Forex market measures volume by counting the tick movements. The logic behind this is straightforward:
- Price moves up and down in ticks.
- The Forex market cannot measure how many contracts are sold, but it can measure how many ticks price moves up or down in any given time frame.
- It can still be measured by measuring how many ticks price moves up and down.
- Therefore, irrespective of how many transactions have been completed to make the price move, the net effect will be measured.
Volume in the Forex market focuses on the net effect, then analyzing the process. The volume oscillator formula is based on the above-mentioned principles.
Why Volume Oscillator is Important?
Very few traders know how to use volume analysis to increase their profits and minimize their losses. Many traders fail to observe why volume analysis is a powerful tool. We can even distinguish several types of volume indicators available on most trading platforms. But, strangely most traders don’t know how to use volume oscillators to maximize their profits. You may also be interested in the Bill Williams Awesome Oscillator Strategy.
The volume information is mostly useful because of its capability to draw attention to an unusual buying or selling activities. The price usually moves from periods of low volume activity to high volume activity. And, vice versa.
If you’re able to spot these activities of intense buying or selling, you can trade alongside the big players.
High buying and selling volume can generate trends and be the catalysts for the change in the trend direction. Volume analysis can help you see these trends before they are visible on the price chart itself.
Let’s define now what is volume oscillator and how to correctly interpret the information from this technical tool.
What is Volume Oscillator?
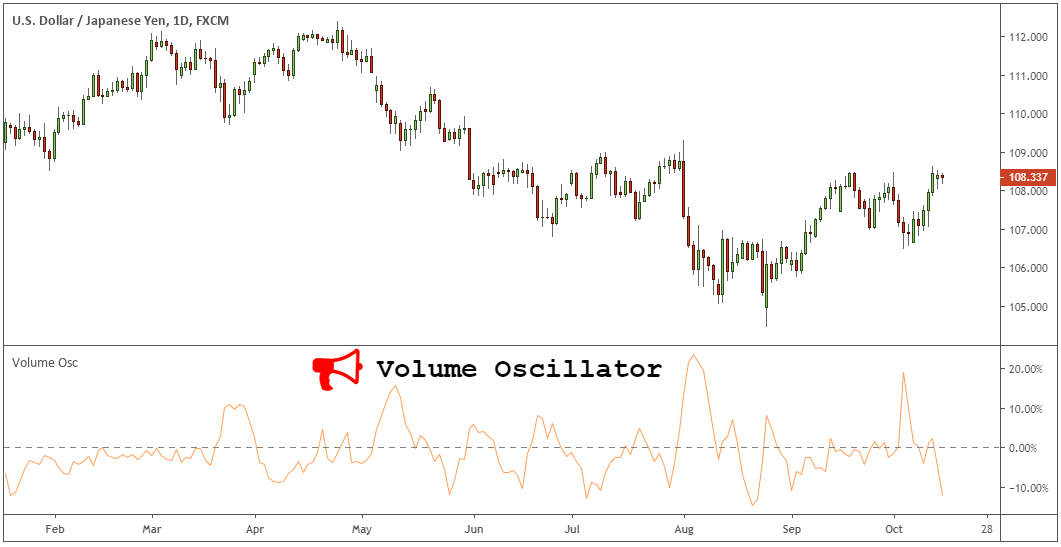
The volume oscillator is part of the oscillator family of indicators. Volume tracks the buying and selling activity over a given period of time. An oscillator is a technical tool that mostly has the shape of sine waves. The sine waves will vary over time, between a set band above and below a centerline.
The volume indicator is closely related to the volatility.
The oscillator measure volume as the difference between two moving averages:
- A fast-moving average, typically a 14-day period.
- And, a slow-moving average, typically a 28-day period.
The difference between the two moving averages is then plotted as a sine wave line expressed as a percentage. The Volume oscillator settings can be adjusted to fill in your trading needs.
The volume oscillator formula:
Volume Oscillator = [(Shorter Period SMA of Volume – Longer Period SMA of Volume) / Longer Period SMA of Volume] * 100
Let’s see how to use volume to confirm price trends:
How to Use Volume Oscillator Indicator?
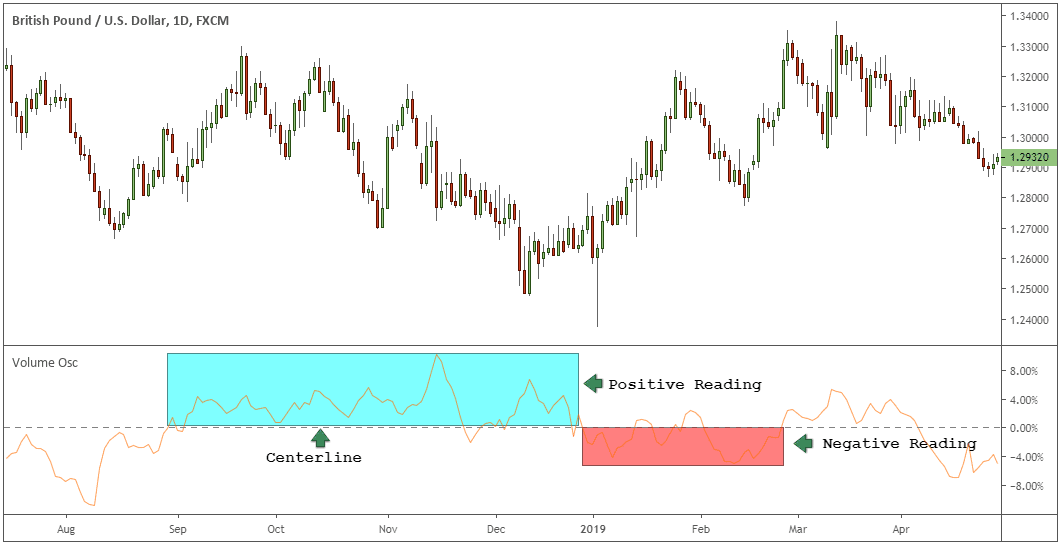
The oscillator moves above and below a centerline.
A move above the centerline will give us a positive reading. And, a move below the centerline will give us a negative reading.
Two basic cases can be derived from the volume readings:
- A positive reading signals a strong prevailing trend (bullish or bearish).
- A negative reading signals a weak trend that can become stagnant or reverse.
Volume is above the centerline when the fast MA is above the slow MA. And, the volume is below the centerline when slow MA is higher than the fast MA.
How to confirm trends with the Volume indicator?
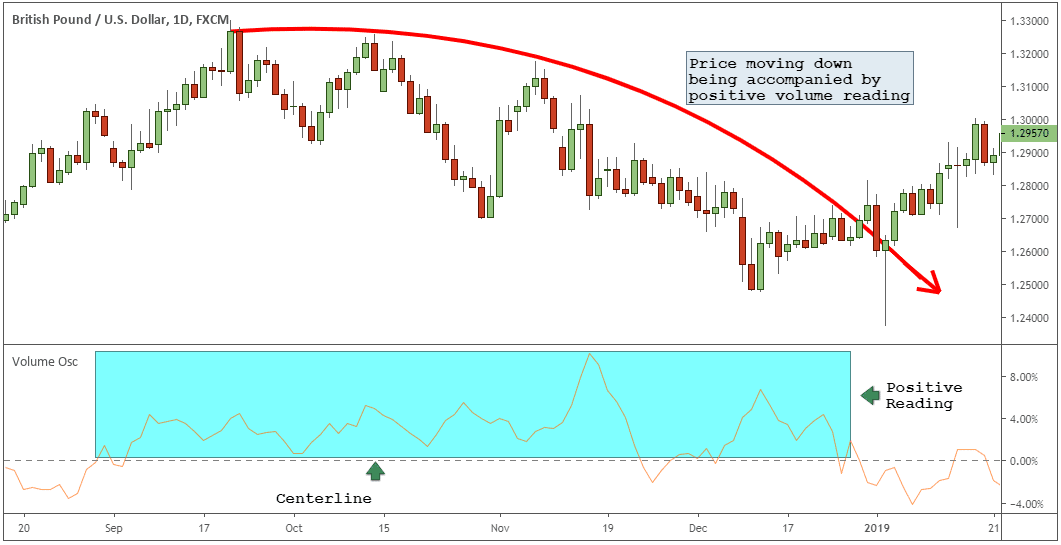
When the bullish or bearish trend is accompanied by an increase in volume, that’s a sign of strength in the prevailing trend. However, if an uptrend or downtrend is accompanied by a decrease in volume activity this is a sign of weakness in the prevailing trend.
The Volume oscillator can also be used as a confirmation indicator.
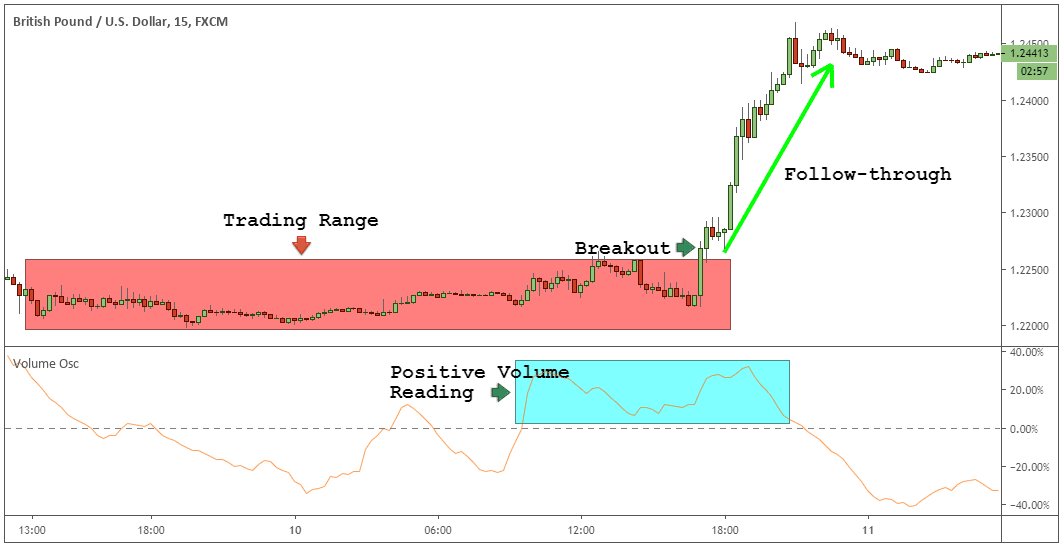
We can use it to confirm a breakout of support or resistance. For example, a breakout of resistance accompanied by increased volume indicates a strong move. This is a great tool to spot false breakouts.
While no trading system is 100% reliable, this oscillator is a nice tool to assess the strength of a breakout.
Do you want to use volume analysis in your trading?
Then you have to know the different types of Volume indicators that you can use.
Below, we’re going to outline the most popular Forex Volume indicators.
And, we’re going to reveal why Volume Zone Oscillator is our favorite FX volume indicator.
Types of Volume Indicators
There is a vast array of volume indicators. Here, we’re going to outline the most commonly used types of volume indicators:
- Rate of Change (ROC)
- Volume Bars
- Accumulation/Distribution
- Bid-Ask volume indicator
- Mass Index Oscillator – Check the strategy Mass Index – Ultimate Guide to Trend Reversal.
- Chaikin Money Flow – Using Volume Trading Strategy to Win 77% of Trades.
- On Balance Volume (OBV) – The Best Bitcoin Trading Strategy – 5 Simple Steps based on the OBV indicator.
- Money Flow Index (MFI) – Day Trading Cryptocurrency – How To Make $500/Day with Consistency using the MFI indicator.
- Volume Zone Oscillator (VZO)
- Percentage Volume Oscillator (PVO)
The ROC and VO are pure volume-based indicators. For example, OBV compares closing prices and volume. While MFI, Chaikin Money low compares closing prices, volume and price ranges.
Each indicator uses a slightly different volume oscillator formula, and therefore, your goal is to find the best volume indicator that suits your trading style.
Check the different types of Forex indicators available for traders to study: Best Forex Indicators to Generate Buy and Sell Signals.
So, what is the most effective volume indicator to trade the Forex market?
The Volume Zone Oscillator VZO is the best volume indicator to incorporate in your trading analysis.
Let’s start with the beginning.
What is Volume Zone Oscillator?
Volume Zone Oscillator (VZO) is a technical indicator that analyzes the buying and selling activity in relation to certain price zones. The main idea behind the VZO indicator is that volume precedes price.
The VZO is a relatively new indicator being introduced in the trading world in 2009 by Walid Khalil and David Steckler. But, it can be found on the most popular Forex trading platforms.
This volume-based indicator is combining two other Forex volume indicators:
- On-balance volume
- Money Flow Index
On top of that, the VZO indicator adds an exponential moving average to smooth the volume readings. The resulting curve is then plotted on a separate window below your price chart.
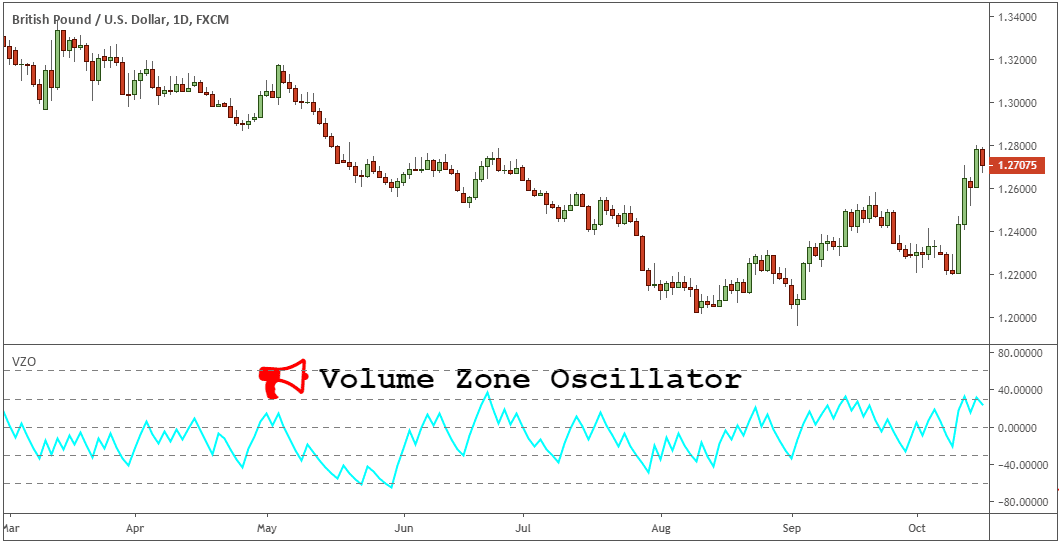
See Volume Zone Oscillator chart below:
Unlike other oscillators, VZO moves between relative percentage levels. The volume zone extreme levels are -60% and +60%. These are the limit of the oscillator range.
But, in between these volume zones, we can distinguish more relevant volume zones that can generate buy and sell signals depending on the volume zone.
Here’s the thing…
Volume can’t be used as a precise entry and exit tool.
Do you know how to use volume?
Below, we’re going to outline a guide on how to trade with the Volume Zone oscillator.
How to Use Volume Zone Oscillator?
We’re going to reveal how to interpret the volume zone readings.
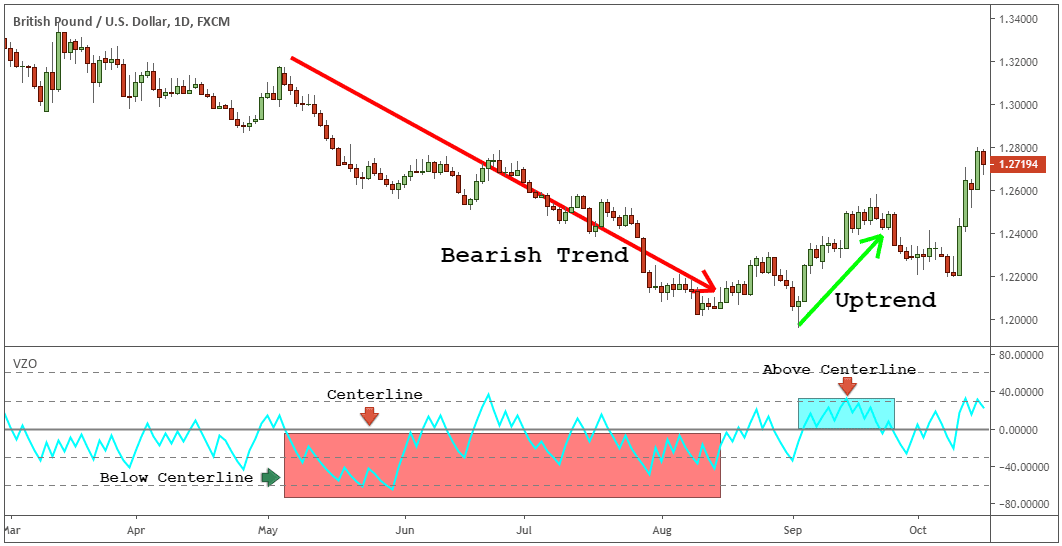
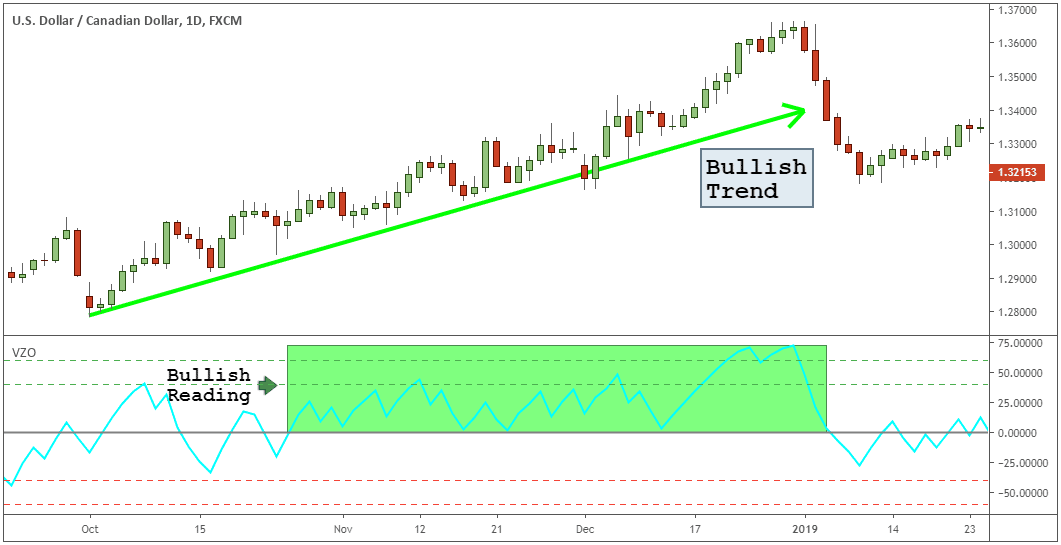
A move above the centerline will give us a bullish reading. And, a move below the centerline will give us a bearish reading.
See VZO chart below:
The most important volume zones are “+60”, “+40″, “0″, “-40”, and “-60”.
Additionally, traders also use the “+5”, and “-5” volume zone readings.
Here is how to use VZO in your trading decisions.
Here are the four main volume zones to keep an eye on:
- When VZO rises above and maintains the 5% level, it marks the early phase of an uptrend. Conversely, when VZO falls below the -5% level, it marks the early phase of a downtrend.
- Oscillations between 5% and 40% volume zones mark a bullish trend zone. Conversely, a reading between -5% and -40% volume zones mark a bearish trend zone.
- An overbought signal is generated when we have a reading above the 40% volume zone. Conversely, an oversold signal is generated when we have a reading below the -40% volume zone.
- Reading above the 60% volume zone is an extremely overbought reading that can signal a bearish reversal. While a reading below the -60% volume zone is an extremely oversold reading that can signal a bullish reversal.
Let’s see what trading tactics we can use with the volume-based indicators.
But, first, let’s remember the Dow’s basic tenets.
During bullish trends, volume rises with rising prices. The same is true in reverse for bearish trends.
This is basic 101 uptrend volume psychology.
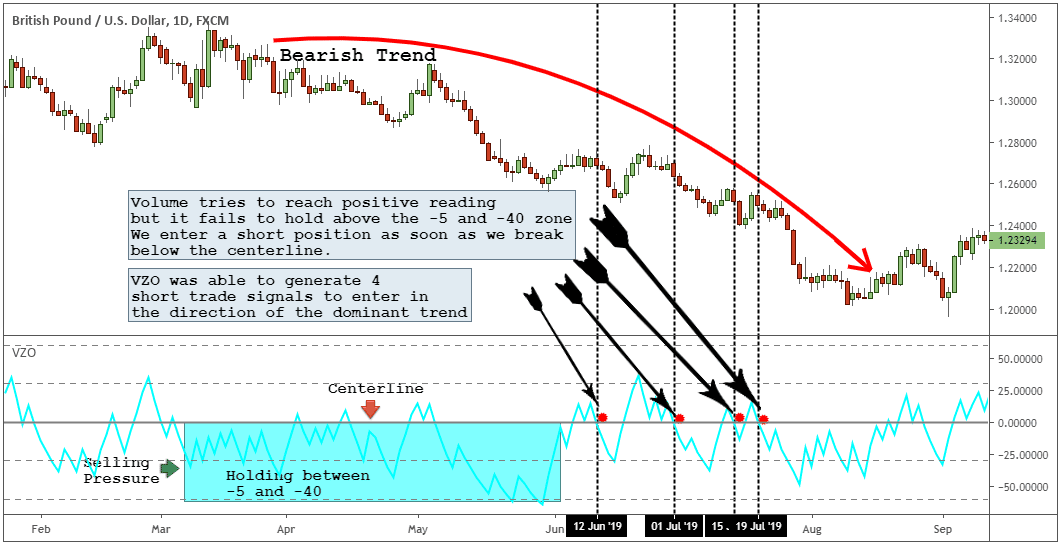
For this purpose, let’s examine again the GBP/USD chart.
We’re in a clear, strong bearish trend. The VZO is below the centerline signaling selling pressure. The volume zone reading between -5% and -40% also indicate a sustained downtrend zone. When the VZO is retracing from -40 and fails to reach the upper boundary (>+40) it’s an indication that the sellers are still in control.
In this case, if VZO will not reach the upper boundary and rebounds from a volume zone below 40 a buy signal is generated when we cross below the centerline.
The GBP/USD chart above demonstrates how during bearish trends, the VZO has the tendency to stay in the lower volume zone fluctuating between 0 and -40.
This is a good method to identify the direction of the trend and trade with the trend.
Want to learn more about oscillators? Be sure to read the Stochastic Oscillator Article.
Now, let’s see if you got the idea behind the VZO indicator.
Can you spot the trend direction of the VZO chart below?
If you said it’s a bullish trend, you’re right. The volume zones are self-explanatory. We’re above the centerline and moving between +5 and +40 volume zone.
Now let’s see the full picture:
Final Words – Volume Oscillator
With a little bit of practice, you can master trading with Volume Zone Oscillator. Remember that volume analysis must always be used in conjunction with a price analysis. This will lead to having effective buy and sell signals. The volume oscillator indicator can highlight hidden strengths and weaknesses in the trend that is not visible to the naked eye.
Don’t forget this is a leading technical indicator that will reveal the buying and selling pressures resulted from the continuous battle between the bulls and bears. To benefit from volume indicators we recommend you investigate them meticulously.
This war-of-tug battle between the buyers and sellers is what makes price moves. So knowing what happens behind the scene can be an edge. Makes sure you master these trade concepts before you invest your hard-earned money.
If you’re ready to learn more about oscillators, be sure to read the RSI Indicator Strategy.
Thank you for reading!
Feel free to leave any comments below, we do read them all and will respond.
Also, please give this strategy a 5 star if you enjoyed it!
[ratings]






Very good article, thaks for publishing it
Glad you enjoyed it!
I’m not sure where you’re getting your info, but good topic.I needs to spend some time learning more or understanding more.Thanks for fantastic information I was looking for thisinformation for my mission.