Shooting Star Candle Strategy


The shooting star candle strategy explores a small bearish reversal candlestick pattern that looks similar to the inverted hammer. Among price action traders the shooting star is also known as the Pin Bar and it has some distinctive price features. This makes it a very “dangerous” pattern if it develops at the right location.
If this is your first time on our website, our team at Trading Strategy Guides welcomes you. Make sure you hit the subscribe button, so you get your Free Trading Strategy every week directly into your email box.
Once you understand what shooting star trading is, you’ll understand why a one candle pattern has such a power to signal the reversal of a bullish trend. Very few people are good at reversal trading. In fact, most traders do it so badly that they burn out their accounts.
The best shooting star strategy will address this issue and will show you how to catch a falling knife without cutting off our fingers. The shooting star candlestick pattern can help you how to spot a top in the market and how to trade it properly.
First of all, let’s just go through some basics:
Shooting Star Candlestick Chart Pattern – Definition
A shooting star is a bearish reversal chart pattern that is characterized by a long upper wick, little or nonexistent lower wick and a small body. In technical analysis, the shooting star pin bar is made up of a single candlestick.
The shooting star inverted hammer is only reliable when they occur at the end of uptrends.
The figure below is a good representation of a Shooting Star candlestick pattern:
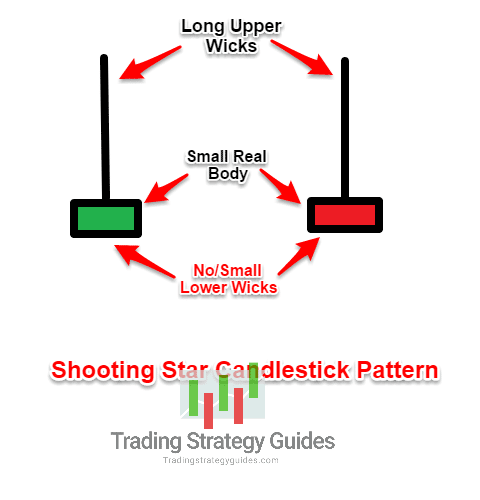
Depending on your chart settings, the real body of the inverted hammer can be either green (bullish) or red (bearish). However, the bearish shooting star is more powerful because the closing price is lower than the opening price.
Another characteristic of the bearish shooting star is that the wicks need to be at least 2-3 times the size of the body.
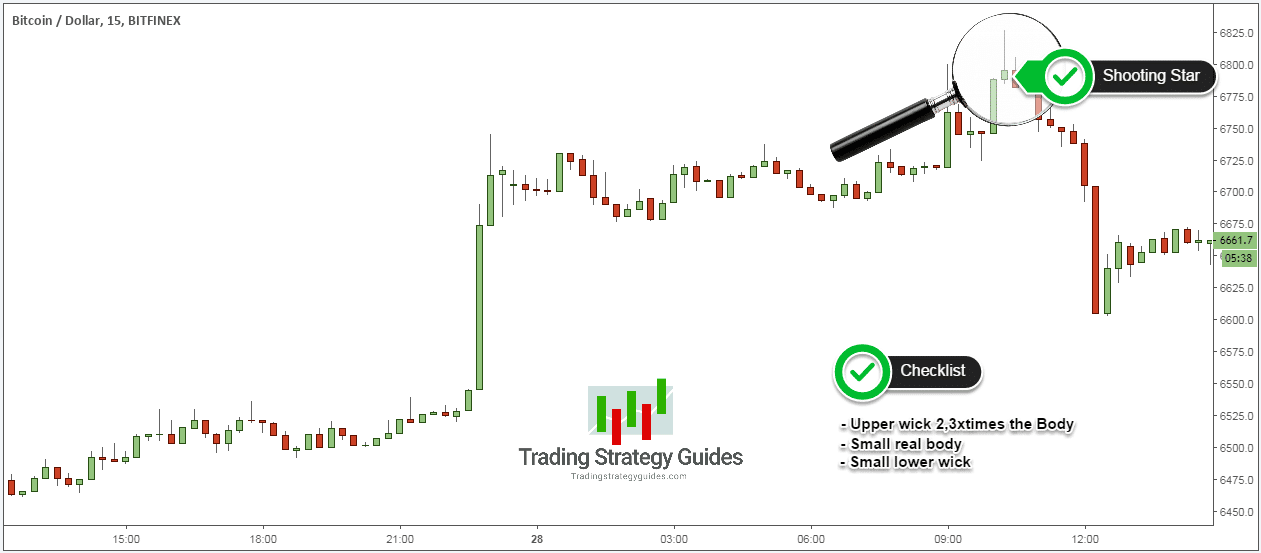
Here is how an actual shooting star pattern looks like on a candlestick chart:
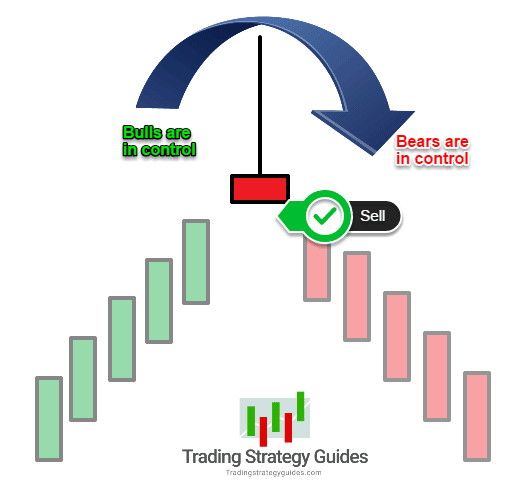
To properly understand the bulls and bears battle behind the shooting star pattern, let’s examine this candlestick pattern in more detail.
See below:
The Psychology Behind Shooting Star
Who is in control?
The Bulls? Or the Bears?
Initially, the bulls are in control as the prevailing uptrend continues to stay in motion. The bulls drive the price to new highs. Once the bulls hit the climax point and hit the high of the candle, everything looks bullish.
However, at this stage, the bears step into the market and fight back. They succeed in overcoming the bulls and drive the price back down below the opening price.
In the case of a bearish shooting star, the closing price would be below the opening price and near the low of the bar. And, in the case of a bullish shooting star, the closing price would be above, but near the opening price, in its close proximity.
The ability of a bearish inverted hammer to pressure the close of the candle below the opening price gives the bearish shooting star more power to reverse the prevailing bullish trend.
What is Shooting Star Trading?
We need to train our eyes to read the sentiment of the hammer candle, taking in consideration the whole market environment. It’s futile to try to identify the exact textbook shooting star.
If you don’t have a bullish trend preceding the inverted hammer candle, then it’s not a tradable candlestick pattern. In this case, shooting star trading will fail.
The shooting star candle is only confirmed once we break below the low of the candle. But depending on your risk profile, you should always seek confirmation from other sources to validate the trade.
We don’t recommend to be an aggressive trader when trading shooting star chart patterns.
You can backtest different types of entry strategies, but be aware that the more confluence points you use, the further the price can move from the ideal entry price.
Now, before we’ll outline the rules of the best shooting star strategy. We always recommend taking a piece of paper and a pen and note down these rules.
For this demonstration, we’re going to look at the bearish shooting star or the inverted hammer.
Shooting Star Candle Strategy
The shooting star candle strategy is a very simple but very effective methodology to trade the financial markets. You can trade stocks, Forex, currencies, commodities, futures and even cryptocurrencies across various time frames.
The kinds of trade setup we’re going to propose through this reversal trading strategy have an astonishingly high rate of success. However, the only downside is that they will only show up on your Forex candlestick chart once in a while.
Let’s get started and get our feet wet.
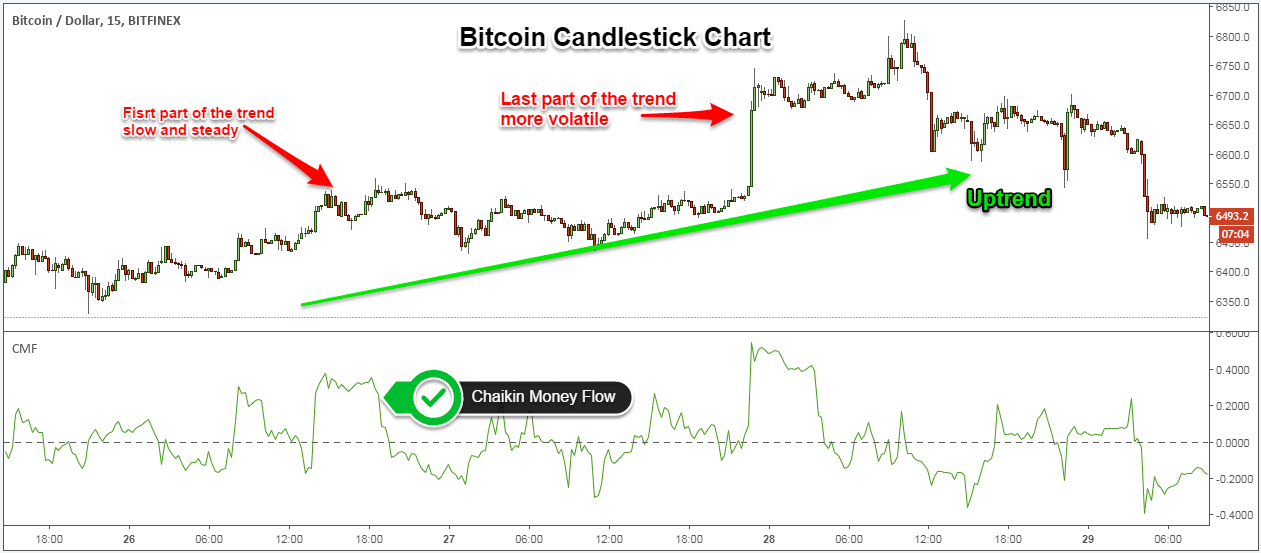
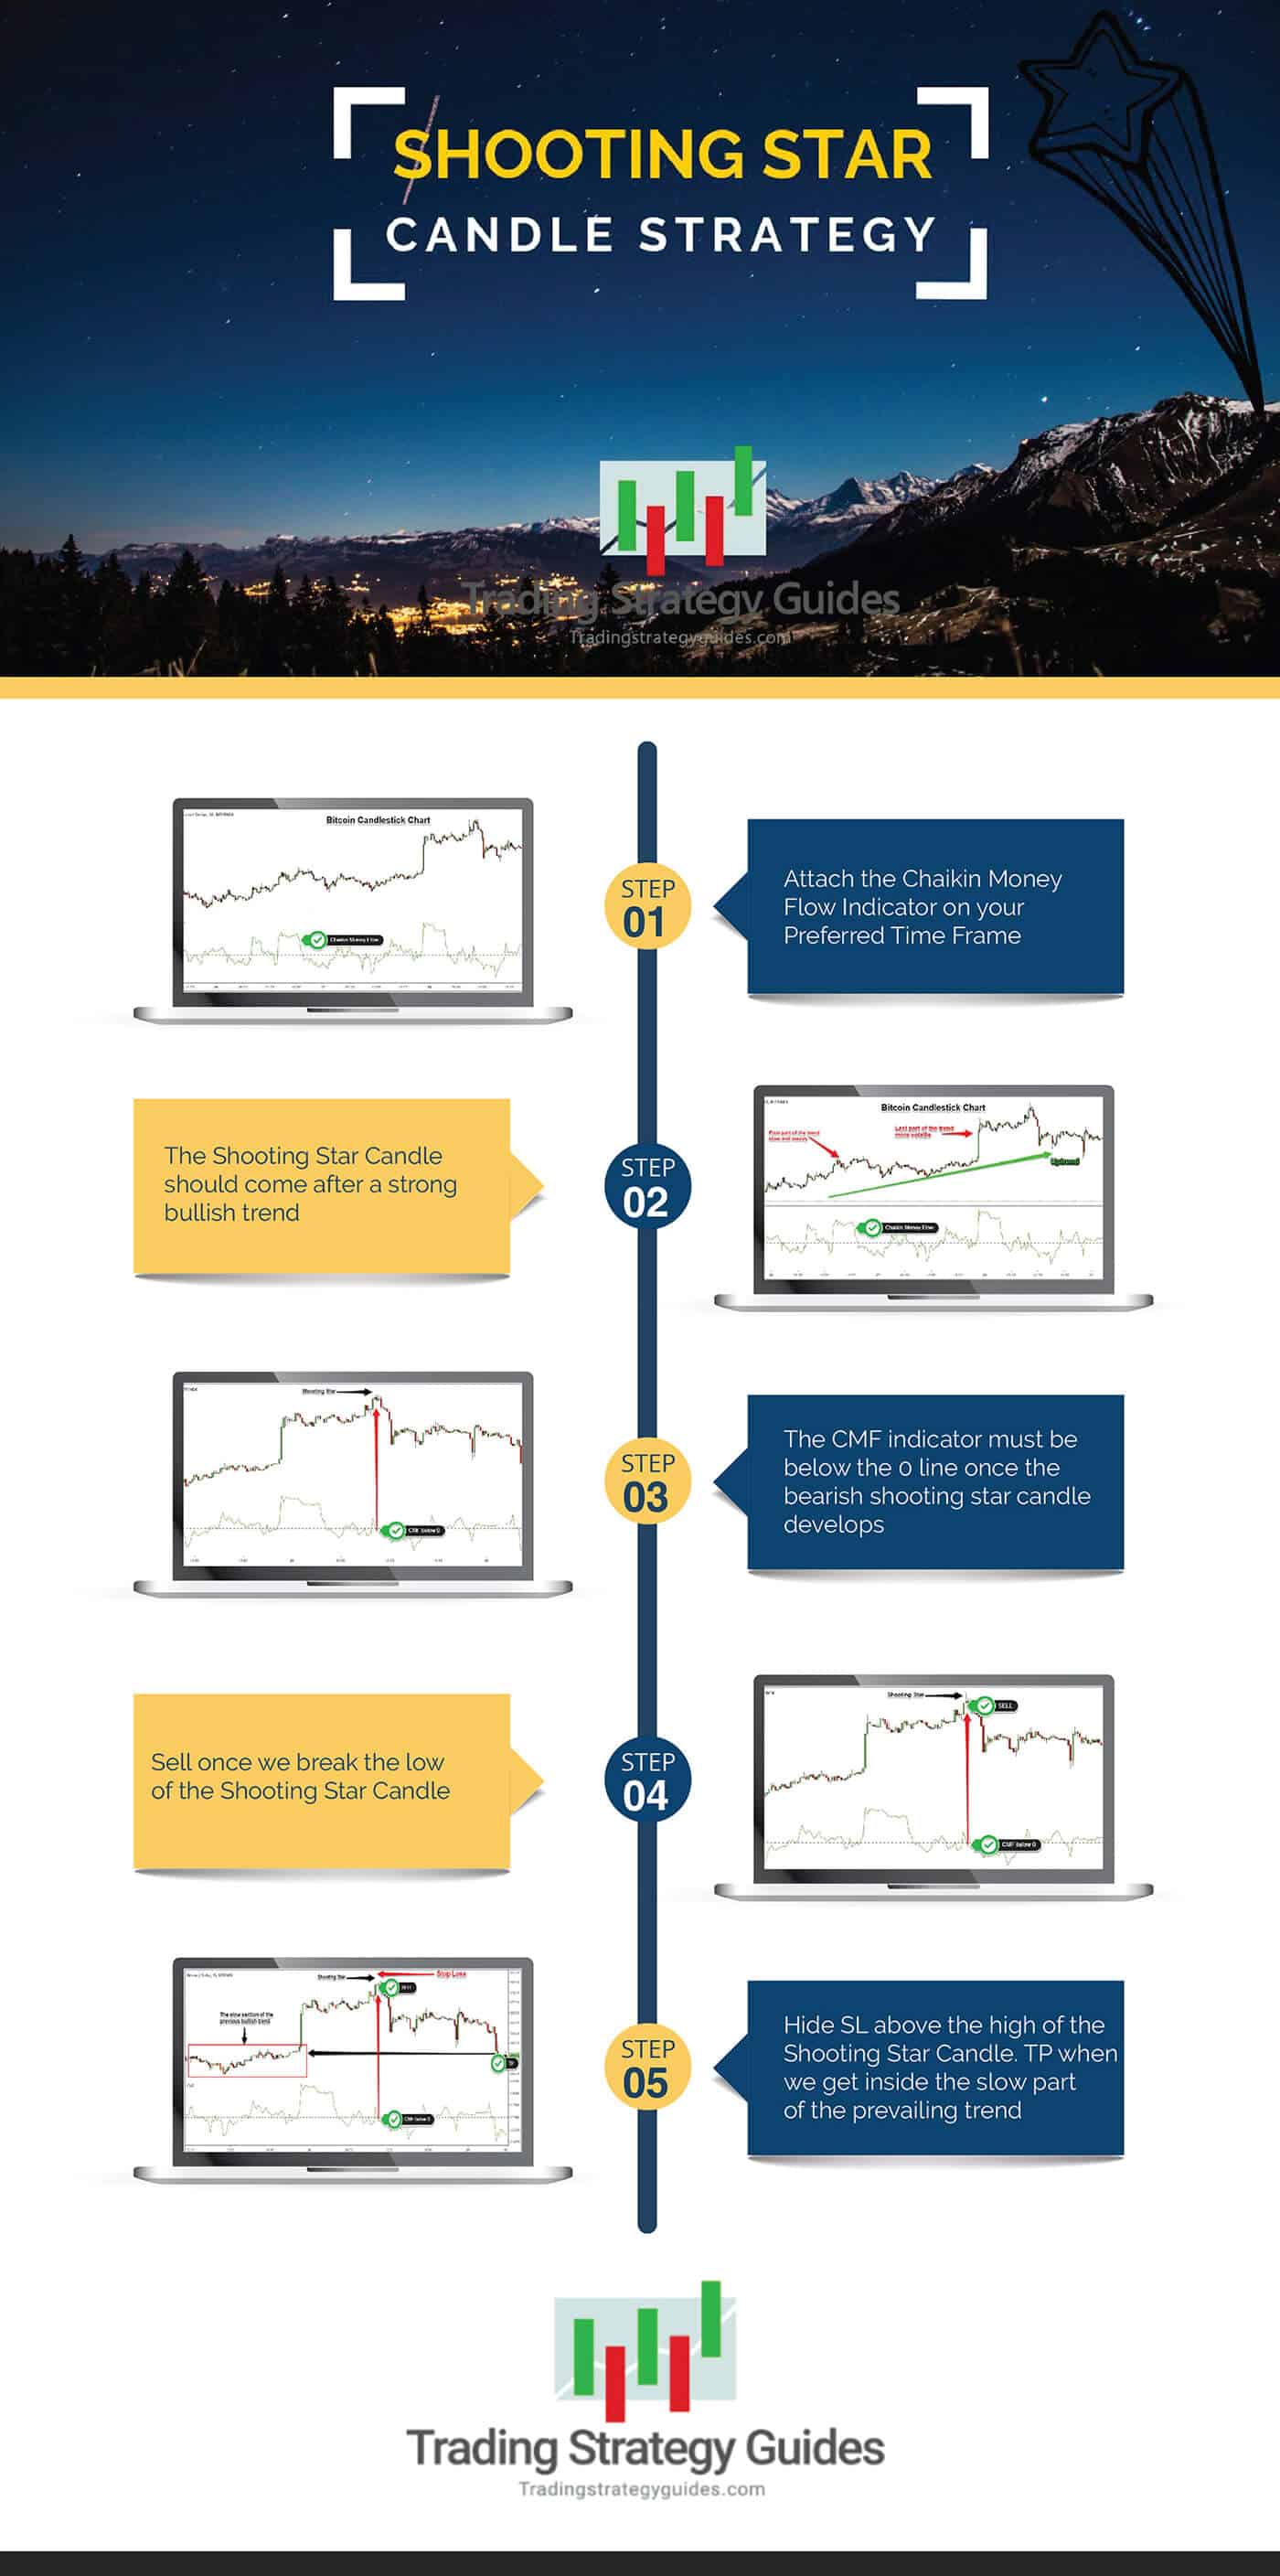
Step #1: Attach the Chaikin Money Flow Indicator on your Preferred Time Frame
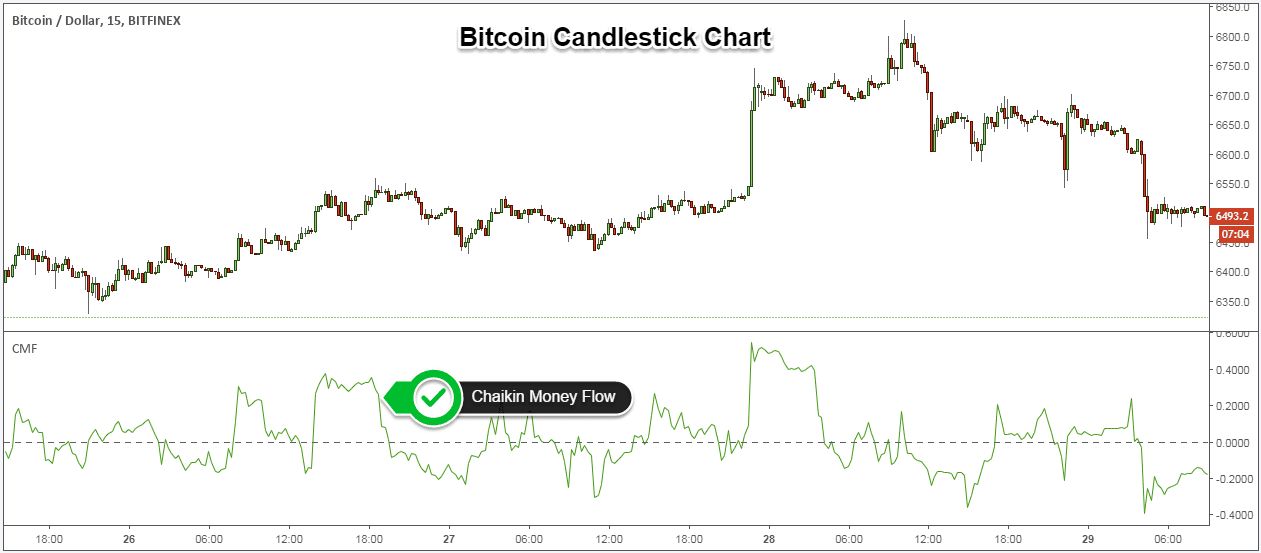
Start first by preparing your charts ready for the battle. Simply attach the Chaikin Money Flow indicator on your favorite time frame. This is the only additional technical tool we’re going to use to confirm the validity of the bearish shooting star pattern.
Using the CMF indicator, we accomplish one major thing.
The validity of the bearish shooting star will be confirmed or invalidate instantly as soon as the bearish inverted hammer develops on our Bitcoin candlestick chart. This means that the price won’t move any further from the ideal entry price.
Let’s now turn our focus on the price action.
See below:
Step #2: The Shooting Star Candle should come after a strong bullish trend
The location, or where the shooting star candlestick develops, matters a lot.
This whole ingredient is what makes the bearish shooting star candle performs with such a high degree of accuracy. We need a strong uptrend that has two important features:
- The first part of the trend is a slow and steady move to the upside
- The last part of the uptrend, prior to the shooting star candle, needs to be more volatile.
Basically, we’re looking for a full-blown market top where the bulls are exhausted and reach a climax point.
Let’s now zoom into the chart and see if the inverted hammer satisfies all the requirements.
See below:
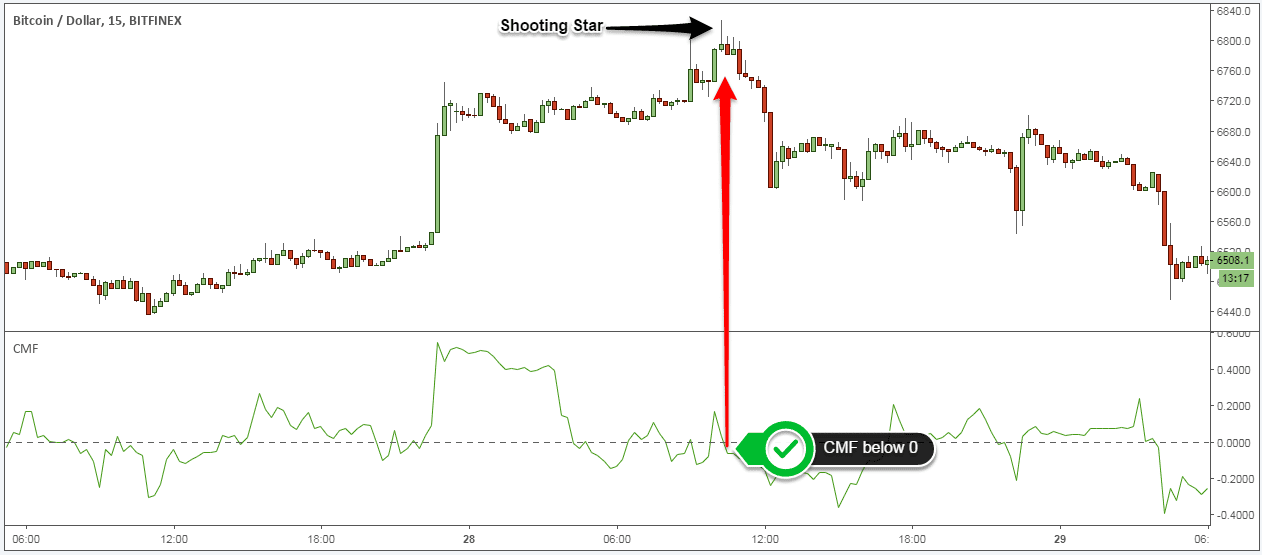
Step #3: The CMF indicator must be below the 0 lines once the bearish shooting star candle develops
Chaikin Money Flow is a great tool to read and measure institutional accumulation-distribution activity in any market. Basically, a CMF reading below the zero line shows that the sellers have the upper hand and they took control of the market.
Notice that the bearish shooting star spotted satisfies all the requirements of a bearish inverted hammer. The shadows are at least two times longer than the body, small body, and very little lower shadow. This candle would have been more powerful if the closing price is below the opening price.
But it’s still a good pattern to trade due to all the other features.
Now, it’s time to highlight how to find the right entry point for bearish shooting star candlestick.
See below:
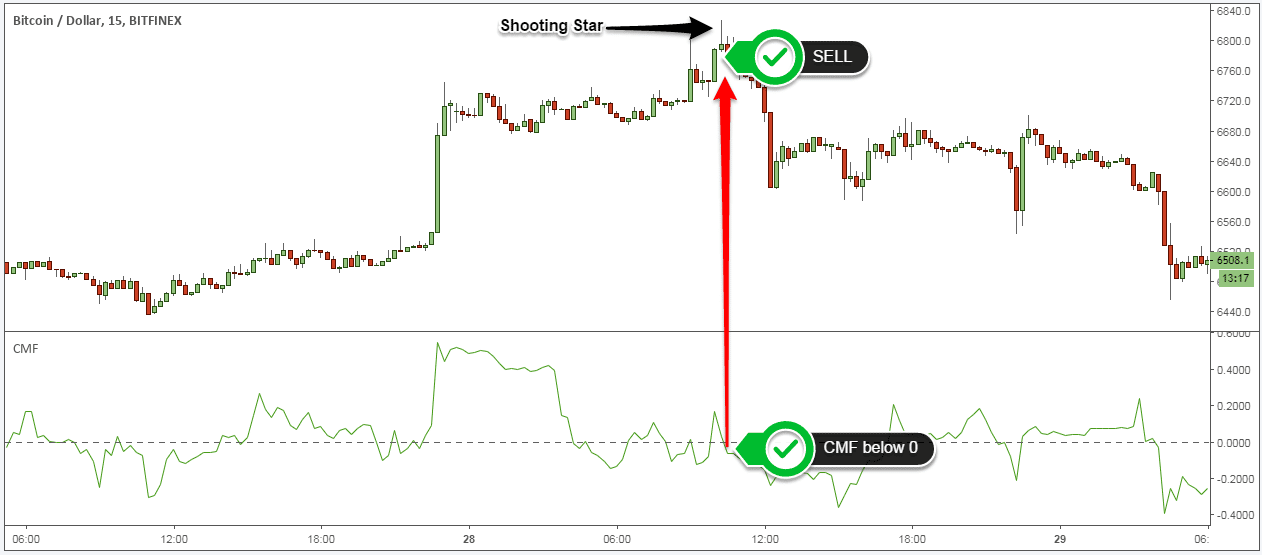
Step #4: Sell once we break the low of the Shooting Star Candle
Simply place a limit sell order below the low of the shooting star. Nothing complicated about our entry strategy. It’s in line with the textbook rule.
What is the ideal place to hide your protective stop loss? Where should you exit a profitable trade when trading shooting star candle?
See below:
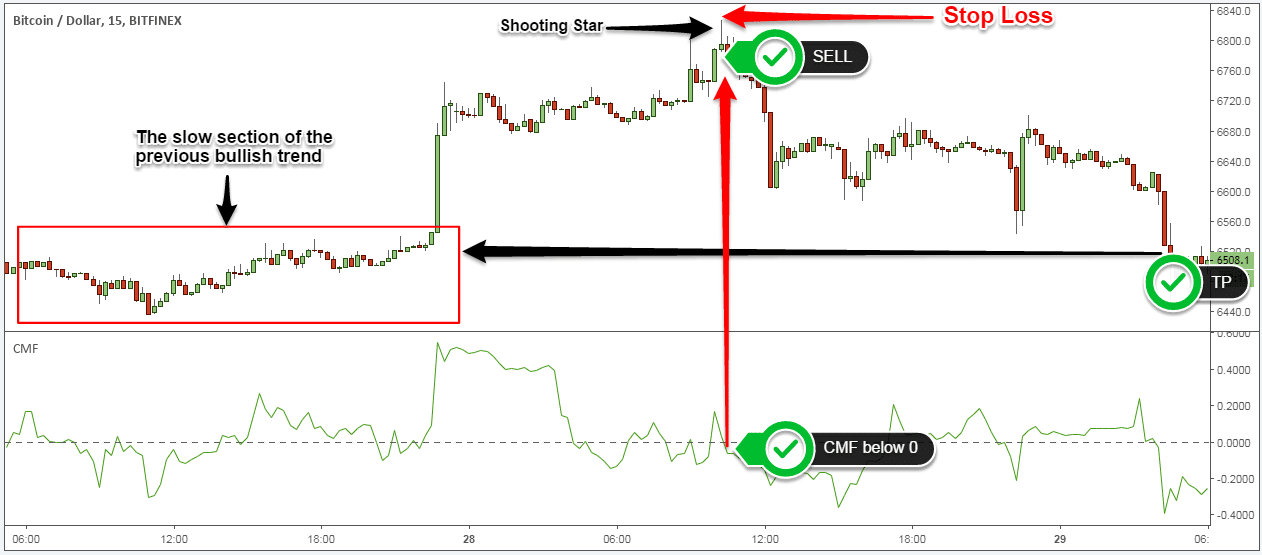
Step #5: Hide SL above the high of the Shooting Star Candle. TP when we get inside the slow part of the prevailing trend.
Simply hide your protective SL above the high of the shooting star pattern. You can add a buffer of a few pips if you wish to protect against possible false breakouts.
The full-blown top creates the necessary space where the bears would find no level of support to stop the drop. The last stage of a trend has been always more volatile. When combined with the reversal shooting star pattern, it makes for a killer trading strategy.
In this regard when the price reaches the portion where the prevailing uptrend was moving slow, we take profits. That’s where the price will find some hostility to advance further on the downside. We want to clear out our position when that happens.
Conclusion – Best Shooting Star Strategy
The best shooting star strategy is one of the most reliable and efficient ways to trade trend reversals. This single candlestick pattern can offer you one of the most attractive risks to reward ratios. You can risk between 10 and 30 pips and look to gain between 200 and 300 pips which gives you a profit of 20x or 30x the risk taken.
Take that into consideration next time when you’re able to find a shooting star candle that satisfies all the rules outlined in this trading strategy guide.
A lot of traders will warn you against reversal trading. However, finding tops in the market and trading reversals can be done successfully if you have a proven methodology like our shooting star candle strategy.
Thank you for reading!
Feel free to leave any comments below, we do read them all and will respond.
Also, please give this strategy a 5 star if you enjoyed it!
[ratings]
Please Share this Trading Strategy Below and keep it for your own personal use! Thanks Traders!





(1) I am unable to find an actual website where I can choose a company and see its candlestick charts. Please send me a link. (2) What does it mean to TP and how do you do it? (3) Can you really hide a stop-loss indicator? I’m wary because I’ve been told that unethical market-makers can manipulate them. Thank you for your patience. I am the noobs intern so I need ABC 123.
I have been absent for some time, but now I remember why I used to love this website. Thank you, I¦ll try and check back more often. How frequently you update your web site?