Money Flow Index – Trading Like the Banks
Learn how to trade like the banks with the Money Flow Index. This trading guide will teach you how to determine the market sentiment with the Chaikin Money Flow indicator. The Chaikin Money Flow indicator is regularly used on Wall Street. By taking the time to learn more about the money flow index (and money flow in general), you can identify potentially profitable trading positions. If you want to learn a unique methodology used by the big banks, we have developed a blueprint to buy low, sell high.
If this is your first time on our website, our team at Trading Strategy Guides welcomes you. Make sure you hit the subscribe button, so you get your Free Trading Strategy every week directly into your email box.
The interactions between buy and sell orders, or in other words the supply and demand imbalances, are what cause prices to move. Knowing what the money is doing makes it a little bit easier to buy and sell in the stock market (and other markets like the Forex market, Futures market, cryptocurrency market, options market, etc.).
If you want to equip yourself with the right knowledge to win the war with the world’s biggest financial market check out How to Trade Forex for Beginners Guide.
Once you understand how smart money works and where to look for its accumulation and distribution on a chart, you can make profits along with the big guys. The smart money flow index can make the difference between success and failure. You should never enter a trade unless you know the cause behind the price movement.
The naked truth is that most traders fail because of a lack of understanding of what happens behind the price action. Using technical indicators, such as the Money Flow Index, can help. Moving forward, we’re going to break down how the money flow index can help you read when the smart money is buying and selling.
What is the Money Flow Index?
The money flow index is a sentiment-based indicator that seeks to gauge the inflow and outflow of money from securities. The money flow index is also referred to as the MFI indicator. The Money Flow is part of the oscillator family of indicators. Developed by Gene Quong and Avrum Soudack, the oscillator uses both the price data and volume data to measure the buying and selling pressure.
Check the different types of Forex indicators: Best Forex Indicators to Generate Buy and Sell Signals.
The significant relationship between the price to volume and the time frame is what makes the Money Flow Index indicator so reliable. The MFI indicator can be seen as volume-weighted RSI because it uses the RSI formula to calculate when smart buying and selling occurs.
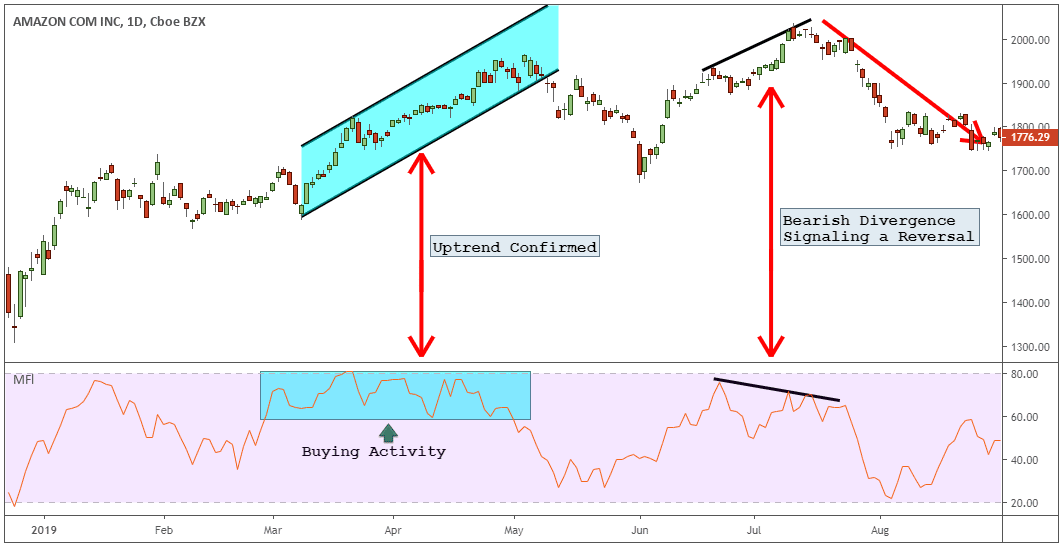
Because of the RSI element involved in the calculation, the money flow can also be seen as a momentum indicator. As a momentum indicator tied to volume, the money flow can also be used to spot three basic signals:
- Overbought and oversold signals.
- Bullish and Bearish Divergence signals.
- Trend Confirmation signals.
Using multiple signals will make it easier to create a dynamic trading strategy. If you want to try for free a trading strategy based only on the RSI indicator, see the 80-20 RSI Trading Strategy to help you land great trade entries.
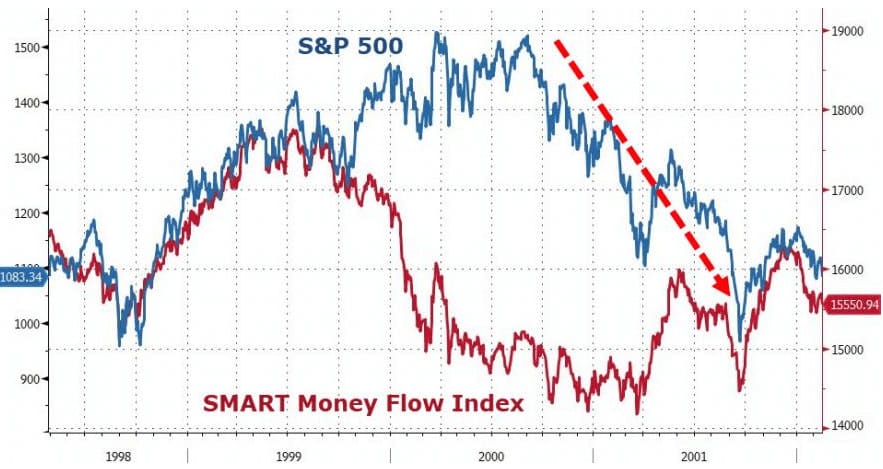
The money flow index indicator is not to be confused with the smart money flow index by Bloomberg or WSJ money flow. The smart money index is highly correlated with the US stock market index.
The smart money index chart has helped professional investors to correctly predict the Black Monday 1987, the great financial crisis of 2017, and the dotcom crash.
A money flow chart you must see:
The concept behind this sentiment-based indicator is going to be revealed below:
Bloomberg Smart Money Flow Index
The Smart Money Index is also known as the SMI indicator was developed by money manager Don Hays.
Here is what you need to know about this sentiment-based indicator:
The smart money flow index SMFI is a tool used in technical analysis to gauge the activity of “smart money” aka the professional traders versus the “dumb money” aka the retail traders or amateurs. The main concept behind the smart money flow is centered on two trading ideas:
- Dumb money usually trades during the first half-hour after the US stock market open
- Smart money usually trades during the last hour before the US stock market close.
So how to calculate the Bloomberg smart money flow?
Today’s Smart Money Index = yesterday’s Smart Money Index – the market’s gain (or loss) in the first half hour of trading today + the market’s gain or loss in the last hour of trading day.
The terms “smart” and “dumb” don’t necessarily correlate with trader intelligence. Instead, these terms are used to help distinguish traders who are reactive (dumb) from traders who are predictive (smart).
Let’s see how the smart money index works in a real-life situation so we can better understand the logic behind the sentiment reading. We assume the Dow Jones Industrial Average goes up in the first half-hour of the trading day, but during the last hour of the trading day it goes down. Since the smart money operates during the last hour of the trading session this is a bearish signal.
The interpretation is that the smart money is selling at the end of the day while the dumb money is buying at the start of the day.
There is a reason why the smart money is seen to trade near the daily close. This way smart money can better digest the entire day’s trading session. By the end of the day, all economic news is out and already factored in by the price action.
Don’t worry if you don’t have the Bloomberg terminal, you can still access the SMI indicator on free trading platforms like TradingView.
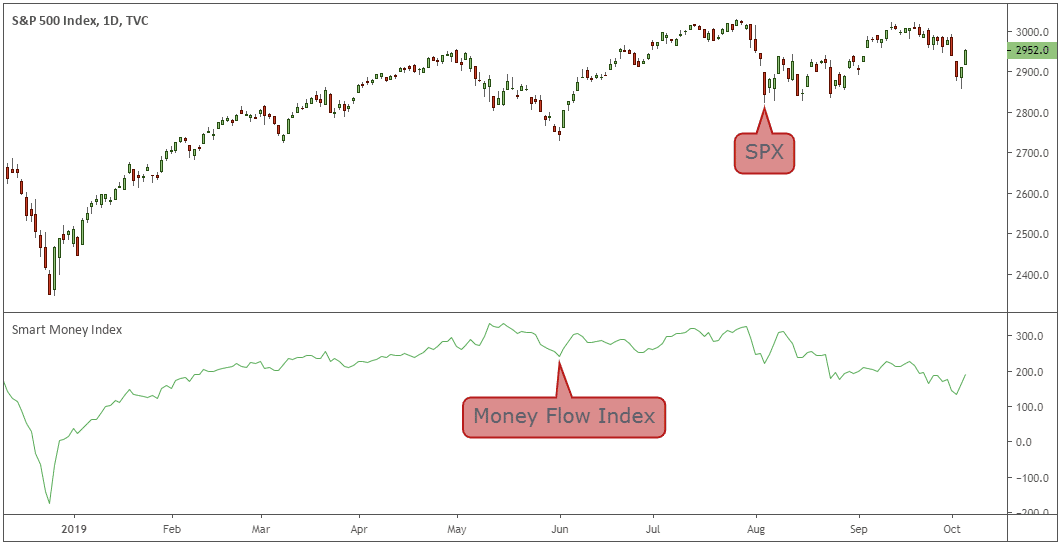
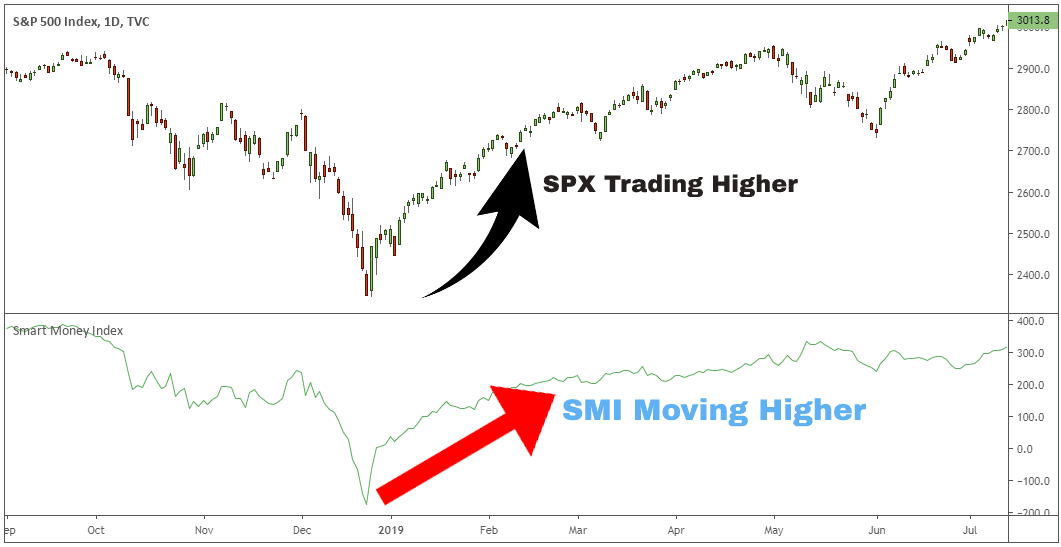
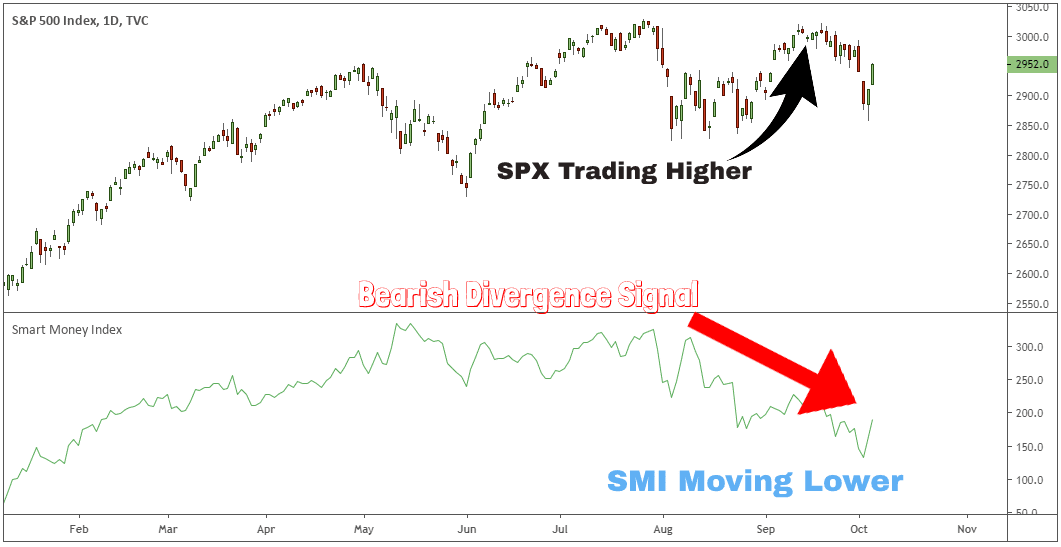
See the Smart Money Flow Index chart below:
Let’s get one step forward and examine how professionals use the SMI indicator:
How to Use the Smart Money Flow Index
Professional traders use the SMI indicator as a trend confirmation tool for the US stock market. The smart money flow can easily confirm or infirm whether or not a trend is genuine or not. We can distinguish two possible trade scenarios:
- If the US stock market is in a bullish/bearish trend and the smart money flow index moves higher/lower at the same time, that’s seen as a bullish/bearish confirmation of smart money being behind the stock market trend.
- If the US stock market goes up/down, but the SMI trends down/higher, that’s seen as a bearish/bullish divergence. This means that the trend will eventually mean-reverse to the SMI’s direction.
Money Flow Index Podcast Interview
Here is a great interview about using money flow from a professional trader.
Subscribe to the How to Trade it Podcast:
We’ve mentioned so many times the term smart money that we need to clarify who is the smart money.
See below:
Who is Smart Money?
In simple terms, the smart money is the guys who have the power to move the market. Roughly 85% of the market is controlled by smart money, which is referred to as the institutional players.
So, who is the smart money?
In general, we can distinguish five types of institutional players:
- Hedge Funds
- Investment Banks
- Pension Funds
- High-Frequency Trading Algos (If you want to learn how High-Frequency Trading Works make sure you check our guide)
- Prop Trading Firms
Smart money will leave a print on the money flow indicator. Smart money can dictate the supply and demand forces in the market place. This makes them a powerful force because they can drive the price of any security.
The Money flow indicator can’t be used as a light switch. If the light switch is turned on you go long, and if the light switch is turned off you go short. You need to understand how to read the Money Flow Index indicator.
See below:
How to Use the Money Flow Indicator?
How to digest the information given by the smart money flow index?
The money flow oscillator has a range of 0 to 100.
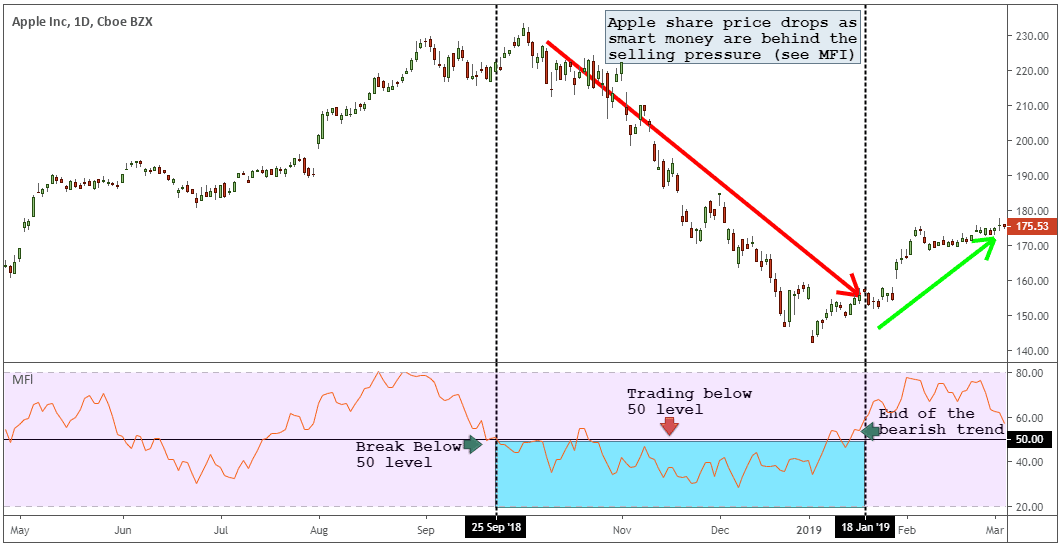
In a bear market, the MFI oscillator will stay below the 50 level. The MFI will progress downwards into the 20-0 range as the selling pressure gains traction.
Once the money flow is in the 20-0 range it signals a super bearish signal.
But, if it falls outside the 20-0 range a potential trade reversal can emerge.
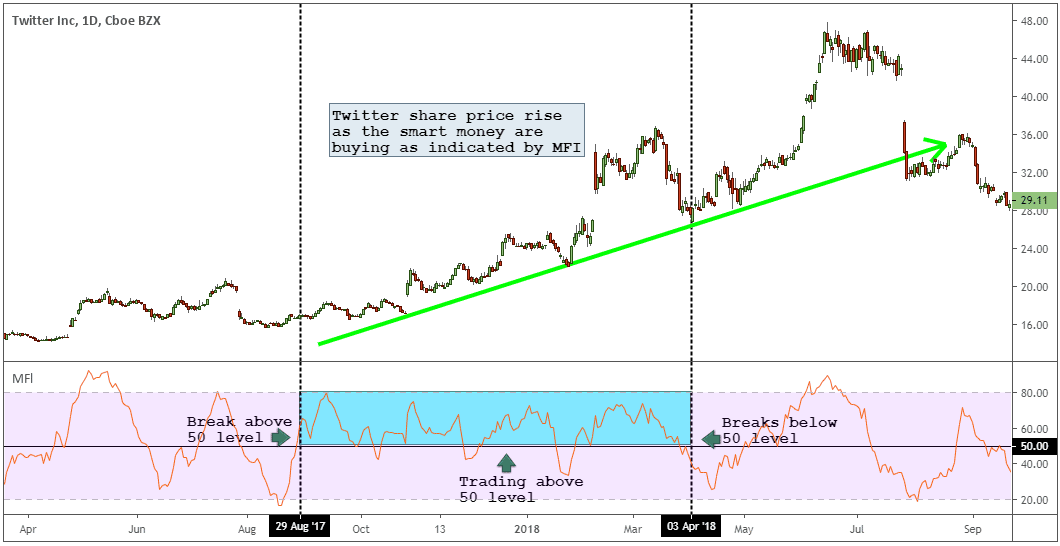
Conversely, in a bull market, the MFI oscillator will stay above the 50 level.
The MFI will progress upwards into the 80-100 range as the buying pressure gains traction.
Once the money flow is in the 80-100 range it signals a super bullish signal.
But, if it falls outside the 80-100 range a potential trade reversal can emerge.
Basically, if for a particular stock the money flow shows a reading above 50 it’s a bullish signal. While an MFI reading below 50 is generally bearish for the stock.
For example, if you see accumulation by the professional traders going on the money flow indicator, it doesn’t mean we’re going to rally. So we won’t go and buy it right away. We need to have a combination of technical ingredients to support a trade signal.
That’s why we look for the footprints that the smart money leaves on the price chart.
Now, let’s dive and see what alternative we have so we can use the smart money indicator in the Forex market as well.
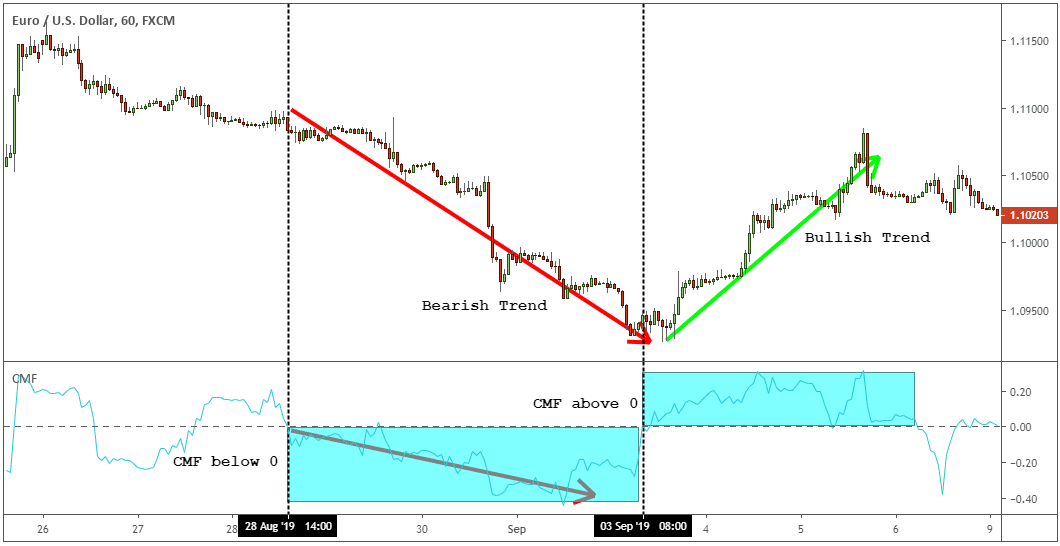
How to Use Chaikin Money Flow?
The Chaikin Money Flow indicator was developed by trading guru Marc Chaikin, who was coached by the most successful institutional investors in the world. This comprehensive indicator can be combined with several different trading strategies.
The reason Chaikin Money Flow is the best volume and a classical volume indicator is that it measures institutional accumulation-distribution.
Typically on a rally, the Chaikin volume indicator should be above the zero line. Conversely, on sell-offs, the Chaikin volume indicator should be below the zero line.
Looking for the best volume trading strategy?
If you can master volume analysis, a lot of new trading opportunities can emerge. Don’t miss the chance to crack the market Using Volume Trading Strategy to Win 77% of Trades.
The smart money is present even in the FX market and their footprints are still visible. With all their efforts to hide their trading activities, the Chaikin Money Flow will give you a window into the volume activity the same way you have when you trade stocks.
Why Use the Smart Money Flow Index?
“A picture (a chart) speaks a thousand words” is an old aphorism that speaks a lot of truth but unfortunately not the whole truth. To really understand what makes a price pattern work, we really need to understand the market forces behind the price chart.
What are the forces behind a price chart?
In simple terms, the interaction between traders placing buy and sell orders is the real force that drives the price.
In other words, this is what we call the money flow. Understanding the money flow will give you a better understanding of how the market really works.
Sometimes the obvious doesn’t seem so obvious, so we feel the need to emphasize the fact that the price action is the effect and the money flow is the cause that makes the price move.
Unfortunately, the center of attention of the majority of traders is on the price (the Effect) and not on the money flow aka the Cause.
Final Words – Smart Money Flow
The money flow index gives dumb money the chance to become smart money. As a final warning, be also aware of the shortcomings of relying solely on the MFI indicator. All sentiment indicators have the problem of generating false buy and sell signals. In this regard, make sure you don’t use the SMI or the Chaikin Money Flow for timing the stock market tops and bottoms, but as a complementary tool to confirm a trade signal.
The interactions between buy and sell orders, or in other words the supply and demand imbalances are what drives the price of any instrument and it’s the reality that matters the most. Once you understand the game behind the price action a new reality will be accessible to you.
Thank you for reading!
Feel free to leave any comments below, we do read them all and will respond.
Also, please give this strategy a 5 star if you enjoyed it!
[ratings]
Please Share this Trading Strategy Below and keep it for your own personal use! Thanks, Traders!





Very valuable information
Glad you enjoyed it!